


Figure 1:
Elevation view of the structure from upstream
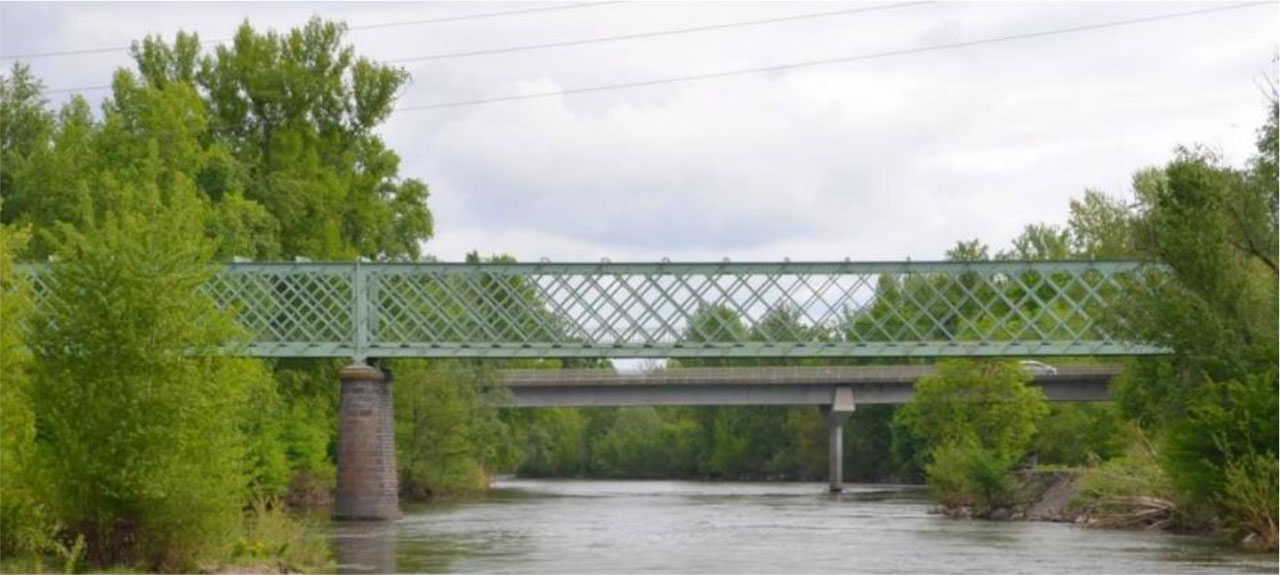
Figure 2:
View of the second span of the bridge (P1–P2) from upstream
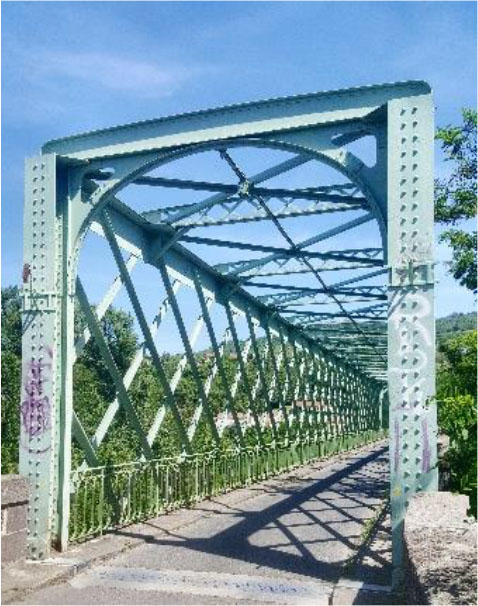
Figure 3:
View from A0
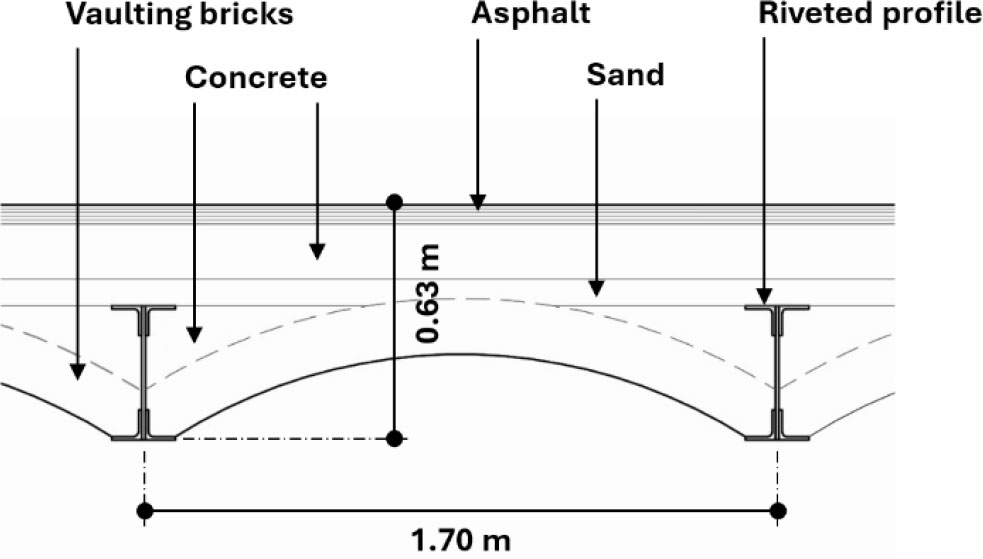
Figure 4:
View of the bridge deck cross-section
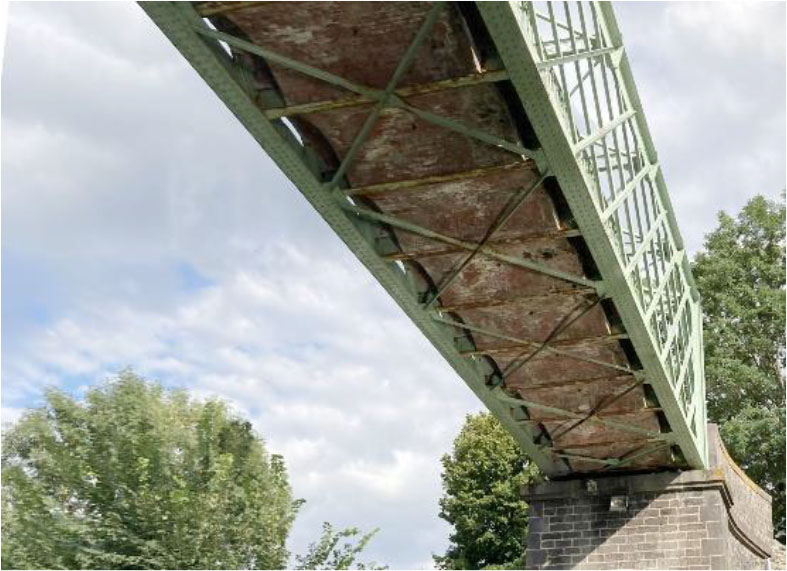
Figure 5:
Bottom view of the existing bridge deck
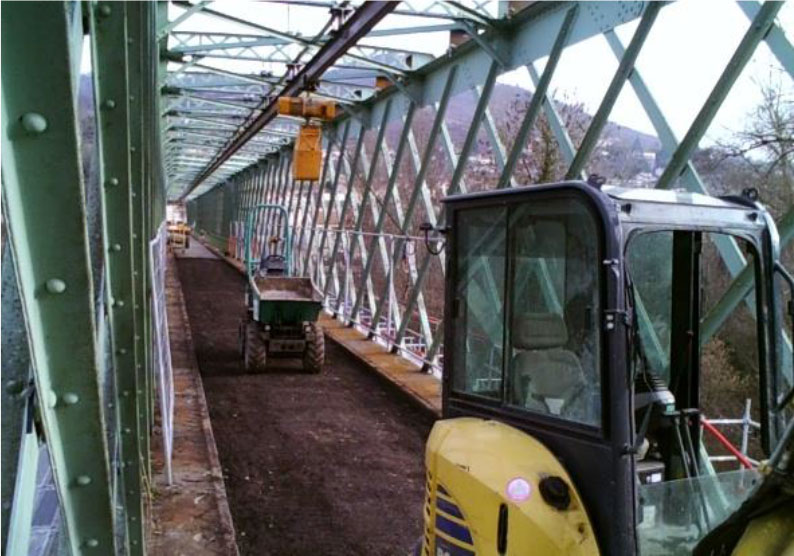
Figure 6:
View of the dumper before demolition
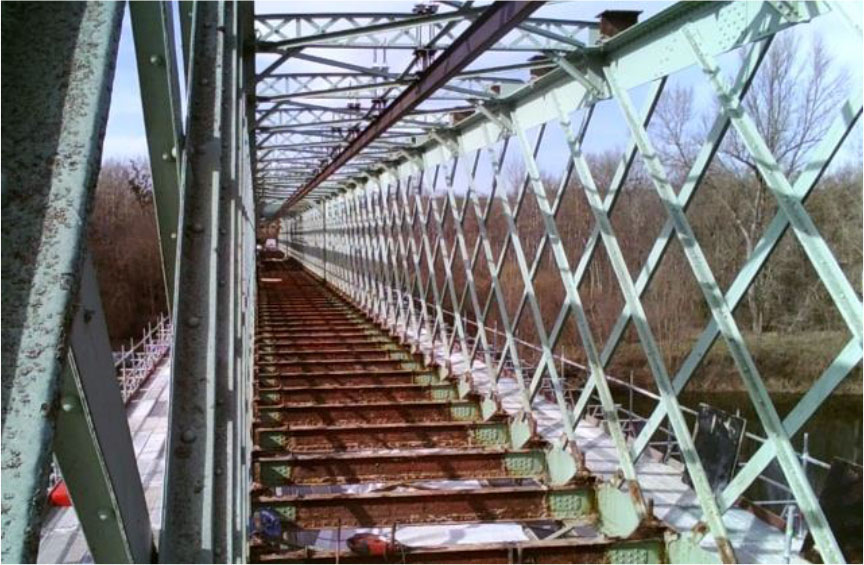
Figure 7:
View after deck demolition
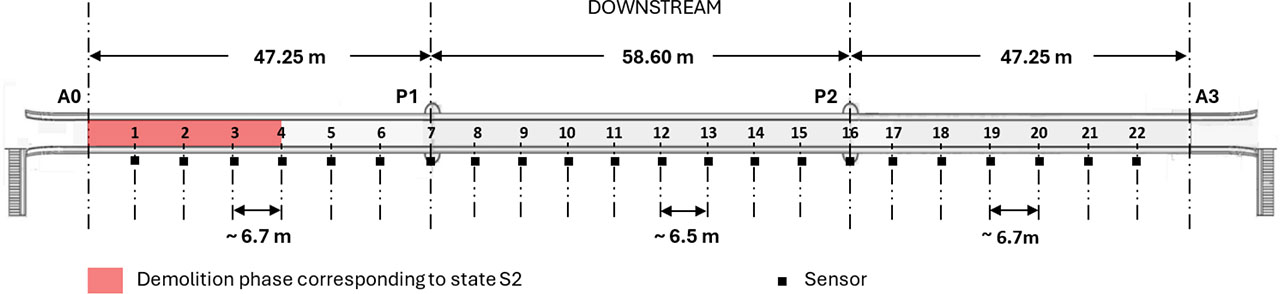
Figure 8:
Plan view showing the location of the 22 accelerometers and the demolition area
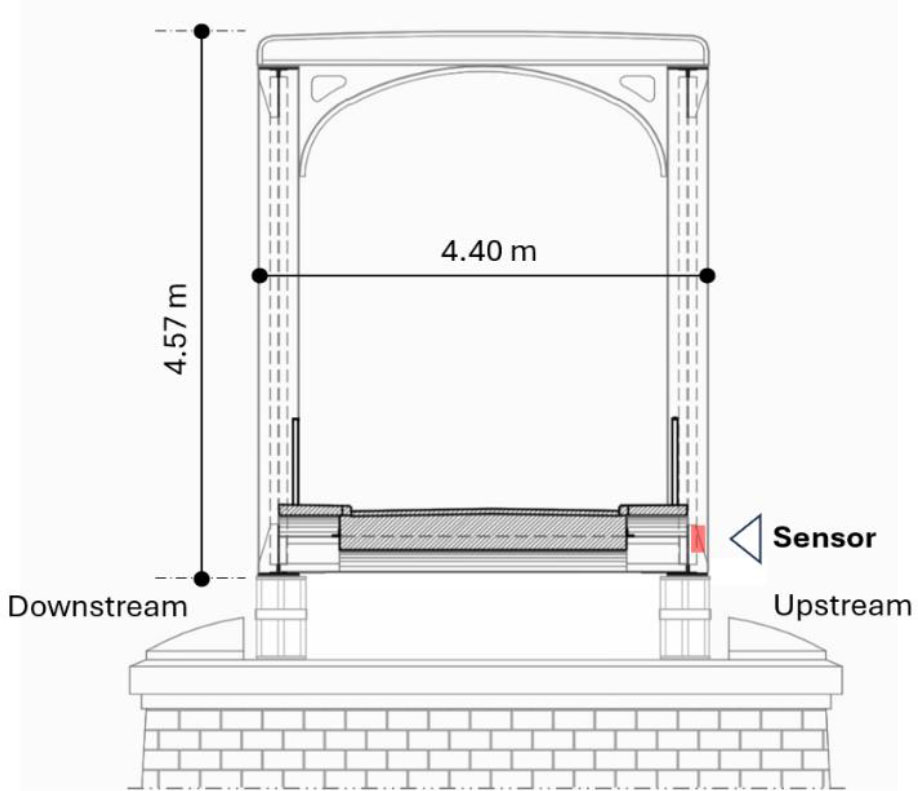
Figure 9:
Cross-section view of the structure
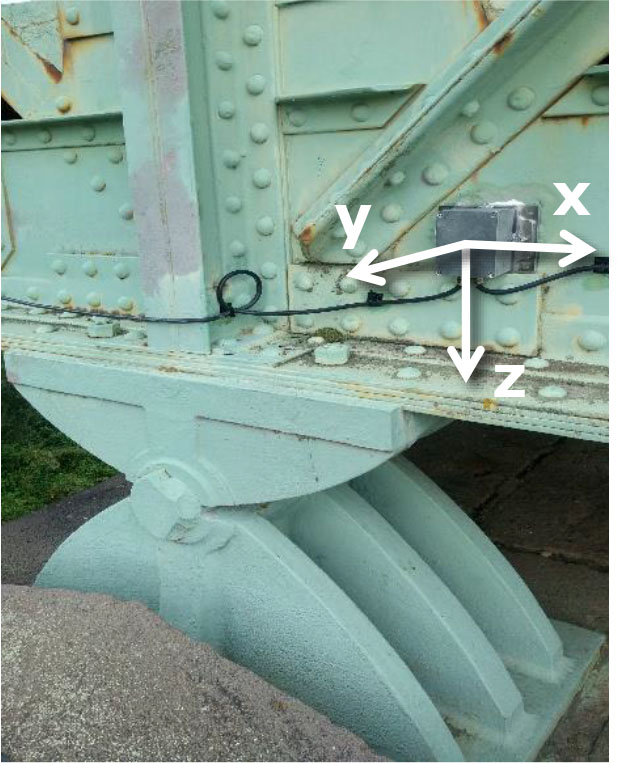
Figure 10:
Sensor reference and hinge support (on Pier P2)
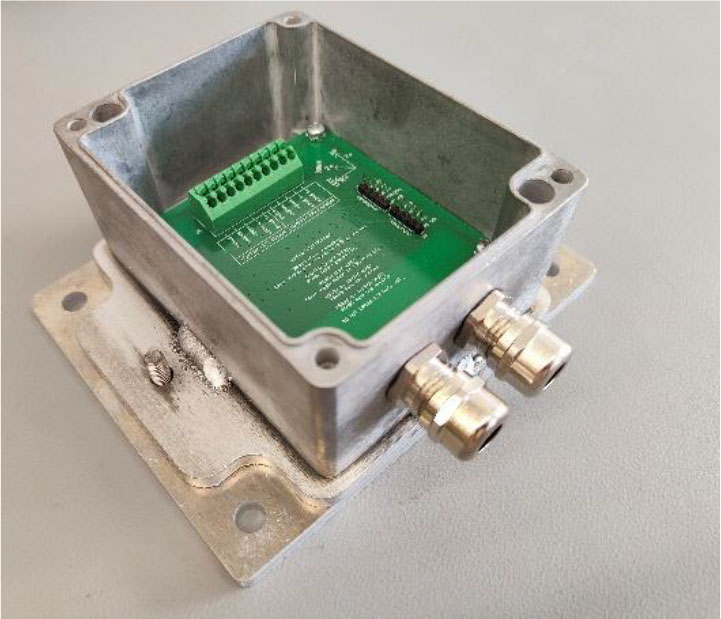
Figure 11:
View of the accelerometer developed by Cideco
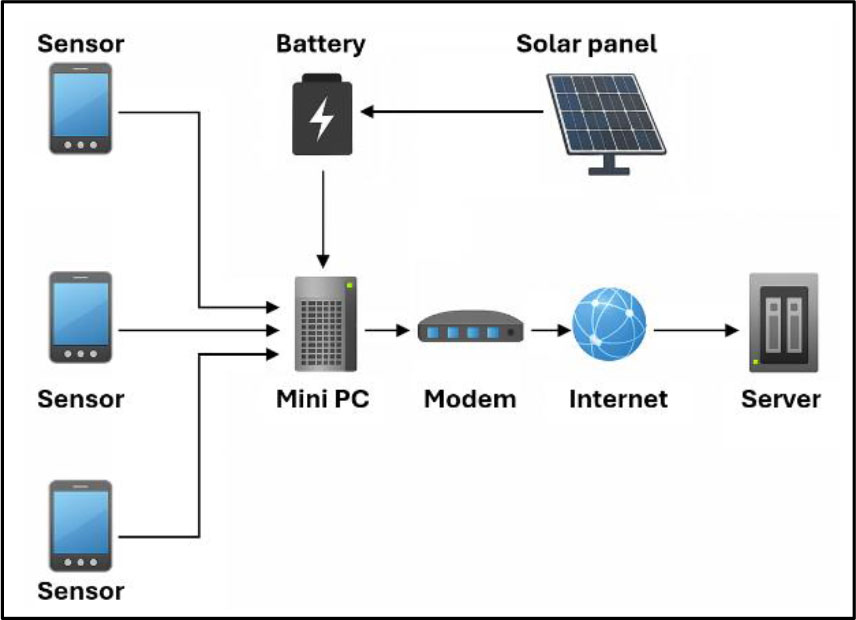
Figure 12:
Flowchart of the acquisition system

Figure 13:
Simplified finite element model diagram
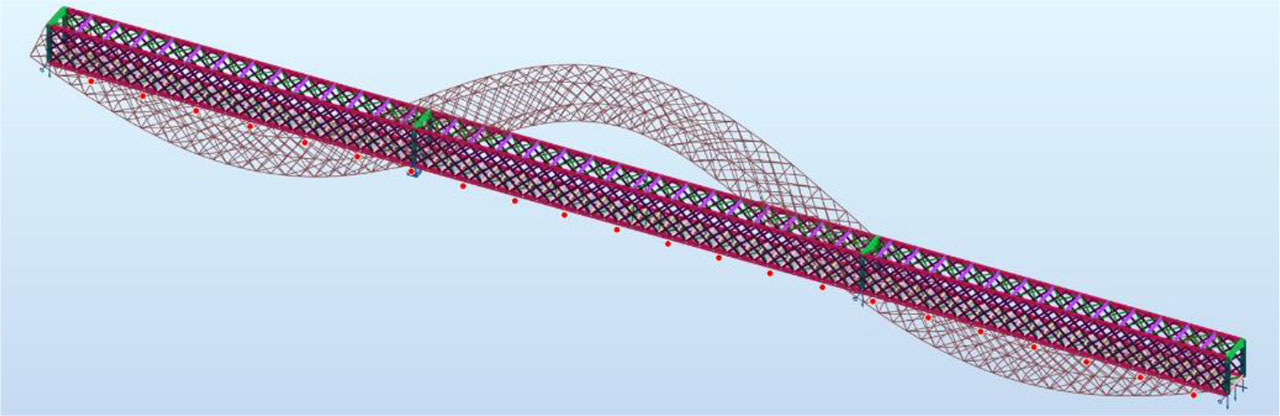
Figure 14:
View of the first bending mode and sensor positions along the span
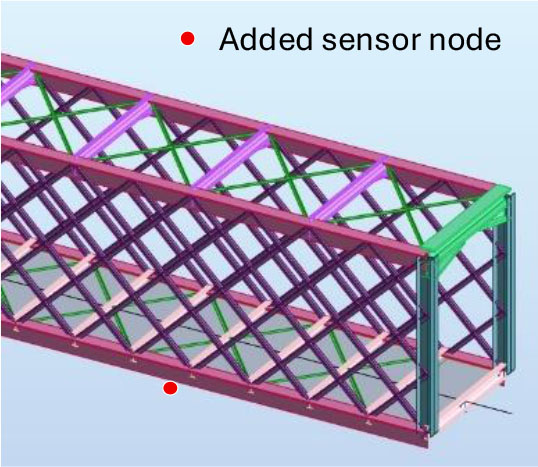
Figure 15:
Zoom on the model
Table 1:
First two natural frequencies with detailed FEM (Robot), Octave FEM and OMA values, for states S0 , S1 and S2
| State Sk | Natural frequency 1 [Hz] | Natural frequency 2 [Hz] | ||||
|---|---|---|---|---|---|---|
| (Robot) | (Octave) | (OMA) | (Robot) | (Octave) | (OMA) | |
| S0 | 2.50 | 2.49 | - | 3.51 | 3.74 | - |
| S1 | - | 2.44 | 2.45 | - | 3.69 | 3.46 |
| S2 | - | 2.46 | 2.49 | - | 3.72 | 3.71 |
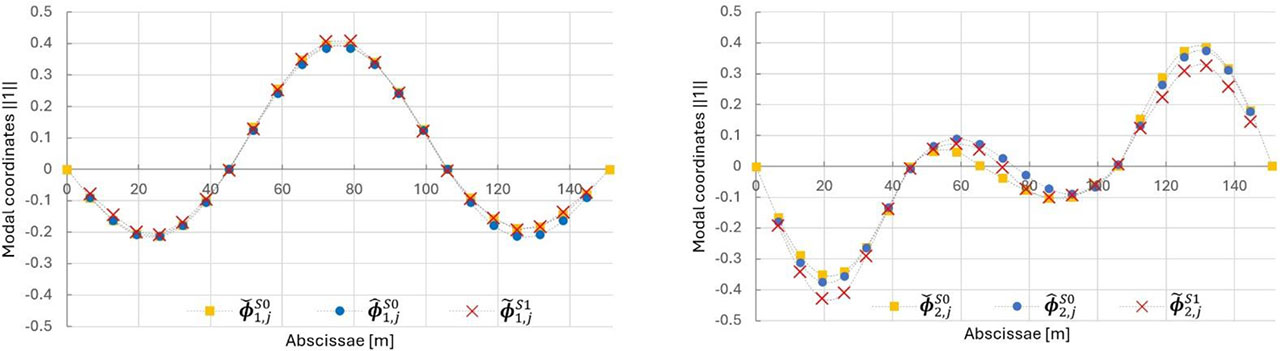
Figure 16:
a) First bending modes, b) second bending modes from Octave , Robot and OMA
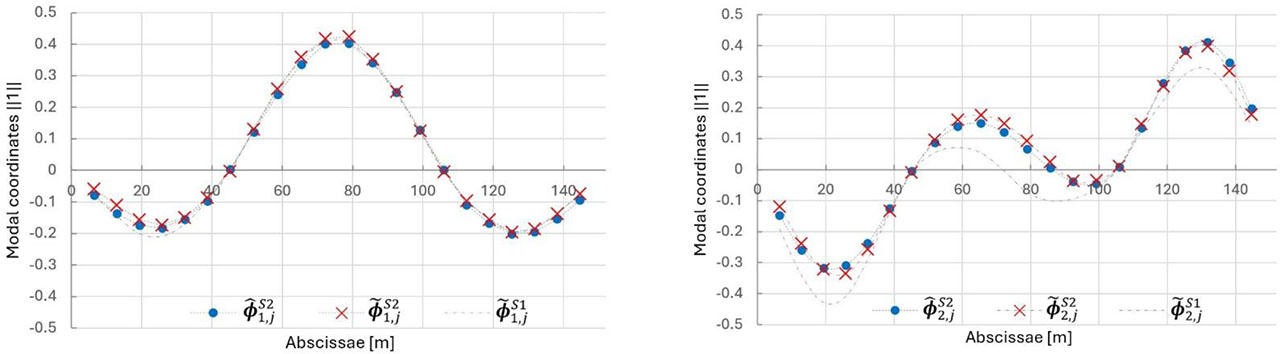
Figure 17:
a) First bending modes, b) second bending modes from Octave and OMA ,
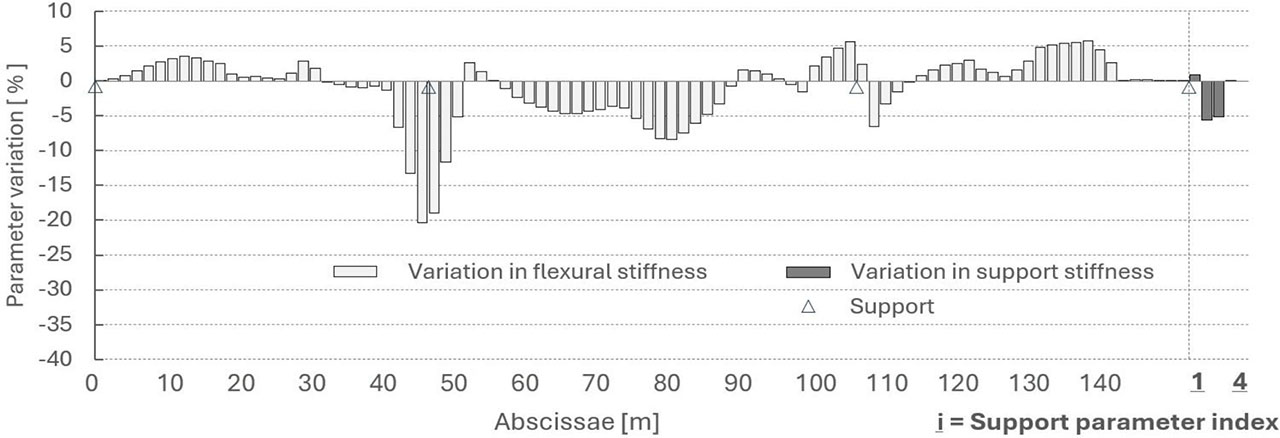
Figure 18:
Parameters variation during the model updating from KS0 to KS1
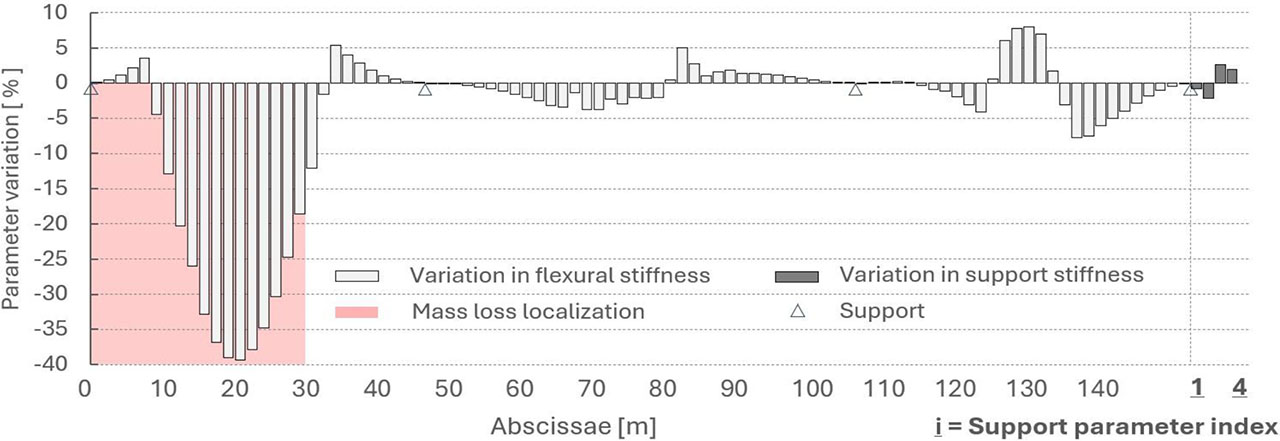
Figure 19:
Parameters variation during the model updating from MS1 to MS2