

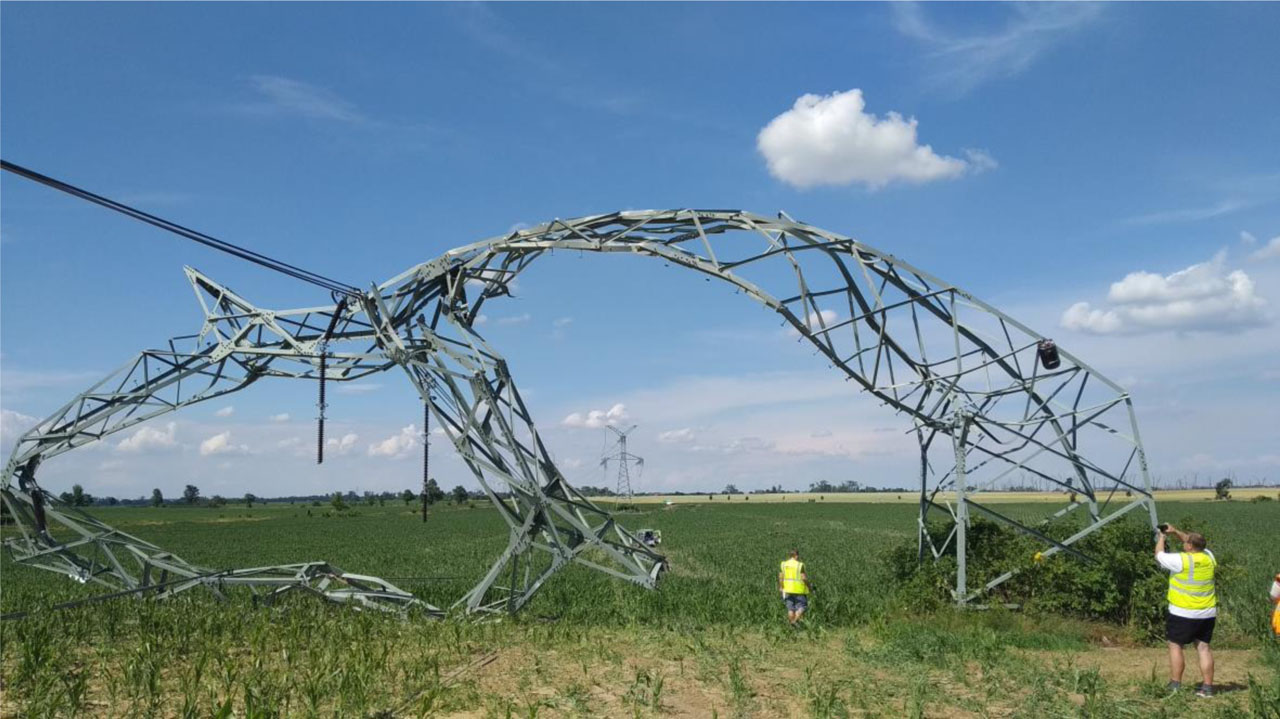
Figure 1:
Collapsed Delta tower after the tornado in South Moravia
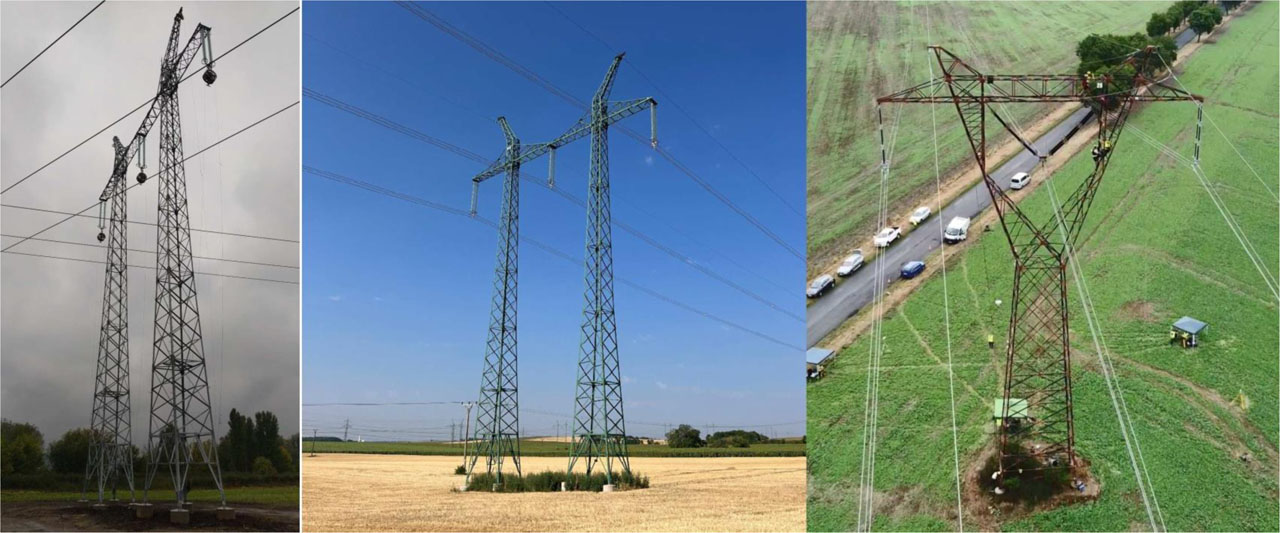
Figure 2:
Measured structures from left to right: portal no. 906 (V423), portal no. 912 (V423), cat-type no. 28 (V470)
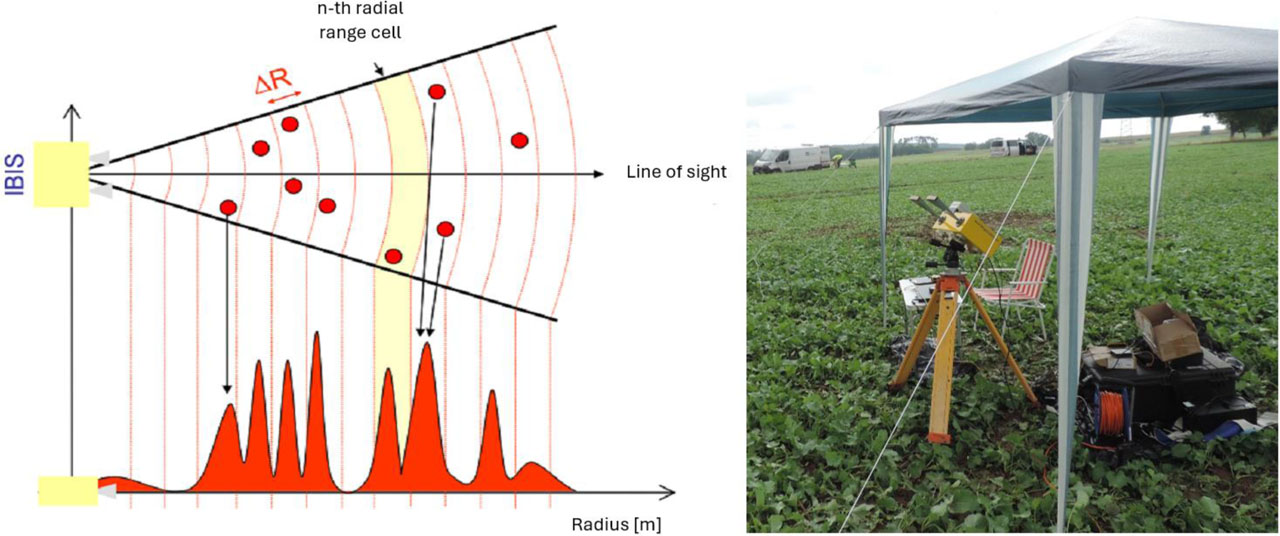
Figure 3:
Radial Reflectivity Profile (left) and IDS Radar IBIS – FS Plus (right)
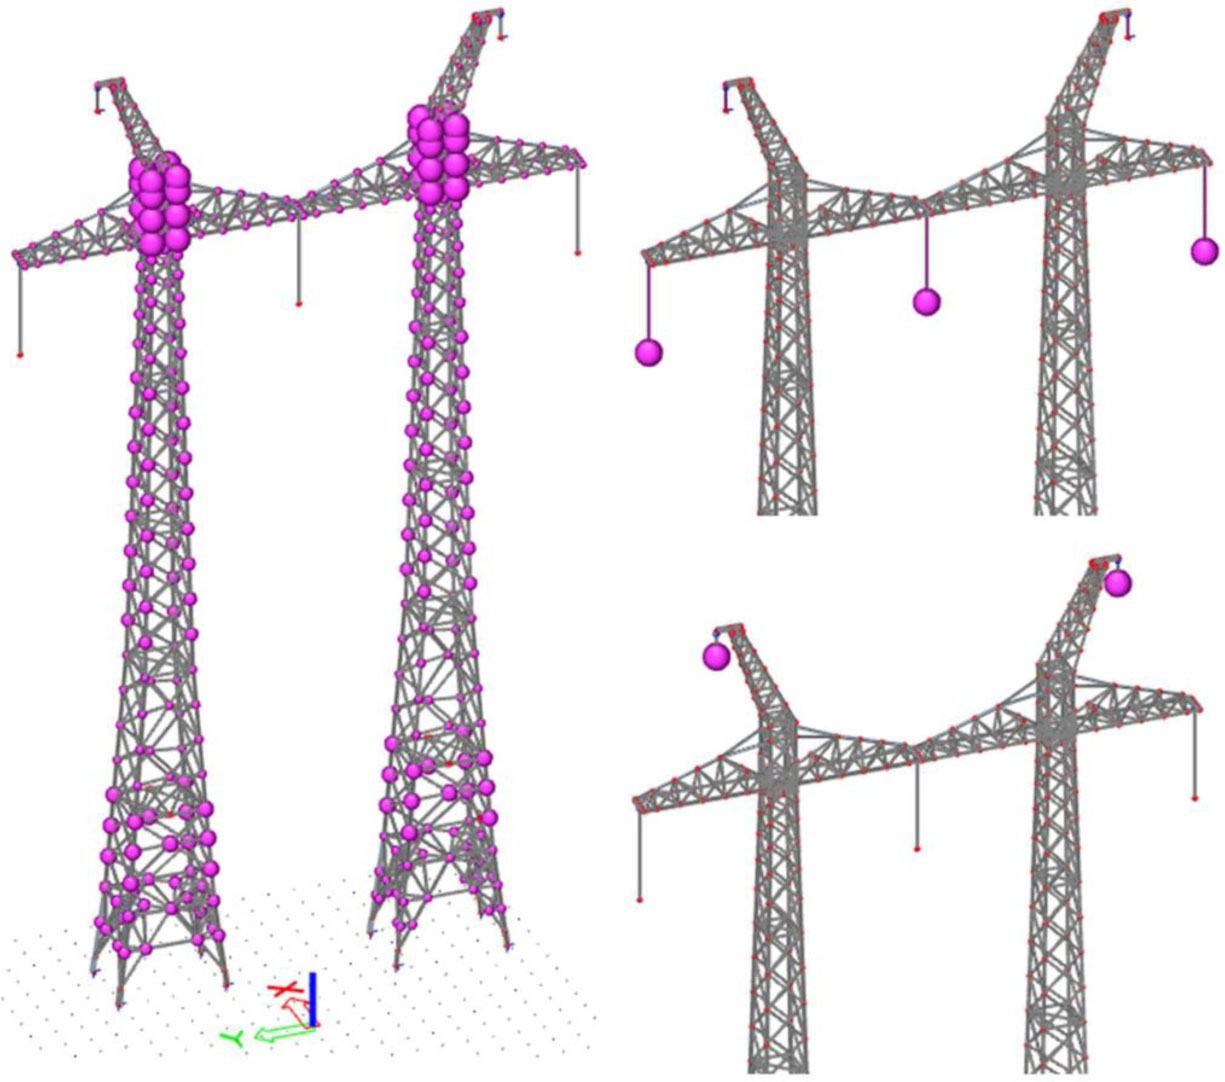
Figure 4:
Addition of masses to the numerical model – masses at joints, phase conductors, grounding cables
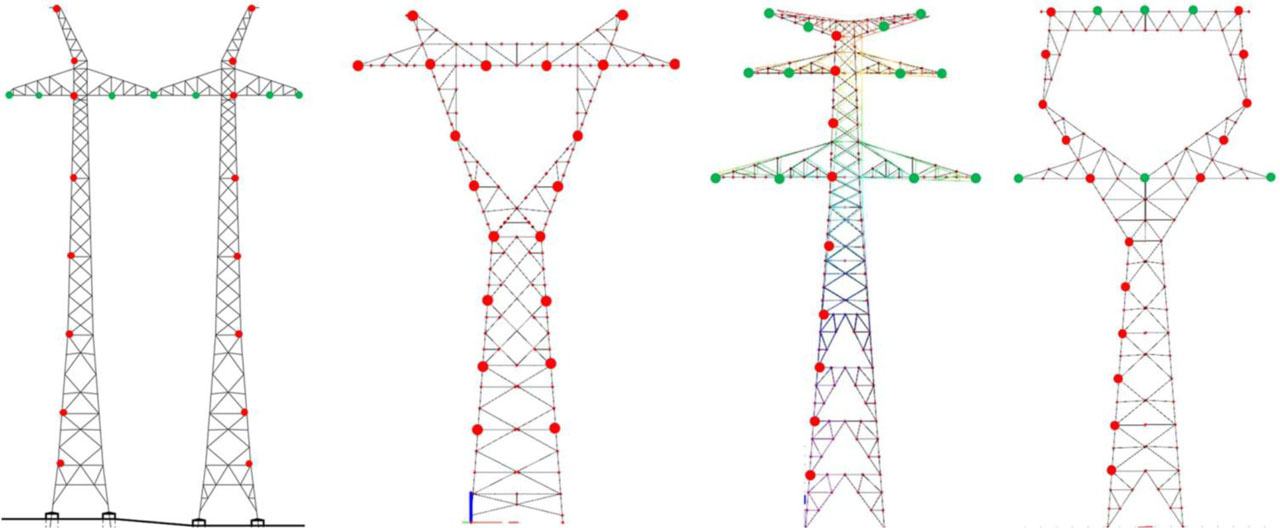
Figure 5:
FEM Models of towers with evaluation points, from left – portal, cat, dunaj, and delta
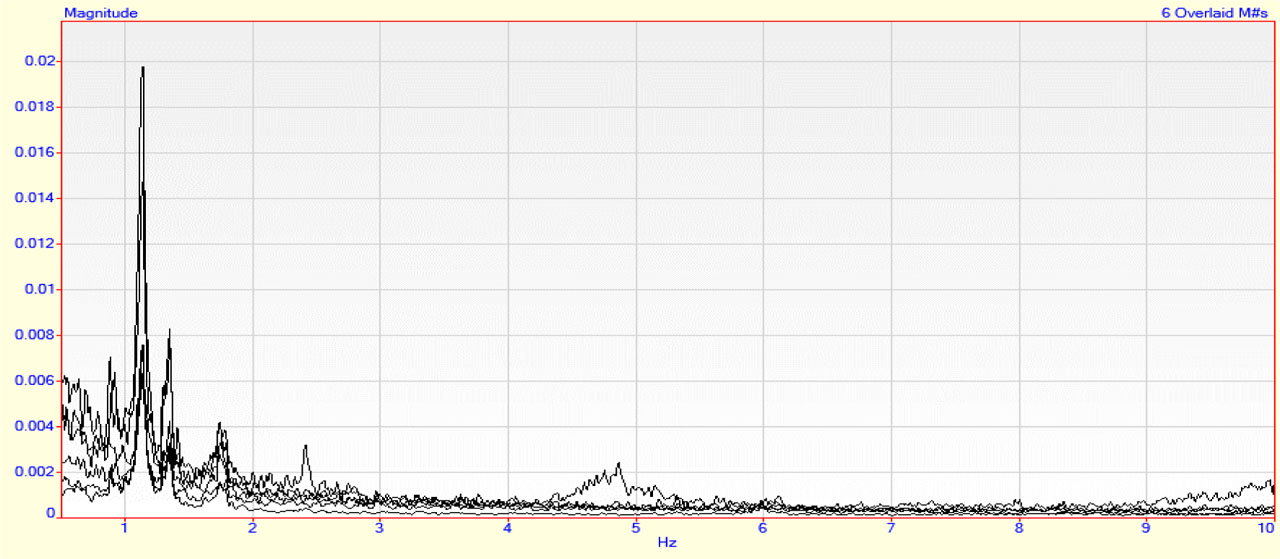
Figure 6:
Frequency spectra of tower displacements measured using radar interferometry
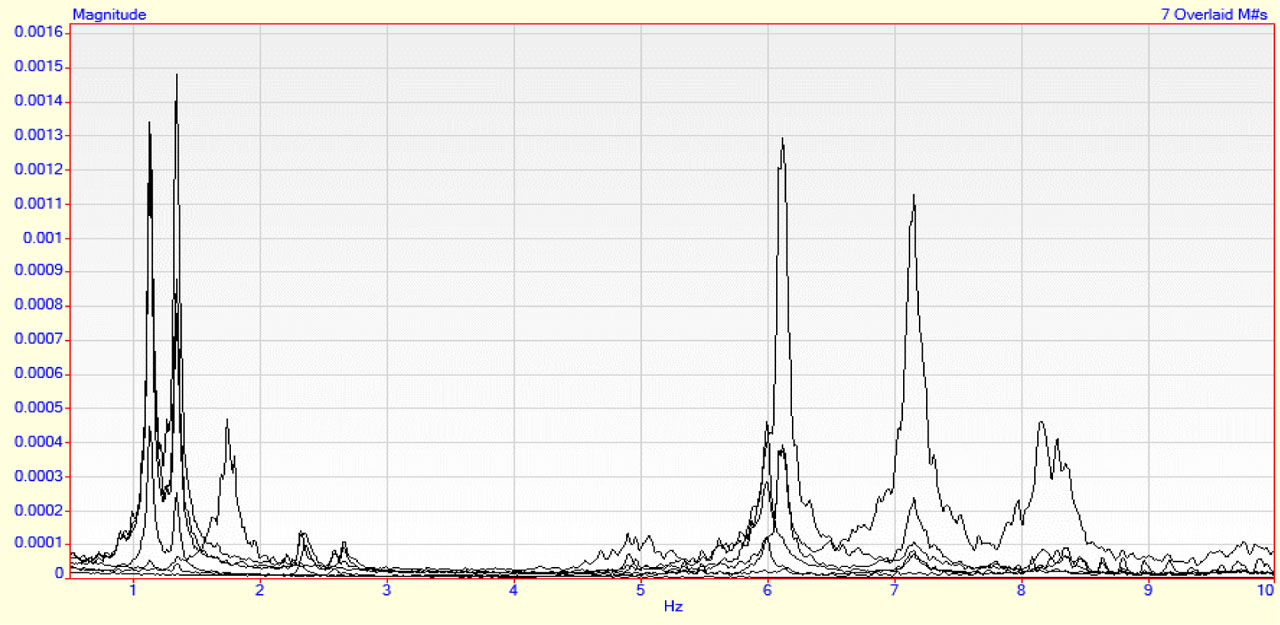
Figure 7:
Frequency spectra of tower accelerations measured using piezoelectric accelerometers
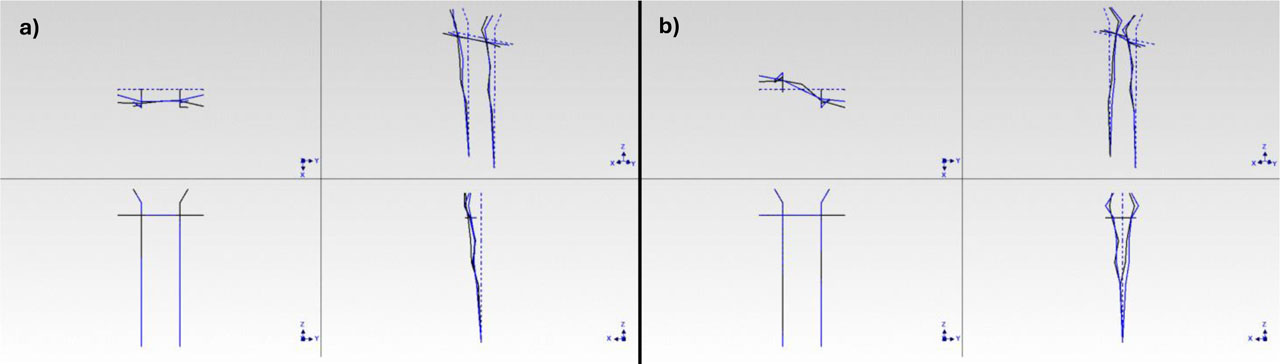
Figure 8:
Comparison of results obtained from radar interferometry (in blue) and from acceleration sensors (in black); a) 1st mode shape of the tower – X-direction only; b) 3rd mode shape of the tower – X-direction only
Table 1:
Comparison of calculated and measured natural frequencies of tower portal No. 906 V423
| Natural frequency - calculated | Natural frequency - measured | Deviation of natural frequencies | Description of the corresponding mode shape | ||||
|---|---|---|---|---|---|---|---|
| No. (j) | f(j) [Hz] | No. (j) | f(j) [Hz] | Expanded uncertainty Uk=2 [Hz] | Δ(j)[%] | ||
| 1 | 1.14 | 1 | 1.14 | ± 0.04 | −0.4 | ± 3.5 | 1st mode of horizontal bending vibration - direction X |
| 2 | 1.43 | 2 | 1.34 | ± 0.04 | 6.1 | ± 2.8 | 1st mode of torsional vibration |
| 3 | 1.78 | 3 | 1.74 | ± 0.04 | 2.3 | ± 2.2 | 1st mode of horizontal bending vibration - direction Y |
| 4 | 2.7 | 4 | 4.97 | ± 0.04 | −84.2 | ± 1.5 | 2nd mode of horizontal bending vibration - direction Y |
| 8 | 6.48 | 5 | 6.04 | ± 0.04 | 6.8 | ± 0.6 | 2nd mode of horizontal bending vibration - direction X |
| 9 | 7.88 | 6 | 7.17 | ± 0.04 | 9.0 | ± 0.6 | mode of hor. bending vibration of the left tower - direction X |
| 7 | 6.36 | 7 | 7.28 | ± 0.04 | −14.4 | ± 0.5 | mode of hor. bending vibration of the tower arms - direction X |
| 10 | 9.51 | 8 | 7.98 | ± 0.04 | 16.1 | ± 0.4 | mode of horizontal bending vibration - direction Y |
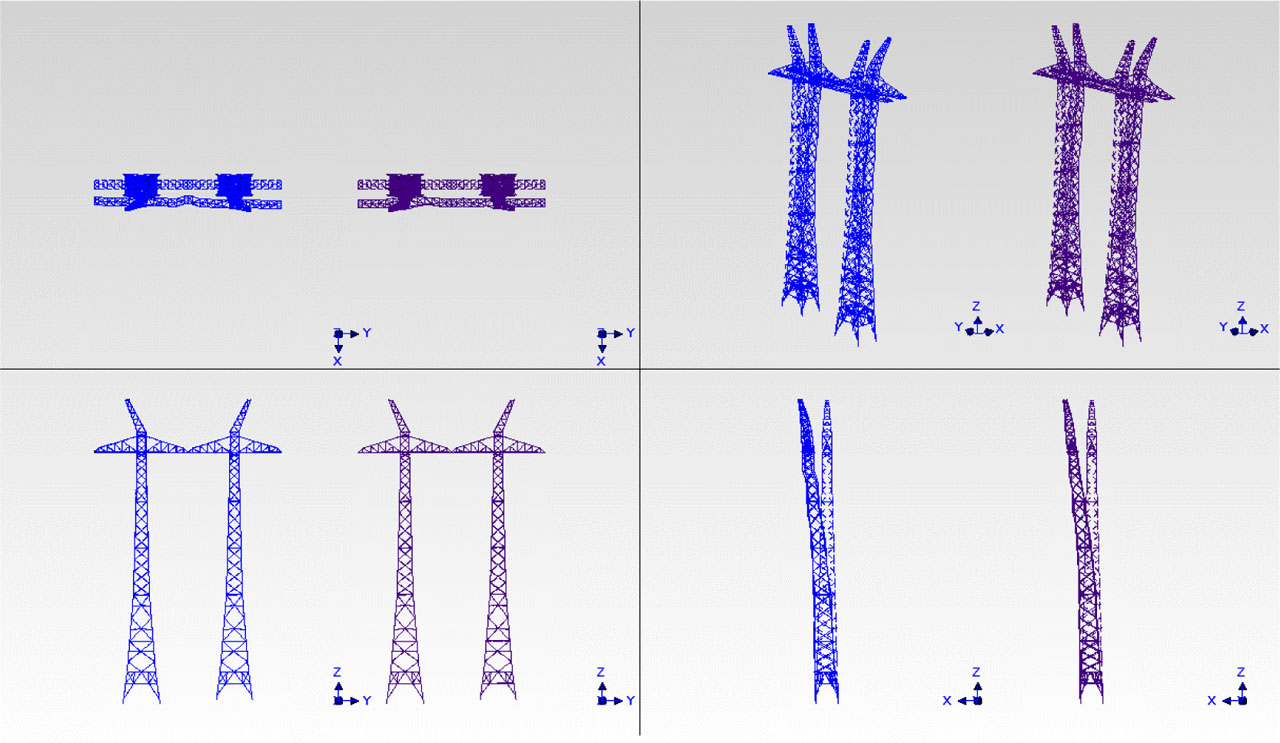
Figure 9:
Comparison of measured (blue) and calculated (FEM, purple) mode shapes of the tower, f(1) = 1.14 Hz and f(1) = 1.14 Hz."
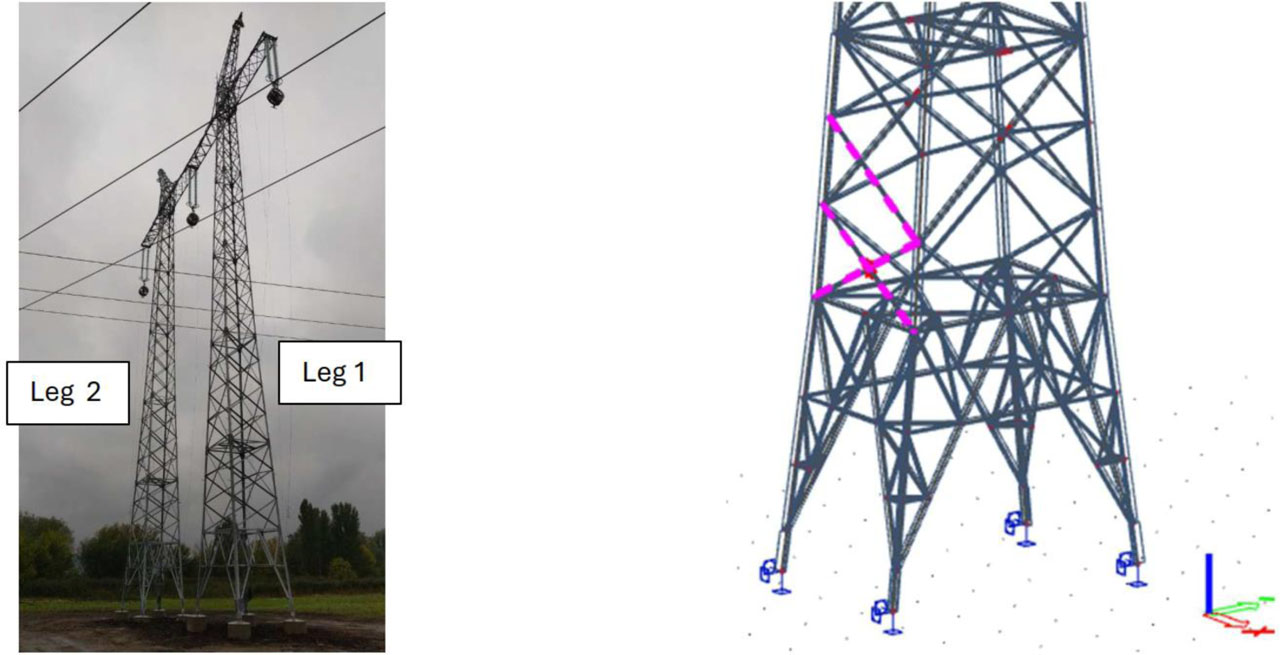
Figure 10:
Tower No. 906 on line V423 – Brno-Chrlice, damage on the right
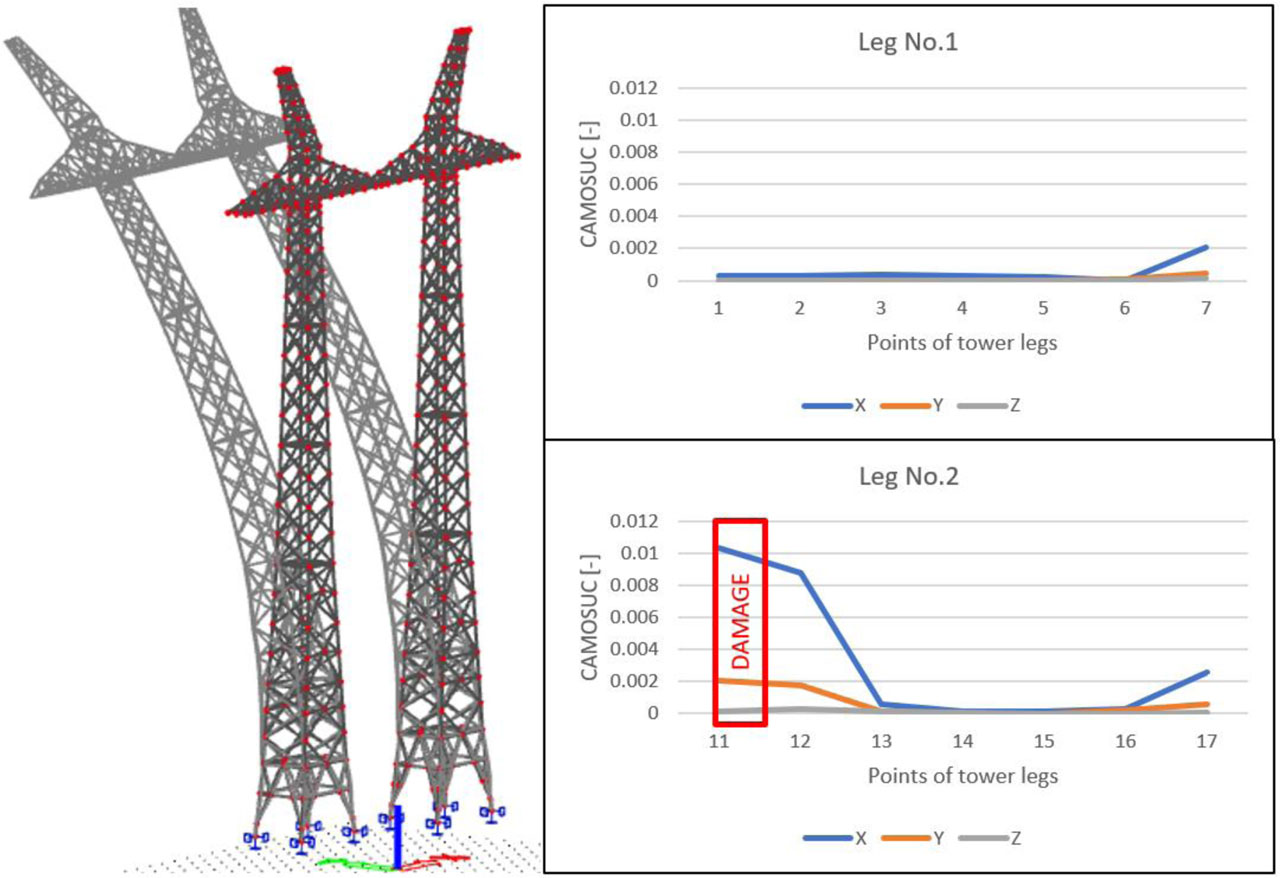
Figure 11:
1st mode shape and CAMOSUC results
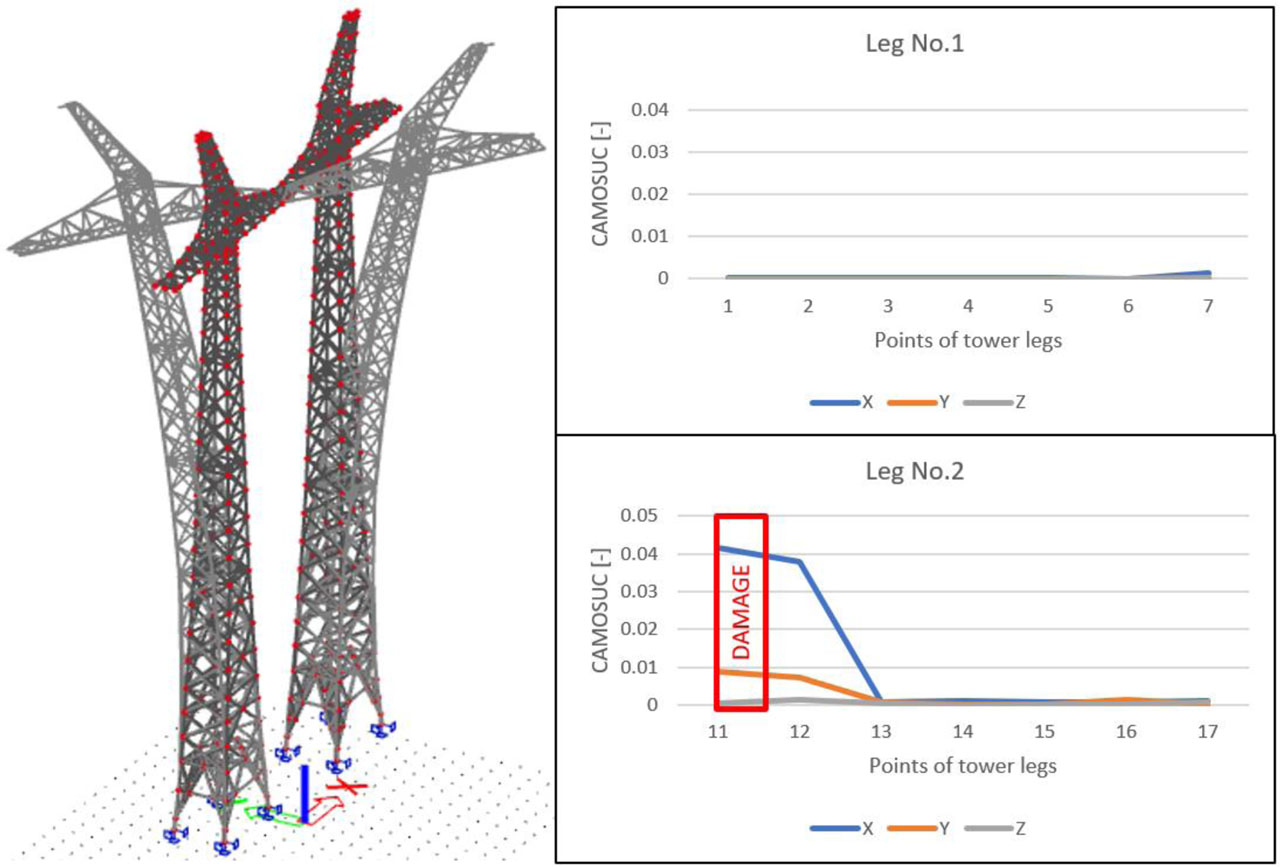
Figure 12:
2nd mode shape and CAMOSUC results
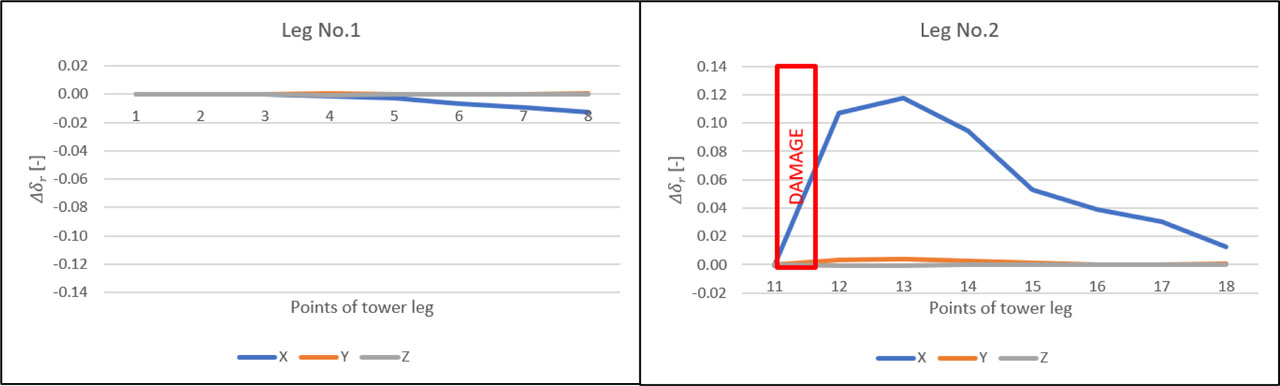
Figure 13:
Change in the diagonal elements of the modal flexibility
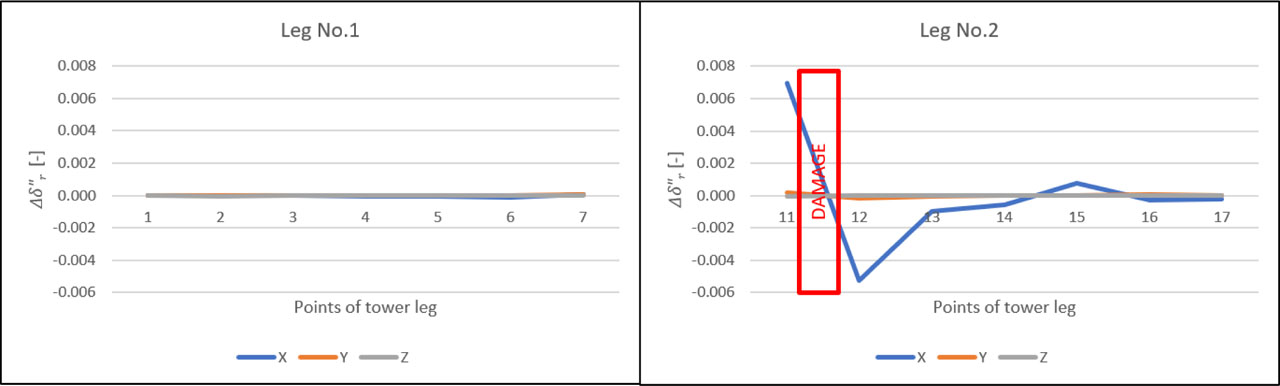
Figure 14:
Change in the second derivative of the diagonal elements of the modal flexibility matrix