

1. Introduction
The transmission system is a key component of the power grid, whose reliability is essential for the safe and efficient operation of energy infrastructure. Given the scale of the network and the potential consequences of failures, it is necessary to develop methods for early detection of structural damage, particularly in steel lattice towers. The risks of sudden damage are significant, as demonstrated by the transmission line failure in south Moravia in June 2021 (Figure 1).
The aim of the research is to develop a methodology for detecting damage in steel transmission towers based on measurements of their dynamic characteristics and dynamic analysis. The study is based on field measurements carried out on selected towers of the transmission system using conventional methods (accelerometers) and ground-based radar interferometry, and their comparison with results from validated FEM models. Based on these data, the research further focuses on damage detection methods that would enable the identification of emerging faults before structural failure occurs. Promising approaches include monitoring changes in the modal parameters of the structure.
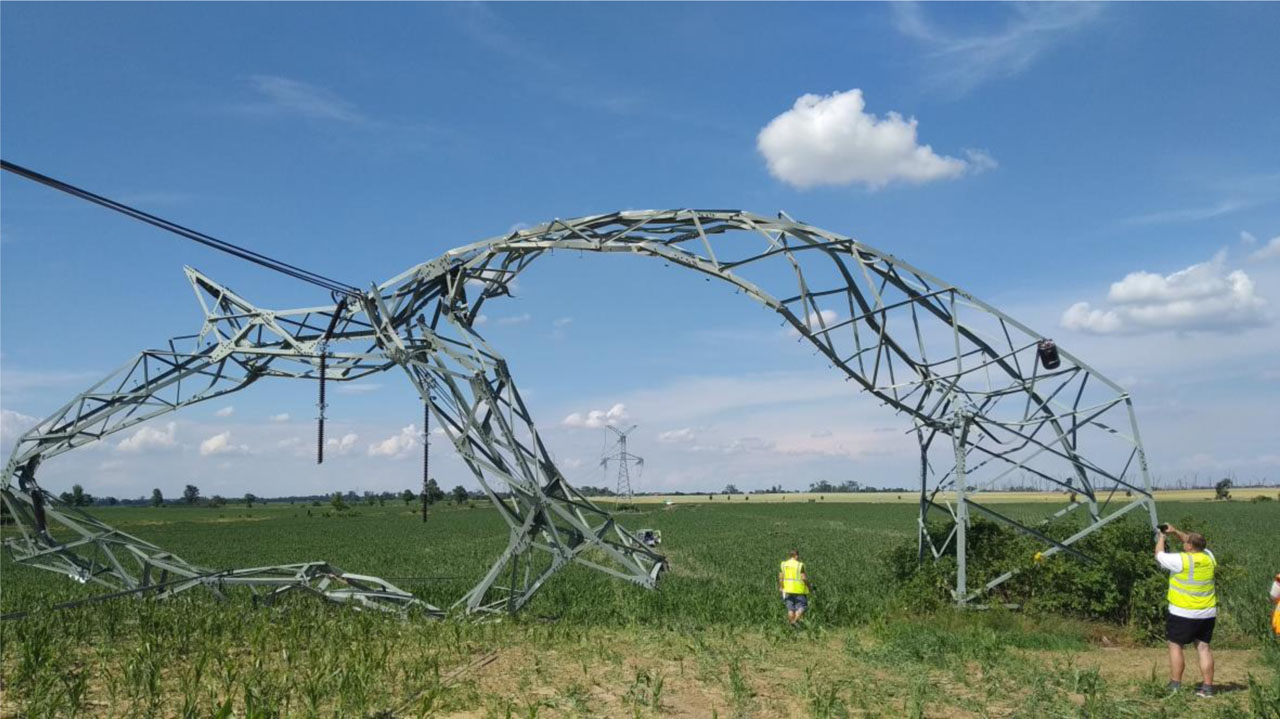
Figure 1:
Collapsed Delta tower after the tornado in South Moravia
The hypothesis assumes that changes in the dynamic parameters of a structure—particularly its natural frequencies and mode shapes—can indicate the onset of damage. According to Pirner and Pospíšil (1996), changes in natural frequencies are suitable for detecting global changes in a structure; however, for identifying smaller damage and its localization, the method must be complemented by an analysis of mode shapes or their derivatives. Messina et al. (1998) proposed the DLAC (Damage Location Assurance Criterion), which enables damage localization based on frequency changes. A drawback of this method is the need to create a database of FEM models with various damage locations and intensities, which may not cover all possible damage scenarios. Therefore, this method is not particularly suitable for the present study. More appropriate alternatives include methods such as CAMOSUC, which analyze mode shapes, and approaches based on changes in the diagonal elements of the modal flexibility matrix, which allow for damage detection. According to Pirner and Pospíšil (1996), these approaches provide more accurate information about the location and extent of damage than frequency analysis alone. Plachý and Polák (2007 and 2008) also applied damage detection and localization methods to reinforced concrete beams and slabs, concluding that the CAMOSUC function yielded better results than the MAC and COMAC functions.
2. Methodology
Monitoring methods for structures vary, but approaches based on traditional sensors often face practical limitations. Measurements are expensive, installation tends to be time-consuming, requires cabling, measurement centers, and physical access to the structure — which is particularly problematic in the case of towers and similar objects. Geodetic methods suffer from low accuracy, insufficient sampling frequency, and are time-intensive. Moschas and Stiros (2014) used Robotic Total Station (RTS) to measure transmission tower deflections with high accuracy, although the method is limited to single-point measurements requiring a physical reflector. That’s why more efficient methods need to be explored. In this context, radar interferometry (RI) appears to be a viable method, enabling non-contact, precise, and high-frequency measurements of structures.
The research methodology is based on the application of dynamic methods for monitoring the behavior of tower structures. Based on an analysis of transmission system structures and the operator’s ability to provide access for measurements, three tower structures were selected for experimental measurement of dynamic properties.
Both the conventional method using accelerometers and non-contact radar interferometry were used during the measurements. The collected data were subsequently evaluated using modal analysis software, which enabled the identification of natural frequencies and mode shapes. These results were then compared with numerical models, which were validated using experimental data. Simulated damage was introduced into the validated models to assess its impact on changes in modal parameters, serving as a basis for identifying potential structural faults.
2.1. Selection of structures for measurement
Following an analysis of transmission system structures, a request was made to obtain permission to conduct measurements primarily on portal and cat-type structures. The portal structure is distinctive due to its design — featuring two shafts — and its frequency of occurrence. Portal-type towers are the most common type of structure in the transmission system, with 7,145 units, representing 50.2% of the entire system. The cat-type tower was selected due to numerous historical failures associated with this design.
Initially, two measurements were conducted on tower number 906 on line V423 near the Brno-Chrlice district. The first measurement was carried out on a fully equipped tower without conductors, guy wires, or grounding cables. The second measurement took place after the installation of all conductors, guy wires, and grounding cables. Measurements were performed using acceleration sensors and a single interferometric radar.
In 2022, three measurements were conducted on another tower — number 912 — on line V423 near Chrlice. As in previous cases, acceleration sensors were used, but this time two interferometric radars were employed. Both towers on line V423 are of the portal-type support structure.
The third measurement location was near Štětí, on line V470, where measurements were taken on tower number 28, a cat-type support structure. The measurement procedure was the same as for tower number 912 on line V423.
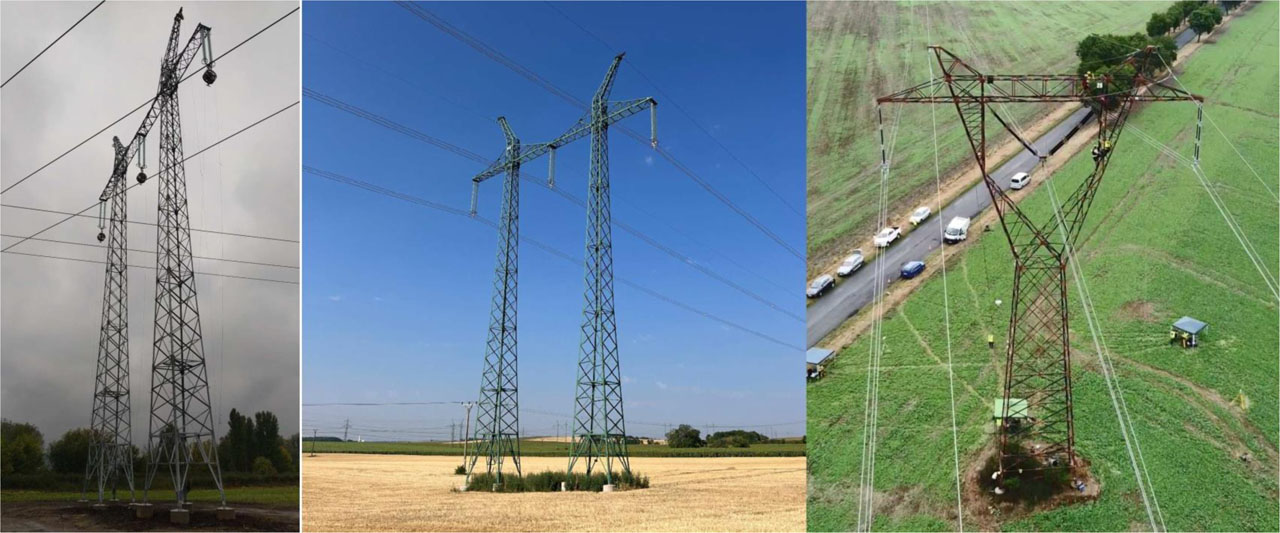
Figure 2:
Measured structures from left to right: portal no. 906 (V423), portal no. 912 (V423), cat-type no. 28 (V470)
2.2. Measurement of dynamic response
Conventional method – accelerometers
The dynamic response of the tower structure was measured to identify its natural frequencies and mode shapes. The importance of proper excitation and sensor placement for accurate modal identification was also demonstrated in laboratory tests on a steel truss structure (Kortiš et al., 2016). A comparison between experimentally identified modal parameters and those obtained from a numerical model of a cable-stayed footbridge was carried out by Kortiš et al. (2017), confirming the suitability of operational modal analysis for large structures.
The measurements were carried out using seismic piezoelectric acceleration sensors, type 8344 from Brüel & Kjær. These sensors were attached directly to the tower structure using neodymium magnets. Data were collected using the SIRIUS 6ACC – 2ACC+ (serial no. DB18002762) and SIRIUS 8ACC (serial no. DB18002824) – eight-channel electronic measurement units from DEWESoft. The acquired data were subsequently analyzed using ME'scopeVES software, which enables modal analysis and extraction of natural frequencies and mode shapes. The measurement results were used to validate numerical models and to identify the natural frequencies and vibration modes of the structures.
Ground-based radar interferometry
Ground-based radar interferometry (GB-RAR) is a non-contact method for measuring the dynamic response of structures, enabling the monitoring of their deformations with high precision (up to 0.1 mm) and a high sampling frequency of up to 200 Hz. In this research, the method was applied to selected transmission system towers, specifically on line V423 near Chrlice (portal type) and V470 near Štětí (cat type). The radar utilizes Stepped Frequency Continuous Wave (SFCW) technology and Differential Interferometry.
The stepped frequency continuous wave (SFCW) technology is used to determine the distance between the radar and the target object. Microwave frequencies are transmitted in very short, high-power pulses. The distance to detected objects is determined based on the time correlation between the transmitted and received signals. Using this technology, the radar generates a one-dimensional image called a radial reflectivity profile (Figure 3). The radar can distinguish detected objects only in one dimension — in the direction of its line of sight. If multiple objects are located within the same radial range (i.e., at similar distances from the radar), they cannot be distinguished from one another, and the displacements measured on individual objects are averaged
Differential interferometry provides data on object displacements by comparing phase information obtained at different time intervals from waves reflected off the objects. The instrument can evaluate displacement for each radial range cell. The quality of the evaluated displacement is proportional to the amount of reflected signal. Signal strength (quality) can be enhanced by using corner reflectors attached to the measured points. All displacements are measured in the direction of the radar’s line of sight. If the line of sight is not precisely aligned with the expected direction of displacement, the actual displacements must be calculated accordingly.
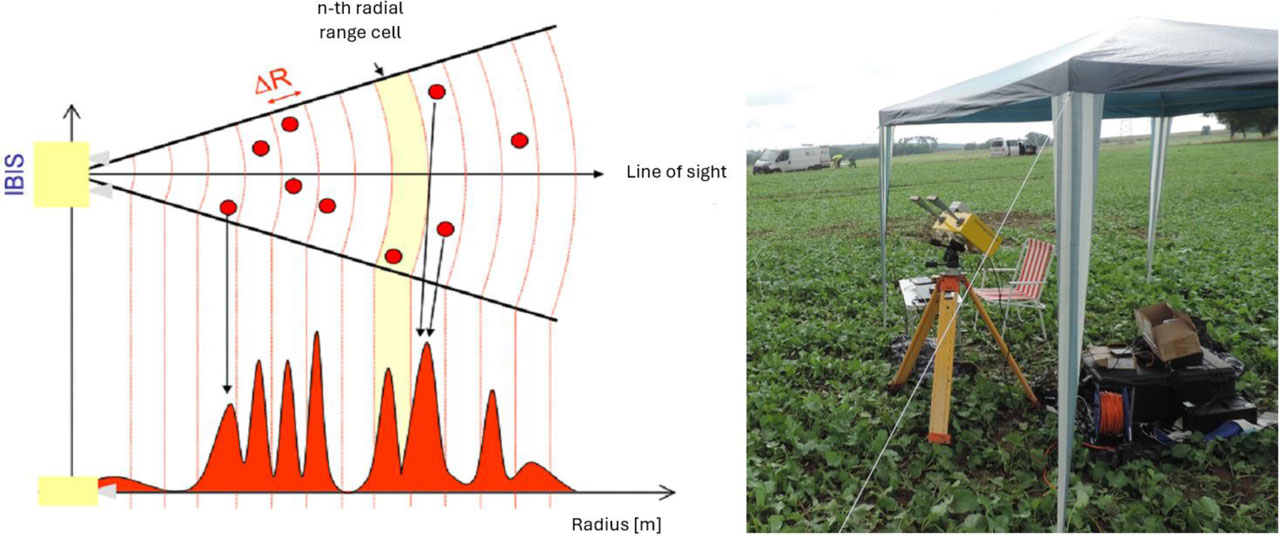
Figure 3:
Radial Reflectivity Profile (left) and IDS Radar IBIS – FS Plus (right)
Measurements were carried out using simultaneous data acquisition from two interferometric radars, positioned approximately perpendicular to each other. The radars were placed at various distances and orientations relative to the towers to capture their response along multiple axes. The radar units recorded the structural response during natural excitation by wind and during movement of a climber on the structure. This method enables the acquisition of dynamic characteristics without physical contact with the structure. The collected data were subsequently processed and evaluated in collaboration with the Institute of Information Theory and Automation of the Czech Academy of Sciences (ÚTIA AV ČR).
2.3. Numerical models and validation
Validation of the numerical model is a key step in verifying its ability to realistically simulate the behavior of the actual structure. A validation approach of FE model was presented by Cheng et al. (2018). Within the project, validation was carried out by comparing the results of numerical calculations with data obtained from dynamic load testing. Models of the portal and cat-type towers were validated, as dynamic property measurements were also performed on these real structures. Finite element models were additionally created for delta and dunaj-type towers. The numerical models of the towers were developed using SCIA Engineer and MIDAS Civil software. The models included all structural members and were supplemented with mass elements representing missing components — such as gusset plates, bolts, conductors, etc. (Figure 4). Validation was performed iteratively, with the model being gradually adjusted to minimize the difference between measured and calculated frequencies and mode shapes (Table 1, Figure 9). The validated numerical model serves as a basis for damage simulation. Its accuracy was verified by comparison with experimental data and is sufficient for predicting the dynamic behavior of the tower under operational conditions.
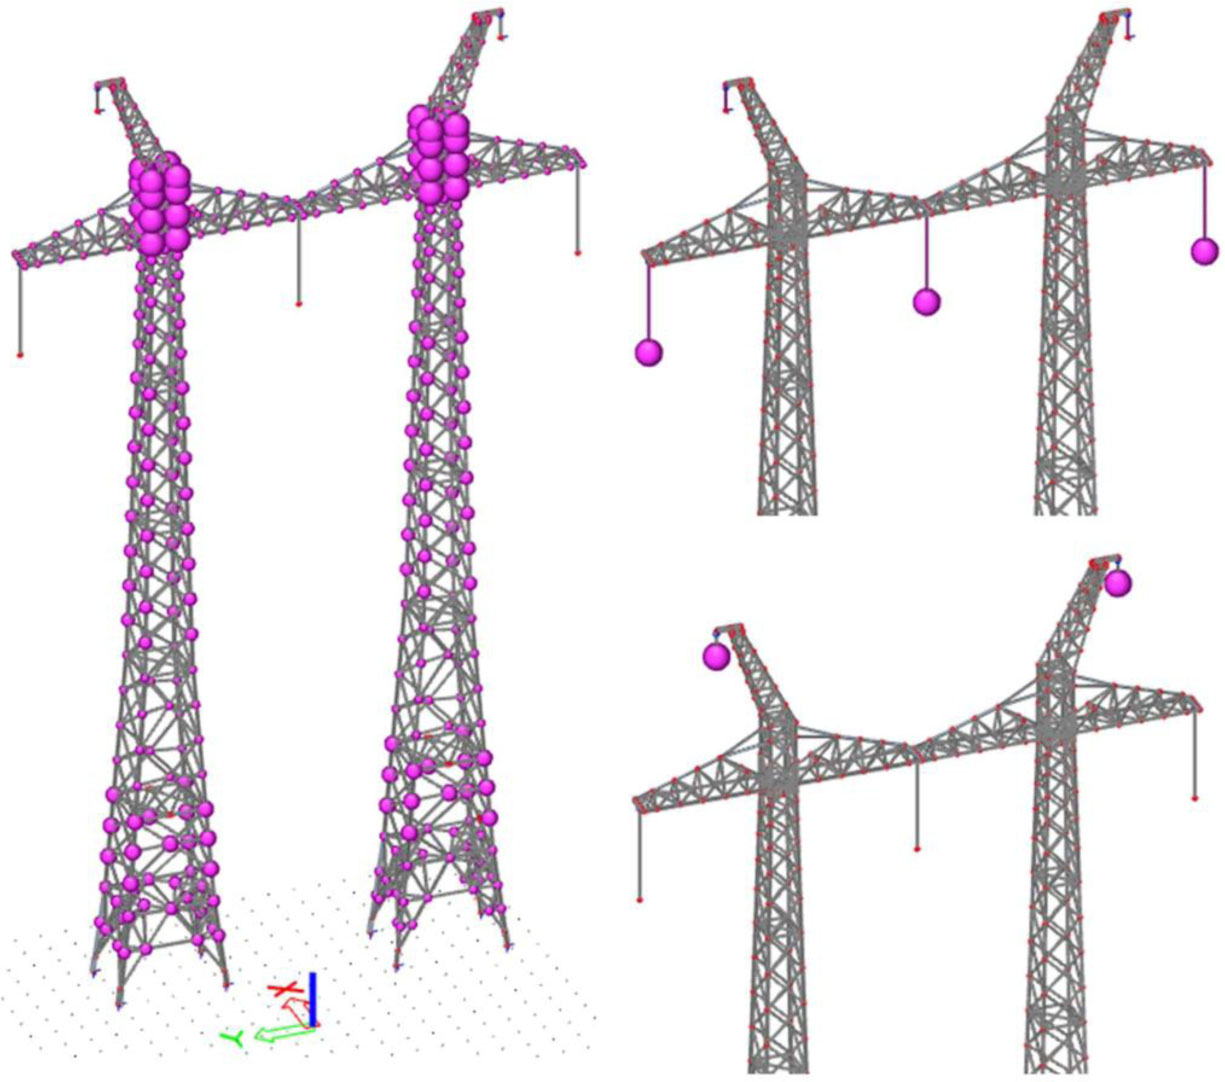
Figure 4:
Addition of masses to the numerical model – masses at joints, phase conductors, grounding cables
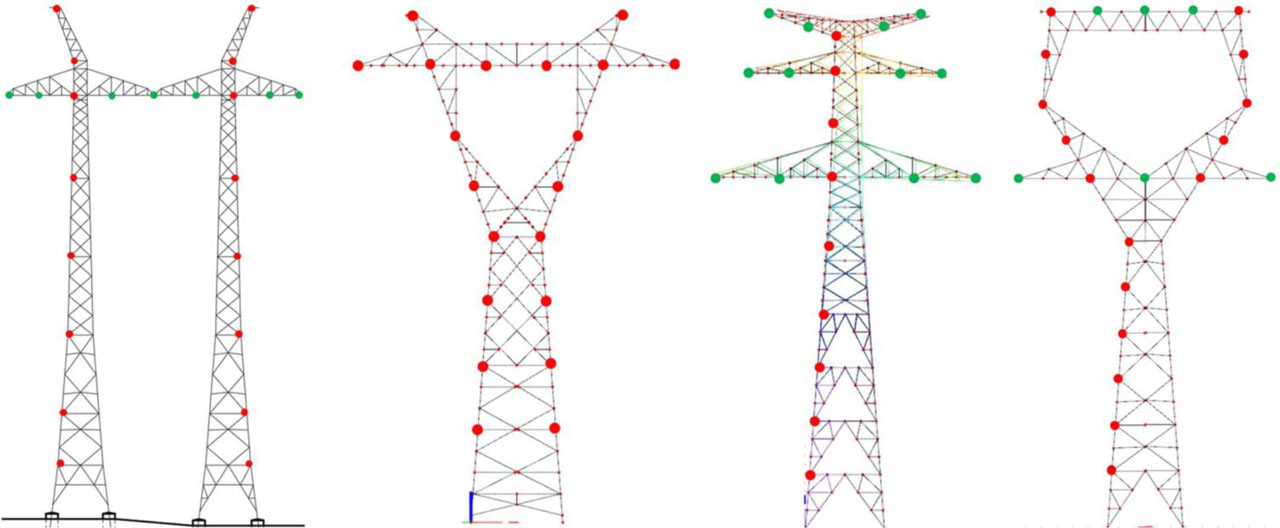
Figure 5:
FEM Models of towers with evaluation points, from left – portal, cat, dunaj, and delta
2.4. Damage Detection Methods
Methods Based on Changes in Mode Shape Curvature
Derivatives of vibration mode shapes, such as curvature, which is directly proportional to the second derivative of the mode shape with respect to the spatial variable, are commonly used for damage detection and localization. One of the most well-known approaches is the change of mode surface curvature, denoted as CAMOSUC(j),x, which is determined using the central difference method according to the following equation:
where:r(j),U,x –the coordinate of the j-th mode shape at the x-th measured point of the structure in the undamaged state U,
r(j),D,x – the coordinate of the j-th mode shape at the x-th measured point of the structure in the damaged state D,
h – the dimension of the grid of monitored points in the direction in which the change in curvature of the mode shape is evaluated.
The fundamental idea of this approach is that local damage to the structure causes a reduction in stiffness at that location, which in turn leads to an increase in the curvature of the mode shapes near the damaged area. In addition to the above-mentioned criterion, other criteria based on derivatives of the mode shapes are also employed.
Methods Based on Changes in the Modal Flexibility Matrix
The modal flexibility matrix [δ] has also been used for damage detection and localization. From the measured mode shapes normalized with respect to the mass matrix of the structure, their contribution to the structural flexibility can be directly determined. In areas where structural damage occurs, the flexibility increases and changes in the mode shapes are observed
The modal flexibility matrix is given by the following equation
where:[R(j)] – the modal matrix composed of n measured mode shapes theoretically normalized with respect to the mass matrix,
[1/ω2(j)] – is a diagonal matrix composed of the inverse squared values of the natural circular frequencies.
The mode shapes theoretically normalized with respect to the mass matrix can be obtained from the measurement results simply using the following equation:"
where:Zss(j) – residue, i.e., the ordinate of the mode shape {r(j)} at the point of excitation force S.
To assess the change in dynamic behavior between the undamaged state U and the damaged state D of the structure, the change in the diagonal elements of the matrix [δ] can be used — that is, the change in structural deflections caused by a fictitious unit force applied at point r.
where:δrr,D – the diagonal element r of the modal flexibility matrix in the damaged state,
δrr,U – the diagonal element r of the modal flexibility matrix in the undamaged state.
Another criterion used to determine the location and severity of structural damage is the change in the second derivative of the diagonal elements of the modal flexibility matrix, denoted as Dd2r, which is calculated using the central difference method.
where:Δδr,x – the change in the r-th diagonal element of the modal flexibility matrix corresponding to the measured point x,
h – the dimension of the mesh of monitored points x in the direction in which the second derivative of the diagonal elements of the modal flexibility matrix is evaluated.
3. Results
3.1. Radar interferometry
From the comparison of frequency spectra obtained from displacement measurements using radar interferometry (Figure 6) and from acceleration measurements using piezoelectric accelerometers (Figure 7) it follows that radar interferometry is particularly suitable for identifying the fundamental natural frequencies of the tower. It is immediately apparent that higher natural frequencies are not captured by radar interferometry technology.
The comparison of mode shapes measured by both methods (Figure 8) shows that primarily the fundamental mode shapes can be evaluated, and only in the direction of the radar line of sight. In the case of towers, this corresponds to the direction of the power line. Therefore, the comparison could only be performed in this direction, which notably affected the visualization of the third mode shape, where vibration predominantly occurs in the Y-direction (i.e., perpendicular to the power line direction). The test measurements indicate that corner reflectors are necessary to enhance the reflected signals at the measured points on the towers. Additionally, the influence of wind force on the measurements is evident. To obtain meaningful results, either sufficiently strong wind is required or the tower vibrations must be artificially excited.
For the above reasons, the new radar interferometry-based measurement technology is functional for identifying fundamental frequencies and mode shapes of lattice towers. For damage detection, the technology can serve as a basic indicator of whether the structure exhibits significant damage. The sensitivity of the method decreases with higher mode orders, and its detection capability is limited to more extensive damage. Localized damage to individual members has only a minor effect on stiffness, and its detection would require a very dense and economically unfeasible network of measurement points.
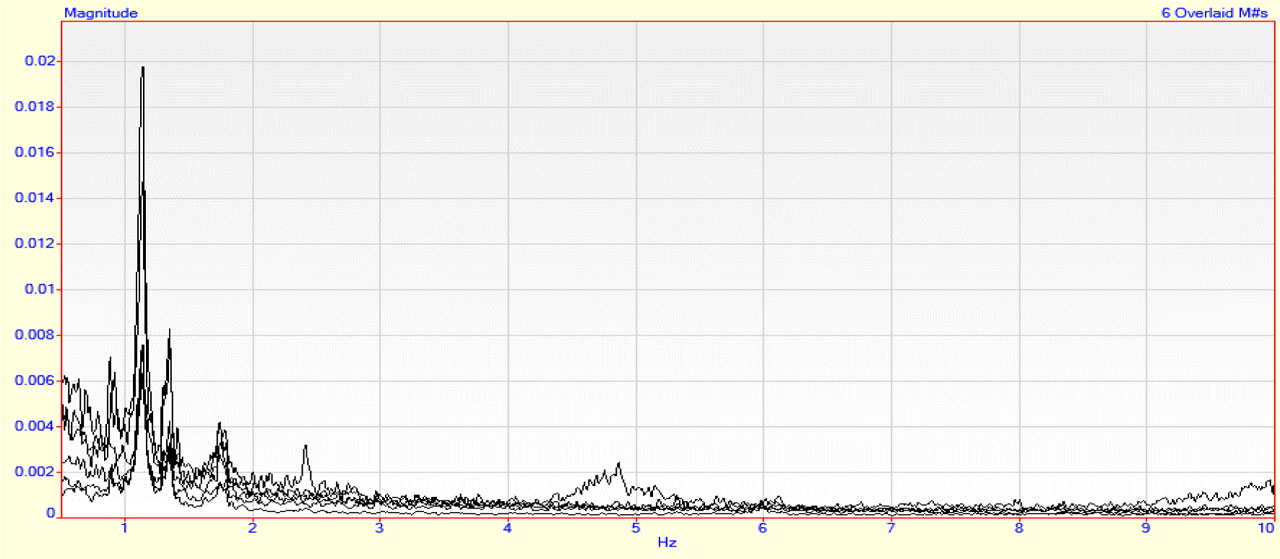
Figure 6:
Frequency spectra of tower displacements measured using radar interferometry
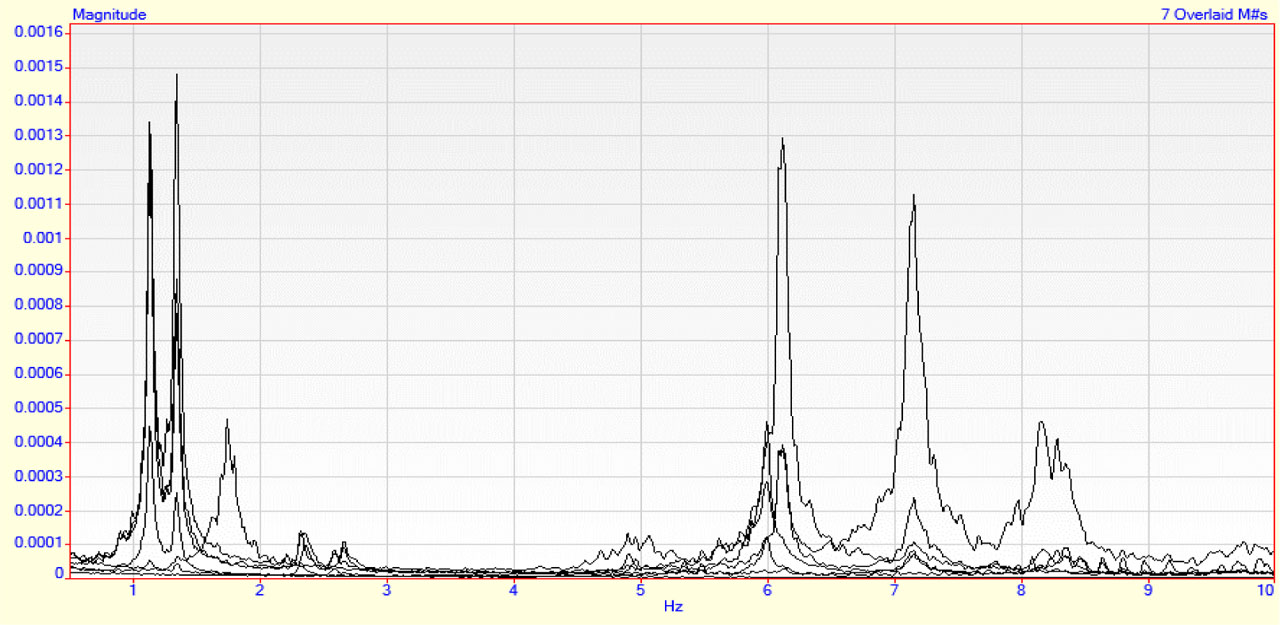
Figure 7:
Frequency spectra of tower accelerations measured using piezoelectric accelerometers
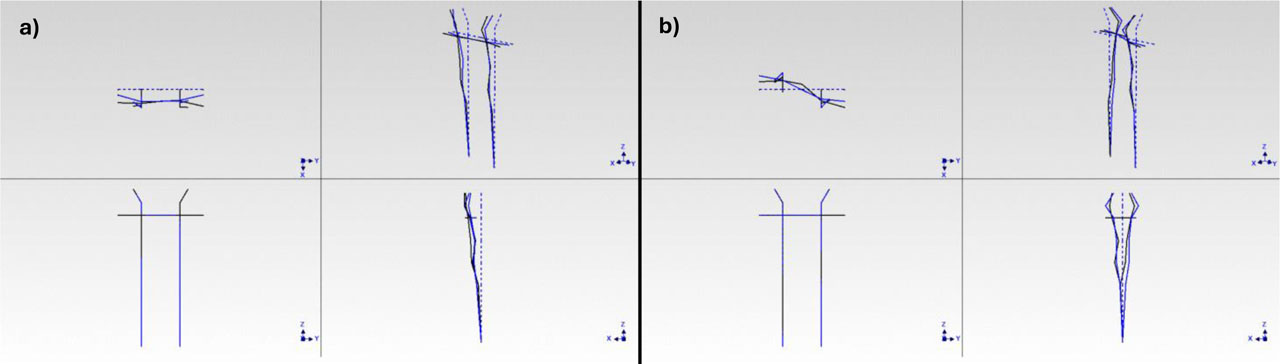
Figure 8:
Comparison of results obtained from radar interferometry (in blue) and from acceleration sensors (in black); a) 1st mode shape of the tower – X-direction only; b) 3rd mode shape of the tower – X-direction only
3.2. Numerical Models Validation and Damage Detection
A comparison between the validated model and the actual measured values is presented in Table 1, Figure 9. The validated model matches the experimental data, except for the 4th natural frequency. The reference values are the evaluated data obtained from the conventional measurement method – that is, measurements using verified accelerometers.
Table 1:
Comparison of calculated and measured natural frequencies of tower portal No. 906 V423
| Natural frequency - calculated | Natural frequency - measured | Deviation of natural frequencies | Description of the corresponding mode shape | ||||
|---|---|---|---|---|---|---|---|
| No. (j) | f(j) [Hz] | No. (j) | f(j) [Hz] | Expanded uncertainty Uk=2 [Hz] | Δ(j)[%] | ||
| 1 | 1.14 | 1 | 1.14 | ± 0.04 | −0.4 | ± 3.5 | 1st mode of horizontal bending vibration - direction X |
| 2 | 1.43 | 2 | 1.34 | ± 0.04 | 6.1 | ± 2.8 | 1st mode of torsional vibration |
| 3 | 1.78 | 3 | 1.74 | ± 0.04 | 2.3 | ± 2.2 | 1st mode of horizontal bending vibration - direction Y |
| 4 | 2.7 | 4 | 4.97 | ± 0.04 | −84.2 | ± 1.5 | 2nd mode of horizontal bending vibration - direction Y |
| 8 | 6.48 | 5 | 6.04 | ± 0.04 | 6.8 | ± 0.6 | 2nd mode of horizontal bending vibration - direction X |
| 9 | 7.88 | 6 | 7.17 | ± 0.04 | 9.0 | ± 0.6 | mode of hor. bending vibration of the left tower - direction X |
| 7 | 6.36 | 7 | 7.28 | ± 0.04 | −14.4 | ± 0.5 | mode of hor. bending vibration of the tower arms - direction X |
| 10 | 9.51 | 8 | 7.98 | ± 0.04 | 16.1 | ± 0.4 | mode of horizontal bending vibration - direction Y |
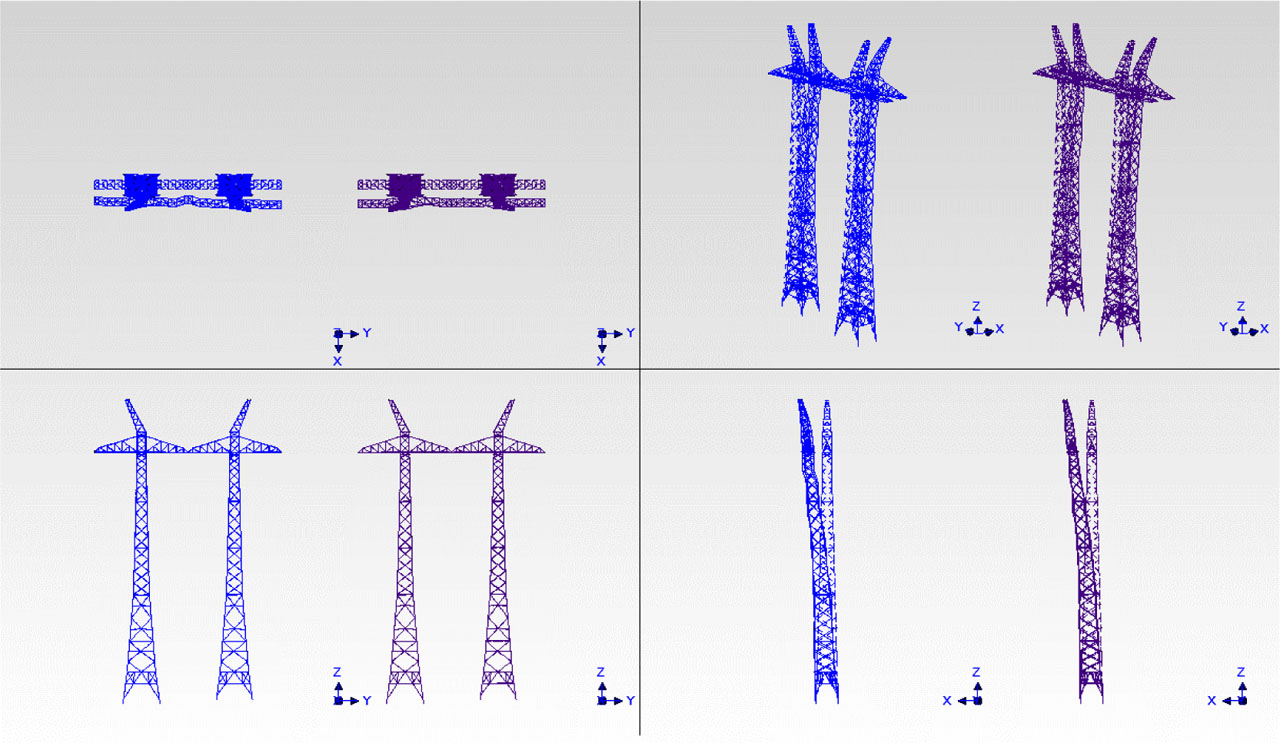
Figure 9:
Comparison of measured (blue) and calculated (FEM, purple) mode shapes of the tower, f(1) = 1.14 Hz and f(1) = 1.14 Hz."
Various types of damage were identified on the structure, and methods for damage identification and localization were subsequently applied. This section presents the results for one specific damage case on a single tower. The presented damage is shown in Figure 10 on the left – the highlighted members are missing in the model. The damage is located on the longer leg No. 2 and represents loosened or missing bolts. The calculation was performed using 16 points, with 8 points on each leg. Each leg was evaluated separately.
Figure 11 and figure 12 show the results of the CAMOSUC method for the first two mode shapes. Figure 13 and figure 14 present examples of results from methods based on changes in the diagonal elements of the modal flexibility matrix. All selected methods successfully detected the damage. The most accurate damage localization was achieved using the CAMOSUC method. For the other methods, the detected damage area was larger, indicating lower localization accuracy.
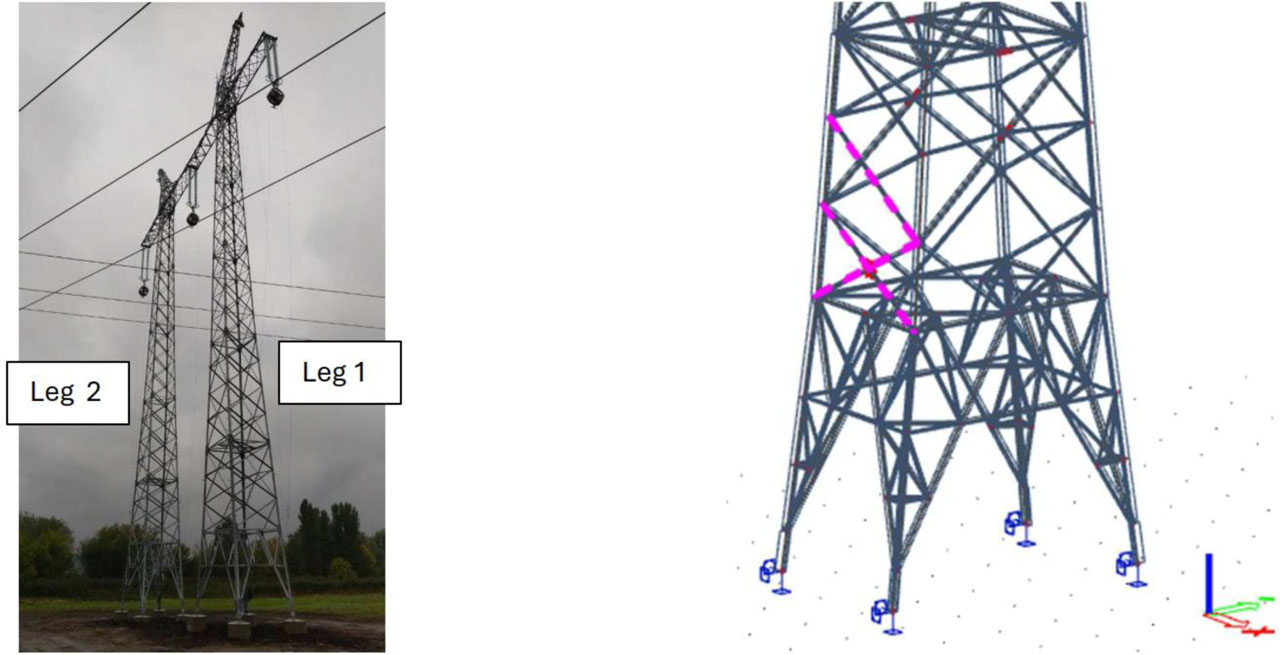
Figure 10:
Tower No. 906 on line V423 – Brno-Chrlice, damage on the right
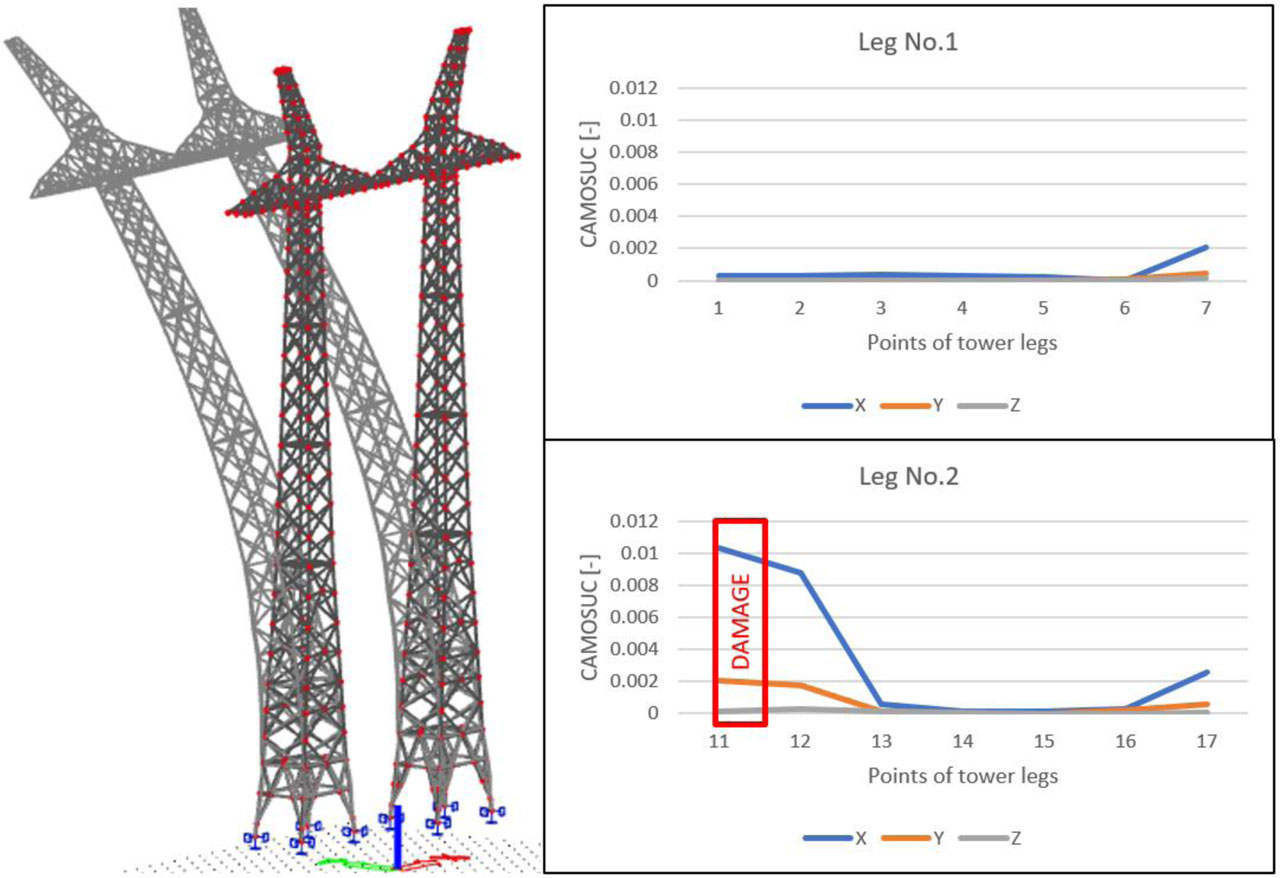
Figure 11:
1st mode shape and CAMOSUC results
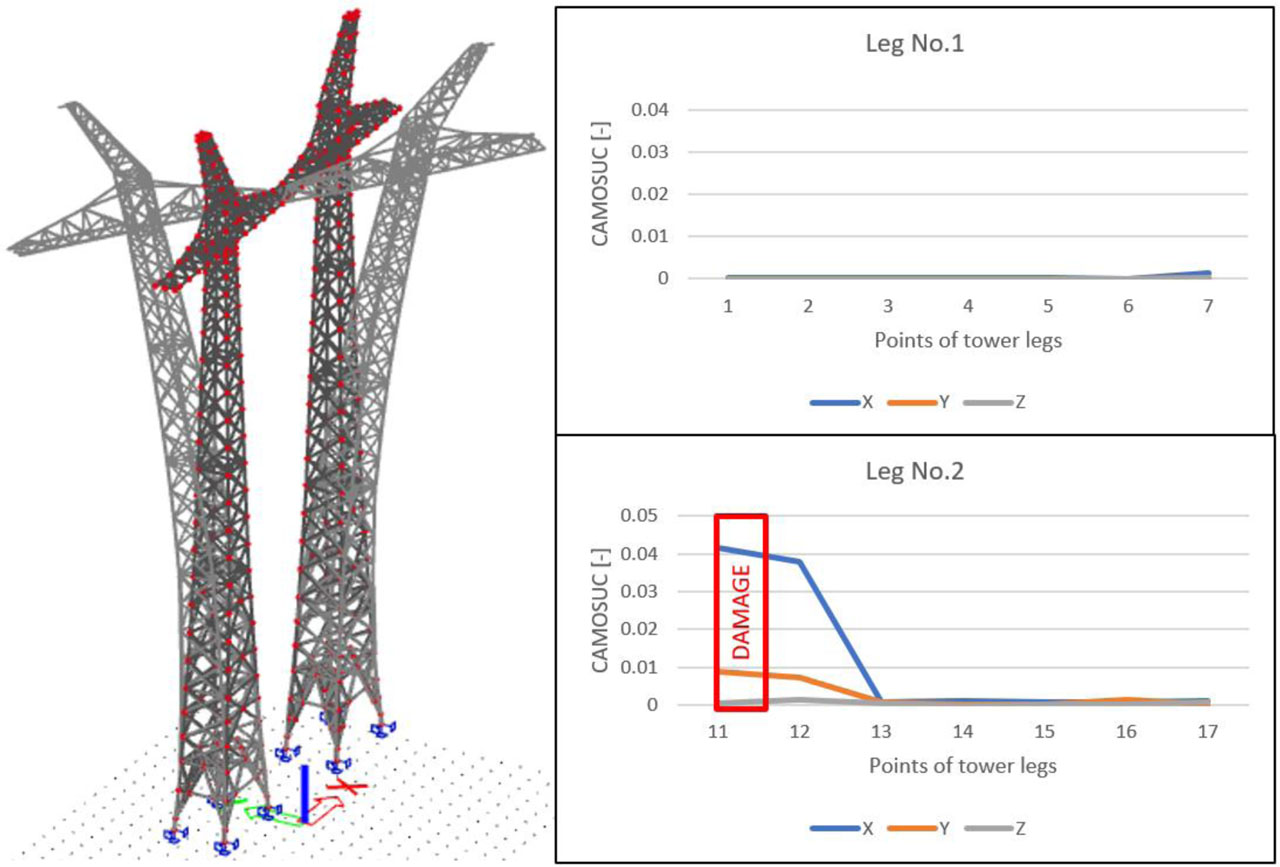
Figure 12:
2nd mode shape and CAMOSUC results
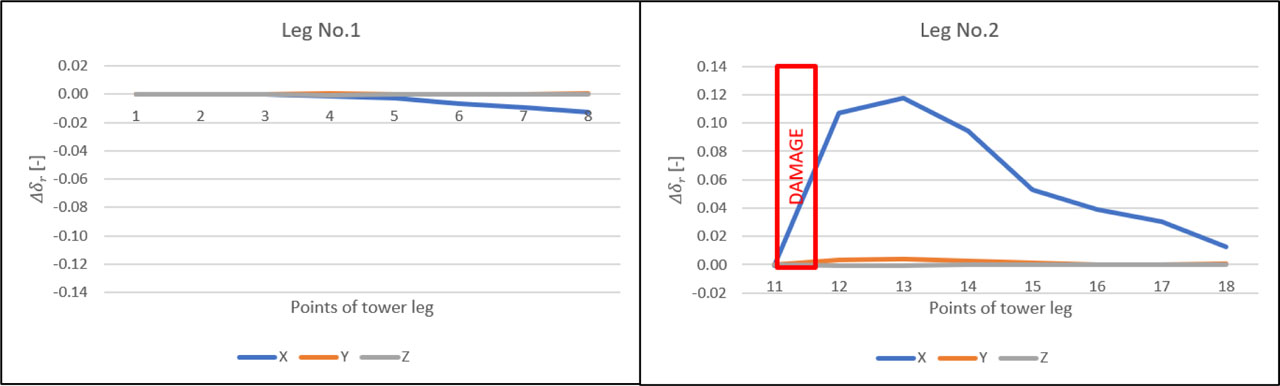
Figure 13:
Change in the diagonal elements of the modal flexibility
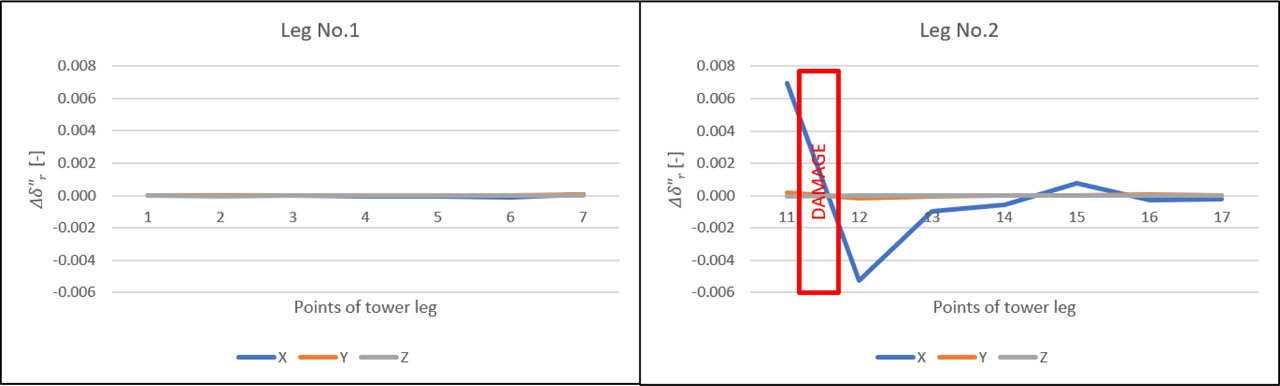
Figure 14:
Change in the second derivative of the diagonal elements of the modal flexibility matrix
4. Conclusion
The tested methods for damage detection and localization have proven to be applicable, and their functionality for the given types of structures and the proposed measurement instrumentation has been verified. Further research may focus on a deeper understanding and quantification of the results – specifically, defining threshold values that distinguish between significant structural damage and potential measurement inaccuracies.
Ground-based radar interferometry has demonstrated its effectiveness as a rapid, cable-free measurement method. It reliably identifies fundamental natural frequencies in the radar line-of-sight direction. However, measurements can be performed from multiple directions or using multiple radars. When corner reflectors are installed on the structures, the accuracy of the acquired data significantly improves. During the research, reflectors with remotely adjustable orientation were used, enhancing the quality of the reflected signal from multiple directions. However, for precise localization or detection of minor damage, this method is not sufficiently accurate. With the emergence of more affordable GB-RAR devices, the use of multiple radars will become more feasible, opening new possibilities for further exploration of this technology.
Acknowledgements
As part of the research, results from the OPPIK project titled “Ground-Based Radar Interferometry for Securing Critical Energy Infrastructure in the Czech Republic,” project registration number CZ.01.1.02/0.0/0.0/19_262/0020002, were utilized.
The research works were supported by the European Union within the framework of the INODIN project, CZ.02.01.01/00/23_020/0008487. For the purpose of Open Access, a CC BY 4.0 public copyright license has been applied by the authors to the present document and will be applied to all subsequent versions up to the Author Accepted Manuscript arising from this submission.
Notes
[1] Contributed by Author Contributions
J.S. and P.R. conceived and designed the study. T.P. carried out dynamic measurements, collected the data, and evaluated the results. M.T. designed and conducted radar interferometry measurements. J.S. worked on numerical analysis, compiled the data, and finalized the manuscript. All authors critically reviewed and approved the final version of the manuscript and agreed to be accountable for all aspects of the work.