

Table 1:
Characteristics of the HPC Mix (Hamda et al., 2025)
| Concrete Type | Density [kg/m3] | Compressive Strength [MPa] |
|---|---|---|
| HPCFS | 2583.8 | 113.5 |
| HPCPFS | 2460.9 | 105.92 |
| HPCDPFS | 2425.8 | 92.12 |
| HPCPFSQS | 2455.9 | 95.17 |
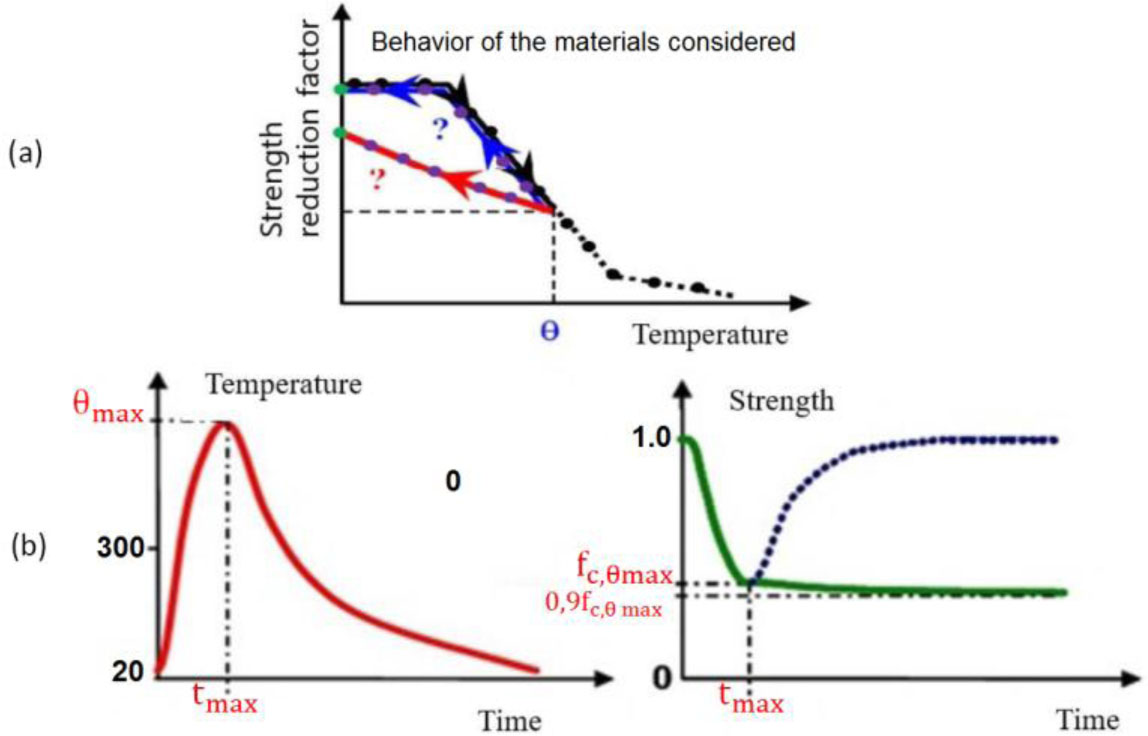
Figure 1:
Behavior of materials exposed to fire. (a) Evolution of strength as a function of temperature [T°]. (b) Behavior of concrete after cooling
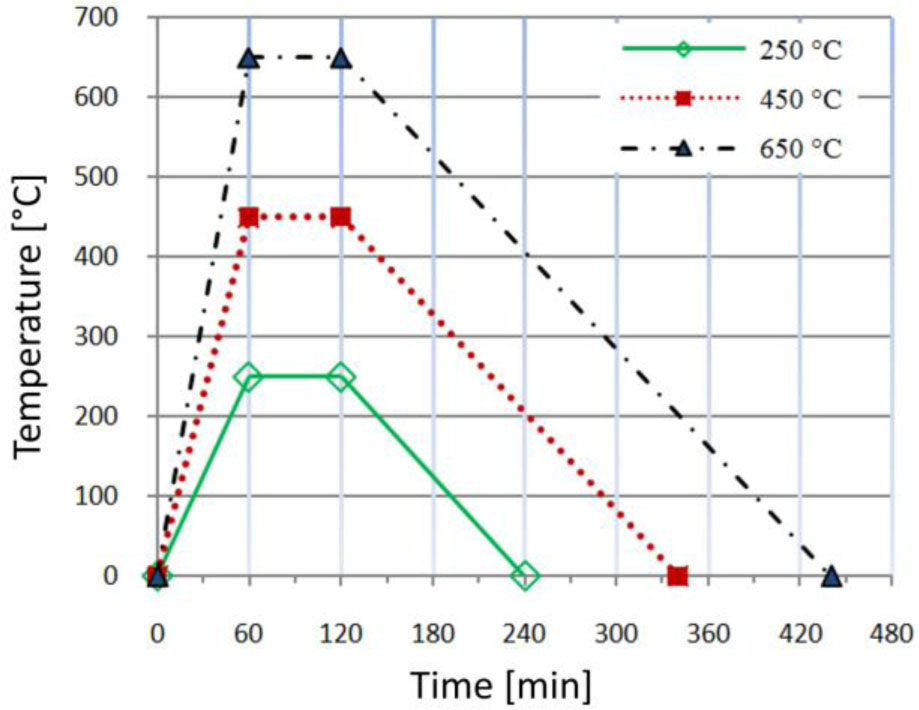
Figure 2:
Thermal treatment curve of the column: heating – stabilization – cooling
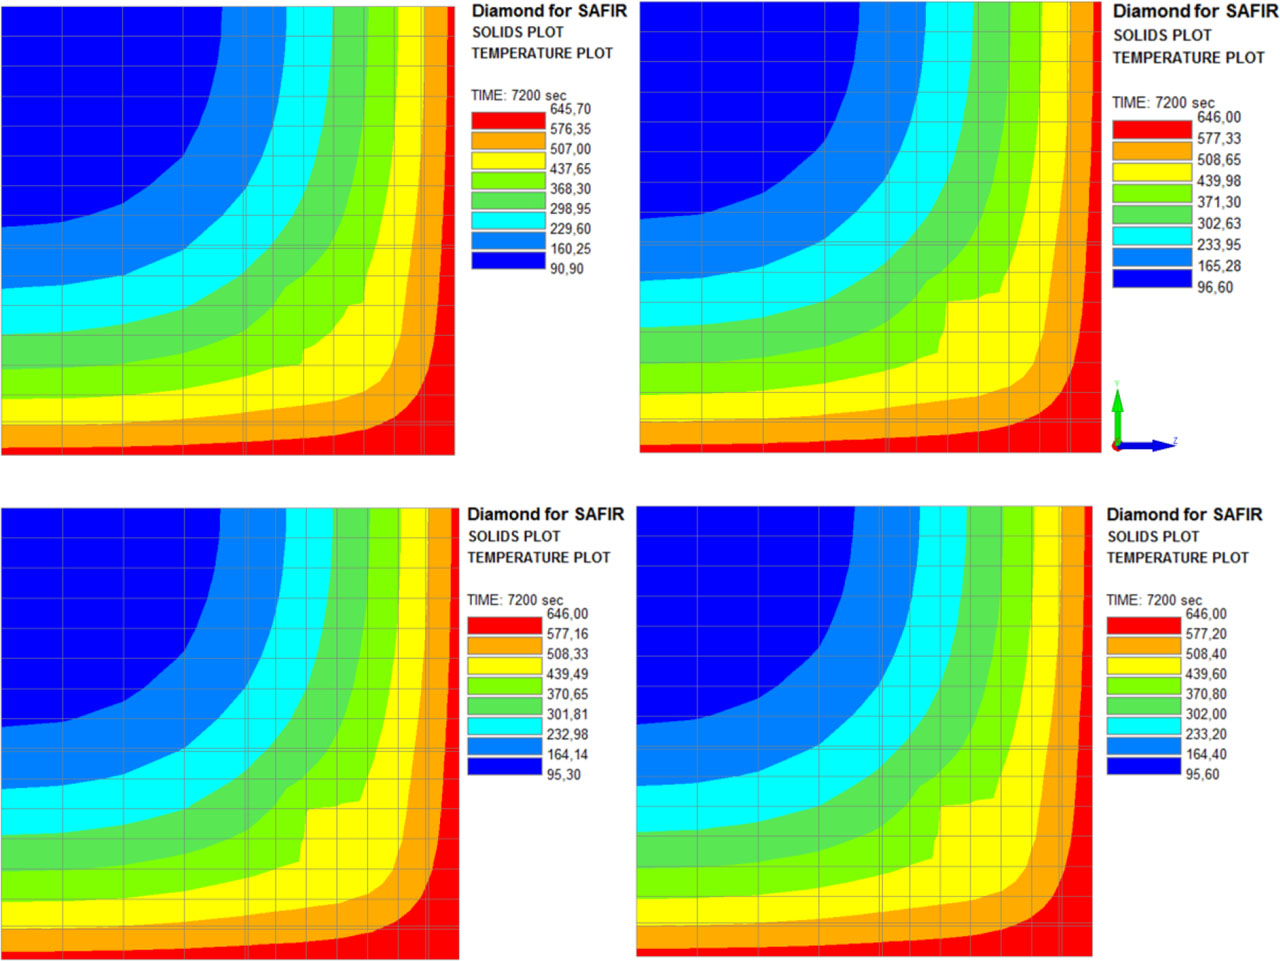
Figure 3:
Evolution of temperature distribution during heating phase
Table 2:
Temperature distribution at selected points in the column section at 250 °C
| Max T [°C] after 60 min End of warm-up phase | Max [°C] after 120 min End of stabilization phase | Max T [°C] after 940 min End of cooling phase phase | |||||||||||
|---|---|---|---|---|---|---|---|---|---|---|---|---|---|
| HPC FS | HPC PFS | HPC DPFS | HPC PFSQS | HPC FS | HPC PFS | HPC DPFS | HPC PFSQS | HPC FS | HPC PFS | HPC DPFS | HPC PFSQS | ||
| 14 | Corner | 186.7 | 188.0 | 187.6 | 188.1 | 228.0 | 228.7 | 228.6 | 228.8 | 29.1 | 28.5 | 28.3 | 28.5 |
| 79 | bars | 80.4 | 82.1 | 82.8 | 82.3 | 150.3 | 152.5 | 153.3 | 152.7 | 33.4 | 32.5 | 32.2 | 32.5 |
| 126 | Exposed face | 137.0 | 138.3 | 138.7 | 138.4 | 192.0 | 193.4 | 193.9 | 193.5 | 32 | 31.2 | 30.9 | 31.2 |
| 239 | Centre-section | 22.2 | 22.6 | 22.8 | 22.7 | 51.1 | 54.1 | 55.1 | 54.3 | 39.6 | 38.3 | 37.8 | 38.3 |
| 27 | Fiber in corner | 145.6 | 147.5 | 146.1 | 147.6 | 208.8 | 210.1 | 209.4 | 210.2 | 29.7 | 49.4 | 29.7 | |
| 20 | Fiber in face | 108.7 | 110.4 | 109.7 | 110.5 | 172.7 | 174.7 | 174.2 | 174.8 | 31.9 | 31.6 | 31.9 | |
| 118 | Fiber in center | 48.1 | 49.9 | 50.5 | 50.0 | 105.0 | 107.2 | 108.0 | 168.8 | 34.8 | 34.4 | 34.8 | |
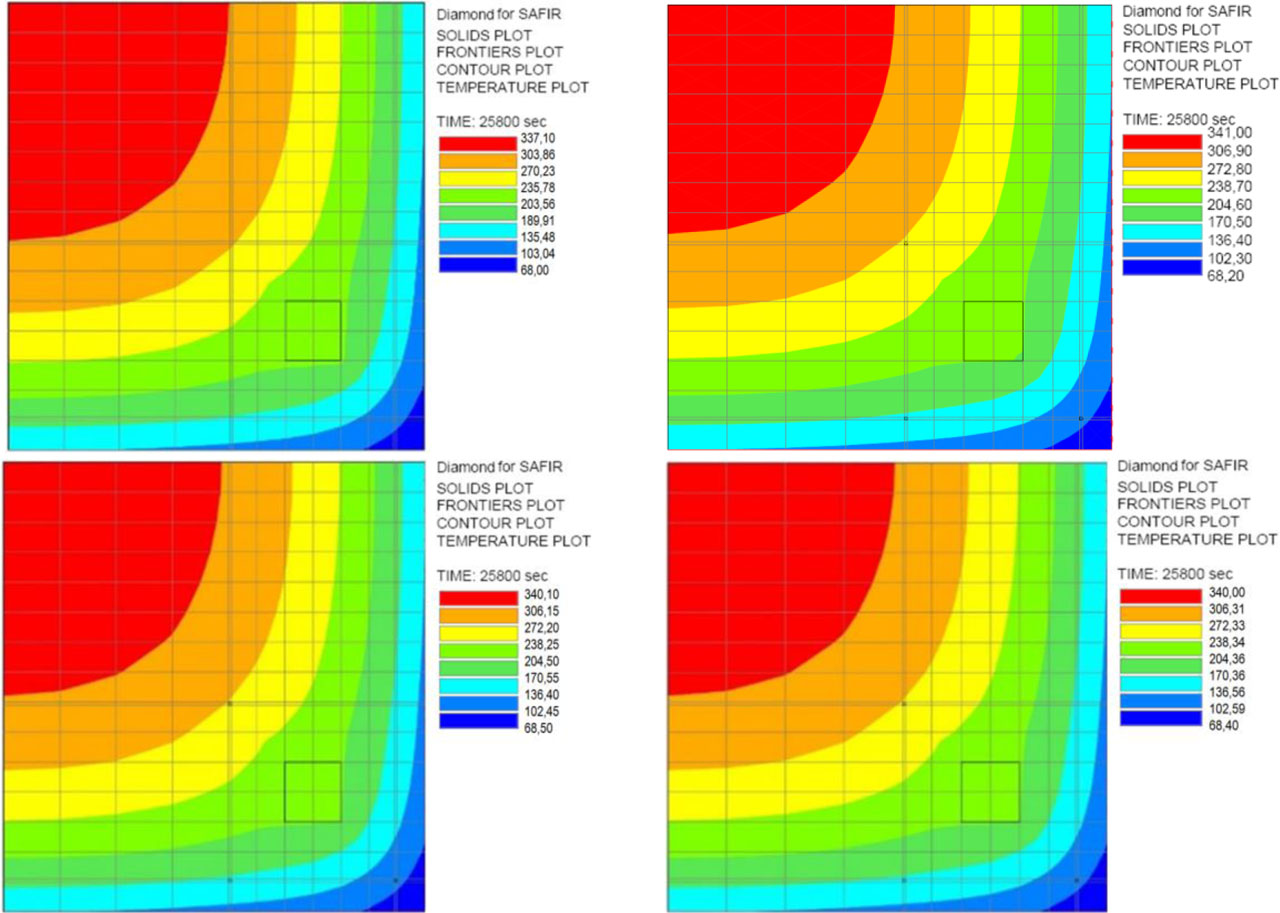
Figure 4:
Evolution of Temperature Distribution During Cooling Phase
Table 3:
Temperature distribution at selected points in the column section at 450°C
| Max T [°C] after 60 min (End of warm-up phase) | Max T [°C] after 120 min (End of stabilization phase) | Max T [°C] after 940 min (End of cooling phase) phase) | |||||||||||
|---|---|---|---|---|---|---|---|---|---|---|---|---|---|
| HPC FS | HPC PFS | HPC DPFS | HPC PFSQS | HPC FS | HPC PFS | HPC DPFS | HPC PFSQS | HPC FS | HPC PFS | HPC DPFS | HPC PFSQS | ||
| 14 | Corner | 395.4 | 397.4 | 398.0 | 397.4 | 438.3 | 438.8 | 439.0 | 438.8 | 35.5 | 34.5 | 34.2 | 34.5 |
| 79 | bars | 128.9 | 132.1 | 133.2 | 132.1 | 295.0 | 299.4 | 300.9 | 299.4 | 45 | 43.4 | 42.9 | 43.4 |
| 126 | Exposed face | 291.8 | 294.9 | 295.9 | 294.9 | 392.9 | 394.8 | 395.5 | 394.8 | 41.7 | 40.3 | 39.9 | 40.3 |
| 239 | Centre-section | 24.2 | 25.1 | 25.4 | 25.1 | 73.1 | 77.4 | 78.9 | 77.4 | 58.7 | 56.2 | 55.4 | 56.2 |
| 27 | Fiber in corner | - | 308.5 | 309.7 | 308.5 | - | 410.3 | 410.8 | 410.3 | 37.1 | 36.7 | 37.1 | |
| 20 | Fiber in face | - | 215.1 | 216.3 | 215.1 | - | 352.7 | 353.8 | 352.7 | 42 | 41.5 | 42 | |
| 118 | Fiber in center | - | 72.6 | 73.4 | 72.6 | - | 193.9 | 195.8 | 193.9 | 48.5 | 47.9 | 48.5 | |
Table 4:
Temperature distribution at selected points in the column section at 650°C
| Max T [°C] after 60 min (End of warm-up phase) | Max T [°C] after 120 min (End of stabilization phase) | Max T [°C] after 940 min (End of cooling phase) phase) | |||||||||||
|---|---|---|---|---|---|---|---|---|---|---|---|---|---|
| HPC FS | HPC PFS | HPC DPFS | HPC PFSQS | HPC FS | HPC PFS | HPC DPFS | HPC PFSQS | HPC FS | HPC PFS | HPC DPFS | HPC PFSQS | ||
| 14 | Corner | 623.2 | 624.5 | 624.8 | 624.6 | 645.7 | 646.0 | 646.0 | 646.0 | 52 | 50.4 | 49.9 | 50.4 |
| 79 | bars | 197.7 | 203.4 | 205.3 | 203.8 | 566.9 | 444.1 | 446.1 | 444.5 | 79.1 | 76.3 | 75.3 | 76.3 |
| 126 | Exposed face | 512.6 | 516.4 | 517.7 | 516.7 | 608.3 | 609.8 | 610.3 | 609.9 | 68.9 | 66.5 | 95.4 | 66.5 |
| 239 | Centre section | 26.2 | 27.4 | 27.8 | 27.5 | 90.9 | 95.3 | 96.6 | 95.6 | 120.3 | 115.2 | 113.5 | 115.2 |
| 27 | fiber in corner | - | 493.3 | 494.7 | 493.7 | - | 612.2 | 612.6 | 612.3 | 57.8 | 57.2 | 57.8 | |
| 20 | fiber in face | - | 358.6 | 360.5 | 359.1 | - | 537.8 | 538.9 | 538.1 | 71.5 | 70.7 | 71.5 | |
| 118 | fiber in center | - | 93.6 | 94.6 | 93.8 | - | 285.4 | 288.2 | 286.1 | 91.5 | 90.2 | 91.5 | |
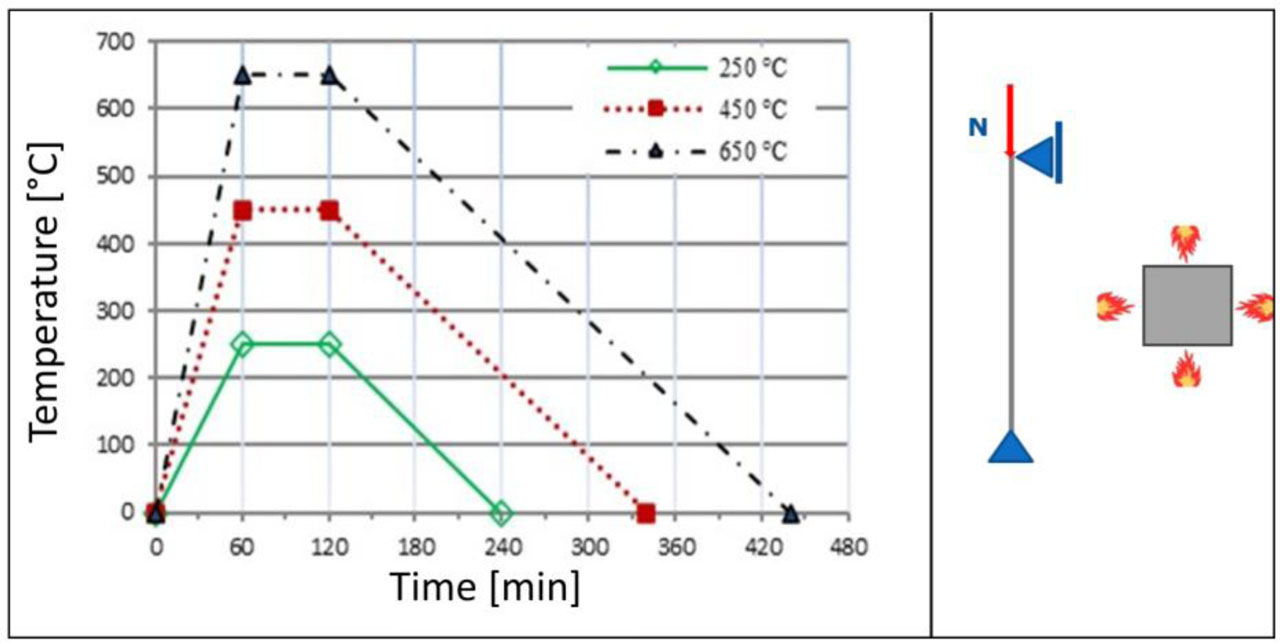
Figure 5:
Evolution of the load and applied temperature
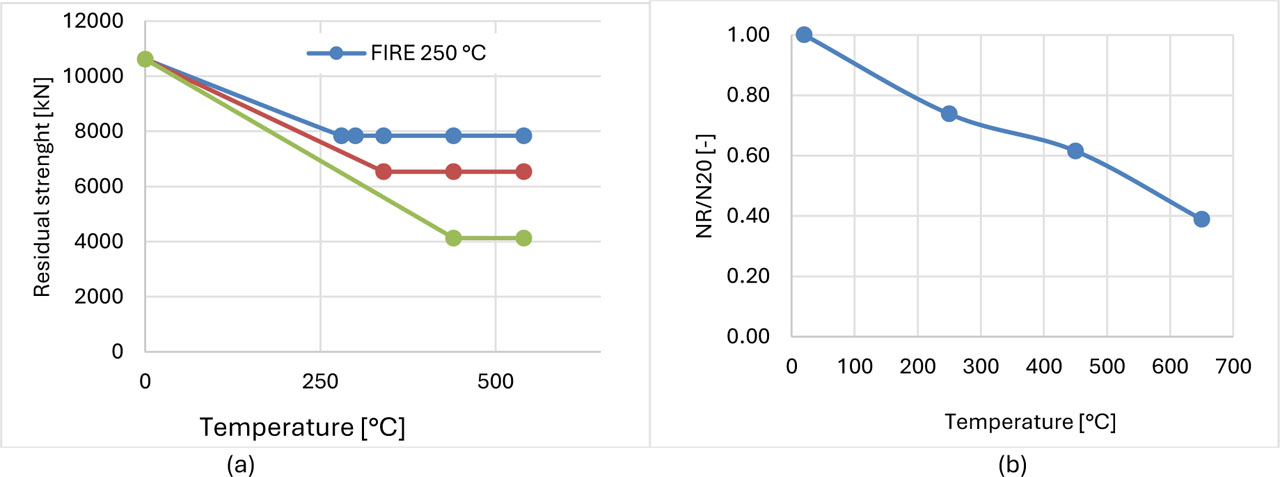
Figure 6:
Evolution [Nr] of the column as a function of temperature
Table 5:
Evolution of bearing capacity as a function of column height [m] and Temperature [°C]
| H | 3m | 4m | 5m | |||
|---|---|---|---|---|---|---|
| Nr | N20 | Nr/N20 | N20 | Nr/N20 | N20 | Nr/N20 |
| N20 | 10621.88 | 1.00 | 10336.88 | 1.00 | 9436.88 | 1.00 |
| N250 | 7840.00 | 0.74 | 7560.50 | 0.73 | 6780.50 | 0.72 |
| N450 | 6535.00 | 0.62 | 6160.00 | 0.60 | 5315.00 | 0.56 |
| N650 | 4130.00 | 0.39 | 3450.00 | 0.33 | 2885.00 | 0.31 |
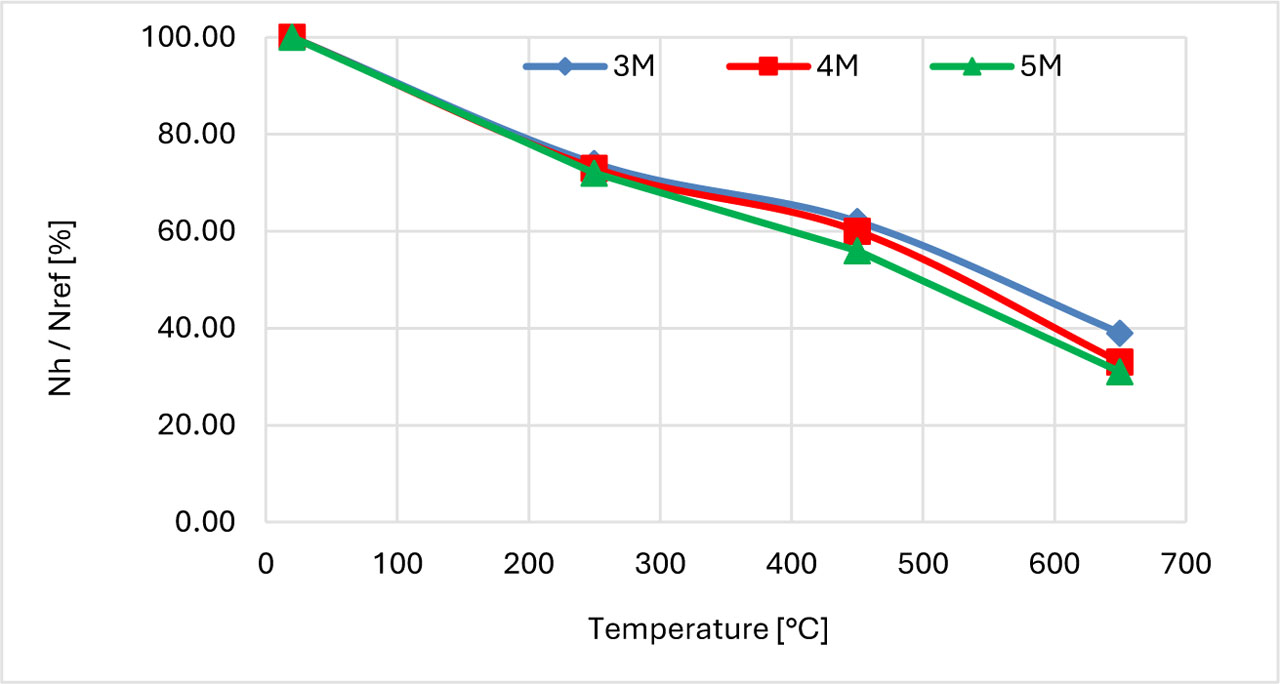
Figure 7:
Influence of Column Height on Residual Load-Bearing Capacity [Nr]
Table 6:
Evolution of bearing capacity as a function of column section dimensions
| H | 30×30 [cm2] | 40×40 [cm2] | ||
|---|---|---|---|---|
| Nr | N20 | Nr/N20 | N20 | Nr/N20 |
| N20 | 10621.88 | 1.00 | 18751.88 | 1.00 |
| N250 | 7840.00 | 0.74 | 14190.00 | 0.76 |
| N450 | 6535.00 | 0.62 | 12125.00 | 0.65 |
| N650 | 4130.00 | 0.39 | 9200.00 | 0.49 |
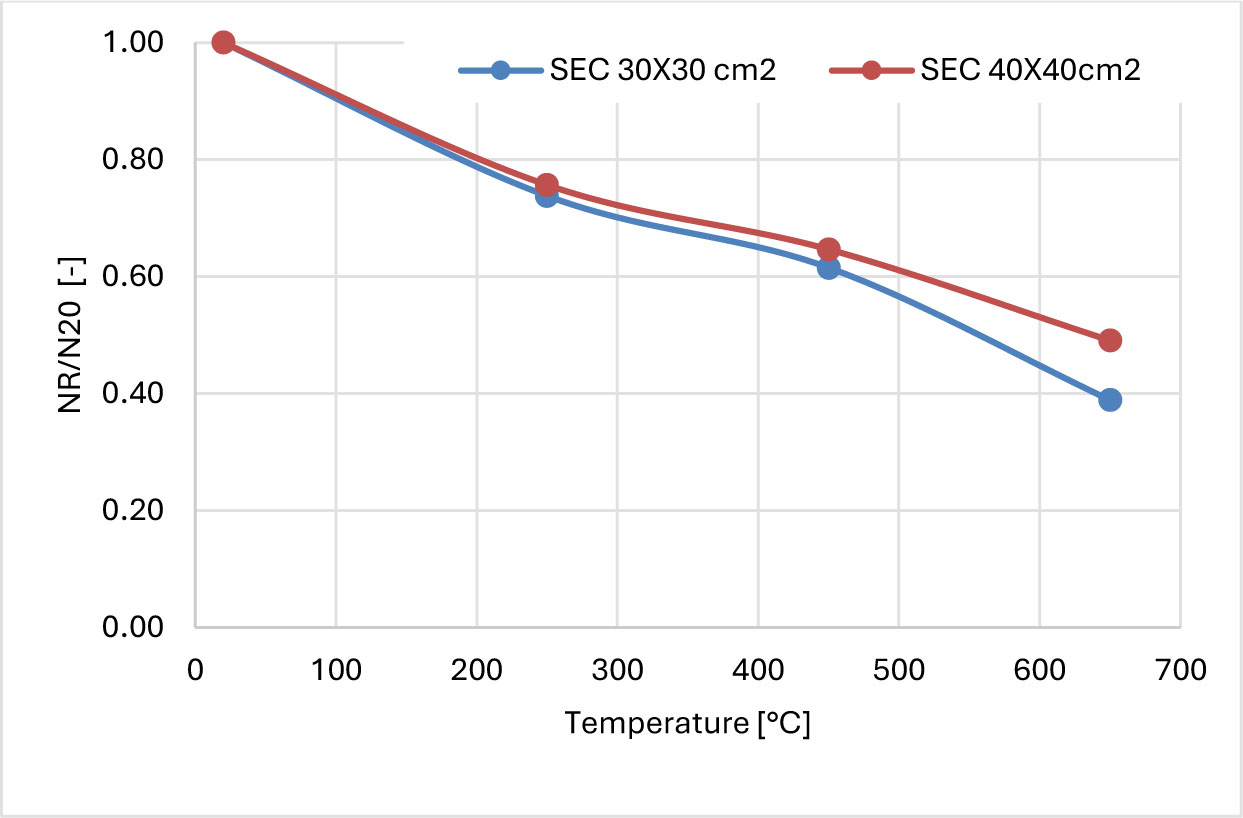
Figure 8:
Evolution of [Nr/N20] as a function of column section and temperature
Table 7:
Evolution of bearing capacity as a function of support conditions
| Double support and single support | Triple support and single support | |||
|---|---|---|---|---|
| Nr | N20 | Nr/N20 | N20 | Nr/N20 |
| N20 | 10621.88 | 1.00 | 10833.75 | 1.00 |
| N250 | 7840.00 | 0.74 | 8040.00 | 0.74 |
| N450 | 6535.00 | 0.62 | 6725.00 | 0.62 |
| N650 | 4130.00 | 0.39 | 4460.00 | 0.41 |
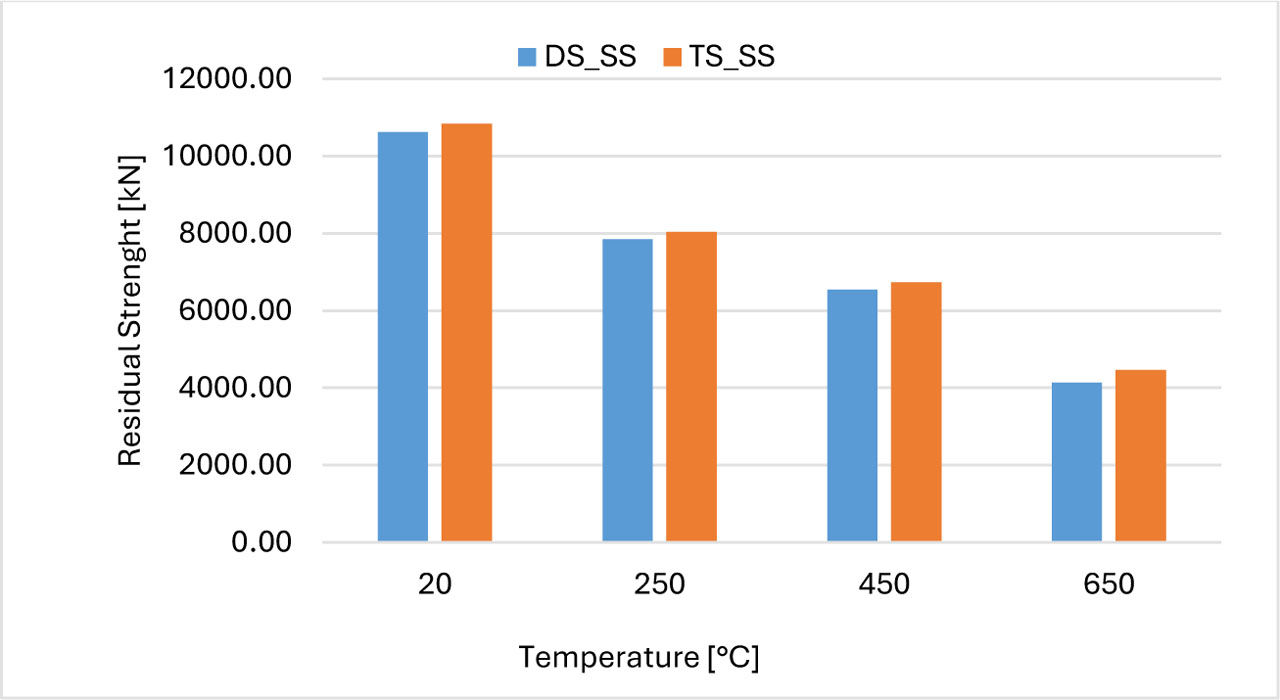
Figure 9:
Evolution of bearing capacity as a function of support conditions
Table 8:
Effect of concrete mix types on residual strength
| HPCFS | HPCPFS | HPCDPFS | ||||
|---|---|---|---|---|---|---|
| N20 [kN] | Nr/N20 [-] | N20 [kN] | Nr/N20 [-] | N20 [kN] | Nr/N20 [-] | |
| N20 [°C] | 10621.88 | 1.00 | 9965.5 | 1.00 | 8791.87 | 1.00 |
| N250 [°C] | 7840 | 0.74 | 7448 | 0.75 | 6750 | 0.77 |
| N450 [°C] | 6535 | 0.62 | 6115 | 0.61 | 6227 | 0.71 |
| N650 [°C] | 4130 | 0.39 | 3840 | 0.39 | 5040 | 0.57 |
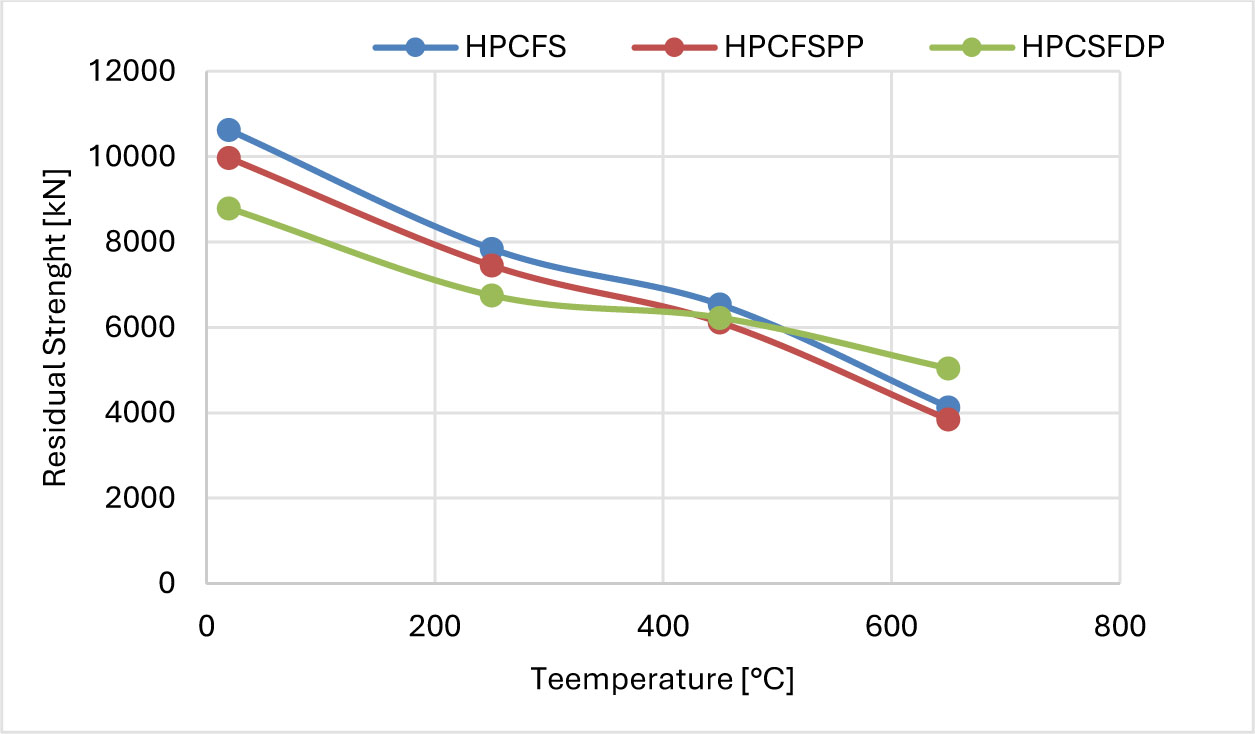
Figure 10:
Variation of Bearing Capacity for Different Concrete Mixes