

1. Introduction
Assessing the fire resistance of reinforced concrete structures requires a comprehensive approach that considers both the heating and cooling phases (Dimia et al., 2011; Gernay, 2019; Pul et al., 2021; Cherif et al., 2021, Anand et al., 2023; Gernay et al., 2023; Paul Thanaraj et al., 2023). Traditional fire resistance evaluations primarily focus on the heating phase, assessing structural integrity at peak gas temperatures (Khoury, 2000; Amran et al., 2022; Hassan et al., 2023). However, real fire scenarios extend beyond this critical phase. Material degradation and the loss of load-bearing capacity continue well after the flames are extinguished, during the cooling phase. This phase, often overlooked in conventional analyses, can be crucial for post-fire structural stability (Roitman, 1990; Qin et al., 2022; Lafta and Ali, 2024).
According to several authors, the minimum load-bearing capacity of a reinforced concrete element does not necessarily occur at the peak temperature; it may develop later due to delayed deterioration resulting from the combined effects of thermal and mechanical stresses. A static analysis that considers only the element's condition at maximum heating may therefore underestimate the actual extent of post-fire degradation. It is crucial to adopt a dynamic, time-dependent approach that accounts for the structural behavior throughout the entire thermal cycle of a fire, from heating to complete cooling (Raouffard and Nishiyama, 2016; Di et al., 2018; Esfahani et al., 2021; Kanibou et al., 2024). The evolution of structural resistance after fire exposure is governed by two main factors:
Temperature evolution during cooling
Contrary to common assumptions, the cessation of external heating does not immediately lead to a uniform temperature decrease within the material. In large cross-sections, accumulated heat can continue diffusing inward, maintaining or even increasing the temperature in certain internal zones. This delayed heating effect prolongs thermal exposure and can exacerbate structural weakening. Additionally, the thermal gradient between surface and internal layers induces internal stresses, promoting crack formation and further mechanical degradation (Pasztetnik and Wróblewski, 2021; Molkens, 2022).
Thermo-mechanical behavior of materials
Steel and concrete respond differently to post-fire cooling. While reinforcement steel loses some of its mechanical strength at high temperatures, it can partially recover its properties upon cooling, provided that the peak temperature did not exceed a critical threshold of permanent degradation. In contrast, concrete undergoes irreversible transformations, including microcracking, spalling, and strength losses, which vary depending on the peak temperature and cooling regime (Netinger et al., 2011; GUERGAH et al., 2018; Gherabliet al., 2025; Naqee and Daud, 2025).
Experimental studies have demonstrated that cooling conditions significantly influence the residual strength of concrete. Gradual cooling helps preserve mechanical properties, whereas rapid cooling causing thermal shock can lead to strength reductions of up to 33% compared to slow cooling (Carvalho et al., 2019; Baghdadi et al., 2025). This loss results from internal stresses generated by sudden temperature changes, leading to increased cracking and material disintegration (Babalola et al., 2021). In this context, the present study builds on the work of Hamda et al. (2025) to examine the residual load-bearing capacity of reinforced concrete columns exposed to natural fire scenarios, with a particular focus on the impact of cooling. Columns play a critical role in structural stability, and their failure after a fire can lead to progressive collapse. To accurately assess their post-fire behavior, numerical simulations were conducted using the SAFIR software (Nwosu et al., 2007), which enables advanced modeling of thermo-mechanical interactions in fire-exposed structures. Several key physical and mechanical parameters are considered, including fire exposure duration, cooling regimes, column height, cross-sectional dimensions, support conditions, and full-face fire exposure. By analyzing these factors, the study aims to identify the most influential parameters affecting the post-fire behavior of reinforced concrete columns.
Special attention is given to high-performance concrete (HPC) incorporating date palm fibers (HPCDPFS), a material that has demonstrated superior fire resistance properties. This research builds on the findings of Hamda et al. (2025) by providing a more in-depth analysis of post-fire structural behavior, with a particular focus on the often-underestimated effects of cooling. By identifying the key parameters governing residual strength, the study contributes to a better understanding of the thermo-mechanical behavior of fire-exposed reinforced concrete.
Ultimately, this research aims to enhance fire resistance assessment methodologies and improve fire safety design guidelines. By integrating the effects of cooling into structural evaluations, the study helps refine fire resistance design strategies and structural safety assessment methods, ensuring better adaptation to fire resistance requirements in the construction industry.
2. Description of the Study
2.1. Physical and Mechanical Properties of Materials
The structural performance of reinforced concrete columns under fire depends strongly on the thermal and mechanical properties of their constituent materials. Concrete exhibits temperature-dependent variations in density, compressive strength, thermal conductivity, and specific heat, while also undergoing irreversible microstructural damage during cooling. The inclusion of fibers (polypropylene or date palm) modifies cracking behavior and improves resistance to thermal degradation. Reinforcing steel, in contrast, shows largely reversible mechanical properties, with partial recovery of strength and stiffness after cooling if critical temperature thresholds are not exceeded. Accurately defining these properties is essential for realistic numerical modeling of the columns’ post-fire load-bearing capacity.
2.2. Thermal Model
The thermal properties of concrete and steel during the heating phase are derived from EN 1994-1-2 (Eurocode 4, 2005):
a). Concrete
These high-performance concrete (HPC) mixes were designed to investigate the roles of polypropylene and date palm fibers in HPC. The baseline mix, referred to as HPCFS, contained silica fume without any fiber addition and served as the control sample. The second formulation, HPCPFS, was enhanced with polypropylene fibers alongside silica fume. The third mix, HPCDPFS, incorporated date palm fibers with silica fume to explore the effect of natural fibers. The final formulation, HPCPFSQS, was a composite mix that included polypropylene fibers and a combination of quarry sand and dune sand, in addition to silica fume, to examine the synergistic effects of synthetic and natural materials in HPC.
The HPCFS, HPCPFS, HPCDPFS, and HPCPFSQS formulations were selected, each possessing unique properties summarized in the following table. Their densities vary as indicated, with corresponding water content. During heating, the specific mass of the concrete decreases due to the complete evaporation of internal moisture. However, during cooling, it is assumed that the specific mass remains constant, corresponding to its value at the maximum temperature reached. Each type of concrete has a characteristic compressive strength at 28 days (fc28), measured at ambient temperature, as listed in Table 1. Tensile strength is neglected in all calculations. Additionally, the thermal conductivity of the concrete is taken at its upper limit. As temperature increases, thermal conductivity tends to decrease, as specified in EN 1994-1-2 (Eurocode 4, 2005). This decrease is irreversible upon cooling, and the thermal conductivity remains constant at the value determined at the maximum temperature.
Table 1:
Characteristics of the HPC Mix (Hamda et al., 2025)
| Concrete Type | Density [kg/m3] | Compressive Strength [MPa] |
|---|---|---|
| HPCFS | 2583.8 | 113.5 |
| HPCPFS | 2460.9 | 105.92 |
| HPCDPFS | 2425.8 | 92.12 |
| HPCPFSQS | 2455.9 | 95.17 |
b). Steel
The thermal and mechanical behavior of steel is defined according to EN 1994-1-2 (Eurocode 4, 2005), with its properties assumed to be fully reversible during the cooling phase. The thermal properties governing heat transfer and temperature distribution thermal conductivity and specific heat are considered nonlinear and temperature-dependent. For structural analysis, the primary physical property of interest is thermal elongation. Additionally, the emissivity of steel is set at 0.7, while the convective heat transfer coefficient is taken as 35 W/m2K to account for heat exchange between the steel surface and its surroundings.
2.3. Thermal Properties
For the sake of consistency, the thermal conductivity and specific heat capacity of concrete were taken uniformly from Eurocode 2 for all mixes. This simplification was adopted to isolate the influence of structural parameters and material composition on the mechanical response, while acknowledging that fiber addition may alter the thermal properties of concrete.
2.4. Mechanical Properties
The reinforcement bars used in reinforced concrete are classified as S400, with their mechanical properties assumed to be fully reversible. This means that both stiffness and strength are completely restored to their initial values upon cooling.
In the thermal elongation curve, the plateau region corresponds to a phase transformation occurring around 800 °C, with an elongation value of 11 × 10−3. However, this transformation may begin at slightly lower temperatures, approximately 700 °C, where the elongation is 9 × 10⁻³. Upon cooling, as the steel returns to ambient temperature, no residual thermal expansion is observed. For concrete, residual thermal expansion or shrinkage is considered when the material returns to ambient temperature. Its residual value depends on the maximum temperature reached and is determined through experimental testing (Schneider, 1988; Krishna et al., 2019; Abid et al., 2022). Spalling is not considered in this study as an assumption. The compressive strength of concrete does not recover upon cooling; instead, an additional 10 % strength loss is accounted for, as specified in EN 1994-1-2 (Eurocode 4, 2005). For example, if the compressive strength decreases from 1.00 to 0.50 at a given temperature, it will further reduce to 0.45 upon returning to ambient temperature. This assumption is critical for all predictions made in this research regarding the residual vertical load-bearing capacity of the columns after exposure to the complete fire scenario. Recent findings by (Li and Franssen, 2011; Elsanadedy, 2019; Shahraki et al., 2023), based on an analysis of experimental data from the literature, indicate that the additional reduction in compressive strength during cooling can exceed the 10 % loss specified in EN 1994-1-2 (Eurocode 4, 2005). (Figure 1). Furthermore, in the stress-strain relationship of concrete, the strain corresponding to peak stress during cooling remains fixed, matching its value at the maximum temperature reached (Felicetti et al., 2009).
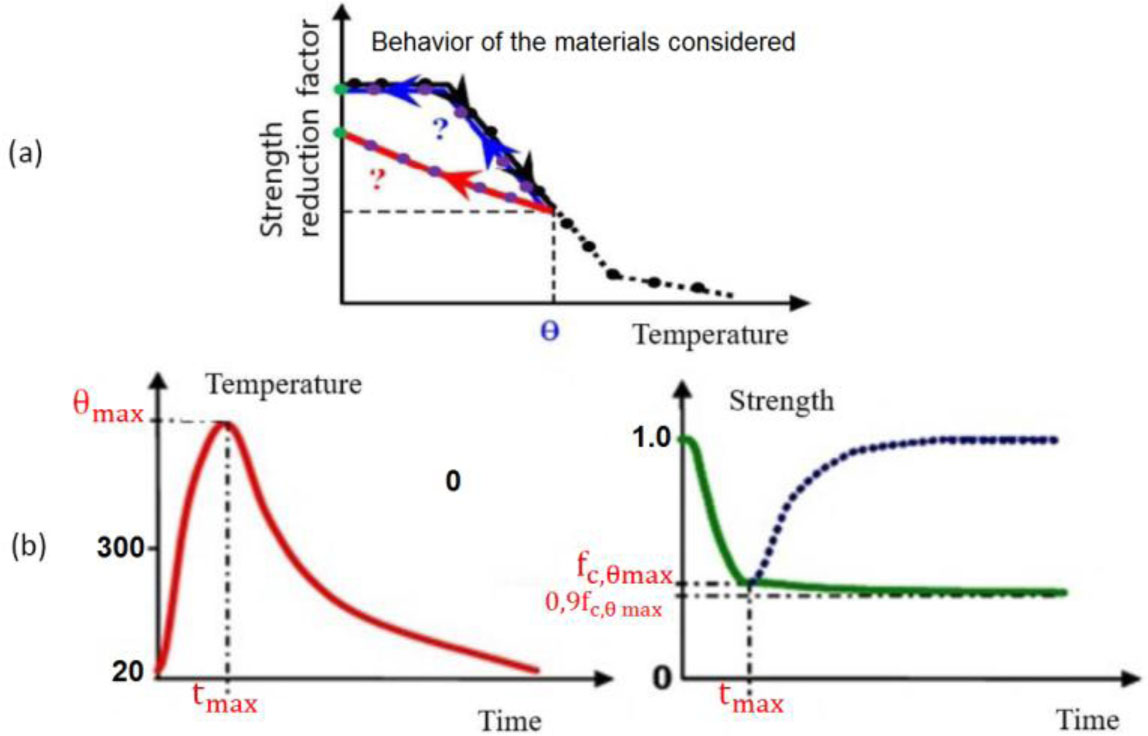
Figure 1:
Behavior of materials exposed to fire. (a) Evolution of strength as a function of temperature [T°]. (b) Behavior of concrete after cooling
2.5. Numerical Analysis Process
During the thermal analysis phase, the temperature distribution within the cross-sections was determined using nonlinear 2D transient analyses. The SAFIR software simulates heat transfer in solid structures primarily through conduction, while at the structural boundaries, heat exchange with the environment occurs via convection and radiation. In concrete, heat conduction is governed by Fourier’s equation, expressed in a Cartesian coordinate system. The software employs an iterative process, evaluating temperature evolution over multiple time steps until thermal equilibrium is reached. The results from this thermal analysis were then integrated into the structural modeling to assess the mechanical response of the columns.
For the structural analysis, the columns were longitudinally discretized using Bernoulli beam elements, while their cross-sections were divided into fibers corresponding to the 2D elements used in the thermal analysis. This fiber based approach ensures that the thermal effects on material properties are accurately incorporated into the structural response assessment.
2.5.1. Thermal Analysis of Reinforced Concrete Columns
In this analysis, the same time–temperature curves adopted in the work of Hamda et al. (2023), were applied as the thermal load for the columns under investigation (Figure 2). The results are discussed in the following steps:
Phase 1: Increasing Temperature Phase (ITP)
The heating cycle involved a temperature rise at a rate of approximately 3 to 8 °C /min until the target temperature was reached.
Phase 2: Stabilization Phase (SP)
During this phase, the temperature was held constant for 90 minutes, allowing the material to reach thermal equilibrium before cooling.
Phase 3: Fire Cooling Phase (FCP)
The gas temperature decreased from its maximum value to ambient temperature (20 °C). The initial cooling rate averaged 1 °C /min, with the rate potentially varying over time.
Phase 4: Residual Phase (RP)
This phase corresponds to the post-fire condition, when the concrete temperature has fully returned to ambient temperature (20 °C).
The following temperature curves are applied uniformly to the reinforced concrete columns on all four sides.
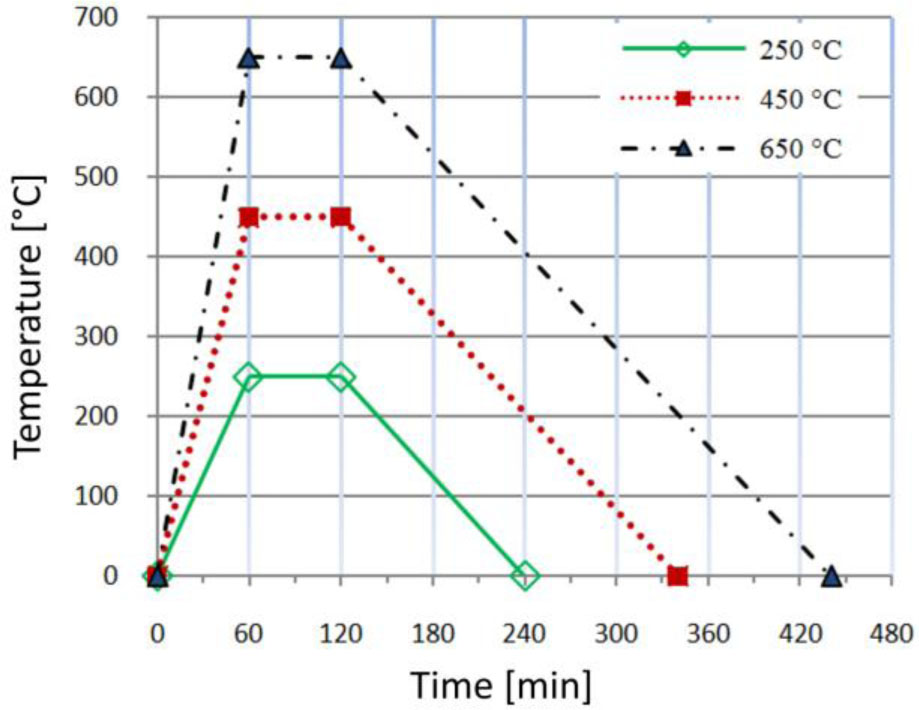
Figure 2:
Thermal treatment curve of the column: heating – stabilization – cooling
2.5.2. Cooling Phase Implementation in SAFIR
The cooling phase was explicitly modelled in SAFIR by extending the thermal analysis beyond the heating period, with the boundary conditions adjusted to represent post-fire cooling. The fire exposure followed the heating curve proposed by Hamda et al. (2025) until the specified fire duration (e.g., 60, 90, or 120 minutes). At the end of this period, the temperature of the surrounding environment was gradually reduced to ambient according to predefined cooling curves. Two cooling regimes were considered:
Natural cooling (air cooling): the gas temperature was decreased progressively from the peak fire temperature back to ambient following an exponential decay function, which approximates natural cooling by convection and radiation to the environment.
Rapid cooling (water quenching): a linear and much steeper decrease of gas temperature was applied, simulating the effect of water application during fire fighting. This approach induced sharper temperature gradients across the section and more severe thermal shock in the concrete.
In SAFIR, these conditions were implemented by modifying the fire curve input after the end of the heating phase. The thermal analysis then calculated the transient temperature distribution within the cross-section during cooling, which was subsequently used in the mechanical analysis to assess the residual load-bearing capacity.
While these cooling scenarios provide a useful approximation, it should be noted that the actual thermal response of concrete subjected to water quenching may involve additional mechanisms such as pore pressure build-up and spalling, which are not fully captured in the current model. These limitations have been acknowledged and are recommended for further experimental investigation.
2.5.3. Structural Analysis
2.5.3.1. Analysis of Vertical Load-bearing Capacity
The selected cross-sections are commonly used in construction in Algeria. The studied columns have square cross-sections of 30 × 30 cm and 40 × 40 cm, reinforced with 4 or 6 bars and a concrete cover of 30 mm. One of the main objectives of this study is to analyze the parameters and conditions that influence the residual load-bearing capacity of columns during or after the cooling phase. The key parameters considered include heating duration under various fire scenarios, column height, cross-sectional dimensions, support conditions, and concrete mix composition. In most cases, a reference column with a height of 3.00 meters and a 30 × 30 cm cross-section is used as a baseline for analysis.
2.5.3.2. Thermo-Mechanical Modeling and Temperature Distribution in Columns
Figure 3 and Figure 4 present the evolution of temperature distribution across the 30 × 30 cm column section with a 30 mm cover during the heating and cooling phases for fire scenarios at 250°C, 450°C, and 650°C. The results highlight the influence of different concrete mix types HPCFS, HPCPFS, HPCDPFS, and HPCPFSQS on temperature distribution. At the end of the heating phase, after 60 minutes of exposure, the maximum temperatures recorded at the column corners were 186.7°C, 188.0°C, 187.6°C, and 188.1°C for HPCFS, HPCPFS, HPCDPFS, and HPCPFSQS, respectively, under the 250°C fire. For the 450°C fire, these temperatures increased to 395.4°C, 397.4°C, 398.0°C, and 397.4°C, while for the 650°C fire, they reached 623.2°C, 624.5°C, 624.8°C, and 624.6°C. These variations demonstrate that temperature distribution is influenced by both fire intensity and concrete composition.
At the end of the stabilization phase, after 120 minutes of exposure, the temperatures at the exposed face were 192.0 °C, 193.4 °C, 193.9 °C, and 193.5 °C for the 250 °C fire, 392.9 °C, 394.8 °C, 395.5 °C, and 394.8 °C for the 450 °C fire, and 608.3 °C, 609.8 °C, 610.3 °C, and 609.9 °C for the 650 °C fire. These results indicate that the addition of polypropylene or date palm fibers slightly influenced the temperature distribution, with HPCDPFS showing marginally higher temperatures compared to the other mixes.
During the cooling phase, which lasted 940 minutes, the core temperatures decreased significantly but remained higher than at the surface. For the 250°C fire, the core temperatures were 39.6°C, 38.3°C, 37.8°C, and 38.3°C for HPCFS, HPCPFS, HPCDPFS, and HPCPFSQS, respectively. For the 450°C fire, these values were 58.7°C, 56.2 °C, 55.4 °C, and 56.2°C, and for the 650°C fire, they reached 120.3°C, 115.2°C, 113.5°C, and 115.2°C. These results confirm that the core of the section retains heat longer, even after cooling, due to the thermal inertia of concrete.
The temperatures of the reinforcement bars near the exposed face also varied significantly. At the end of the stabilization phase, under the 250°C fire, the bar temperatures were 150.3°C, 152.5°C, 153.3°C, and 152.7°C for HPCFS, HPCPFS, HPCDPFS, and HPCPFSQS, respectively. For the 450°C fire, these values increased to 295.0°C, 299.4°C, 300.9 °C, and 299.4 °C, and for the 650 °C fire, they reached 566.9 °C, 444.1 °C, 446.1 °C, and 444.5 °C.
The higher temperatures recorded in the reinforcement bars for the 650°C fire highlight the role of the 30 mm concrete cover in providing thermal insulation and delaying the temperature rise in the reinforcement. These findings demonstrate that the type of concrete mix and the presence of fibers influence the thermal behavior of reinforced concrete columns under fire conditions. The addition of date palm fibers in HPCDPFS showed a slight improvement in thermal resistance compared to other mixes, particularly at higher temperatures. This emphasizes the importance of material selection and cover thickness in maintaining structural integrity during and after fire exposure.
Tables 2, 3, and 4 illustrate the evolution of maximum temperatures at different points within the concrete and reinforcement bars for the 30 × 30 cm column subjected to fire scenarios at 250°C, 450°C, and 650°C.
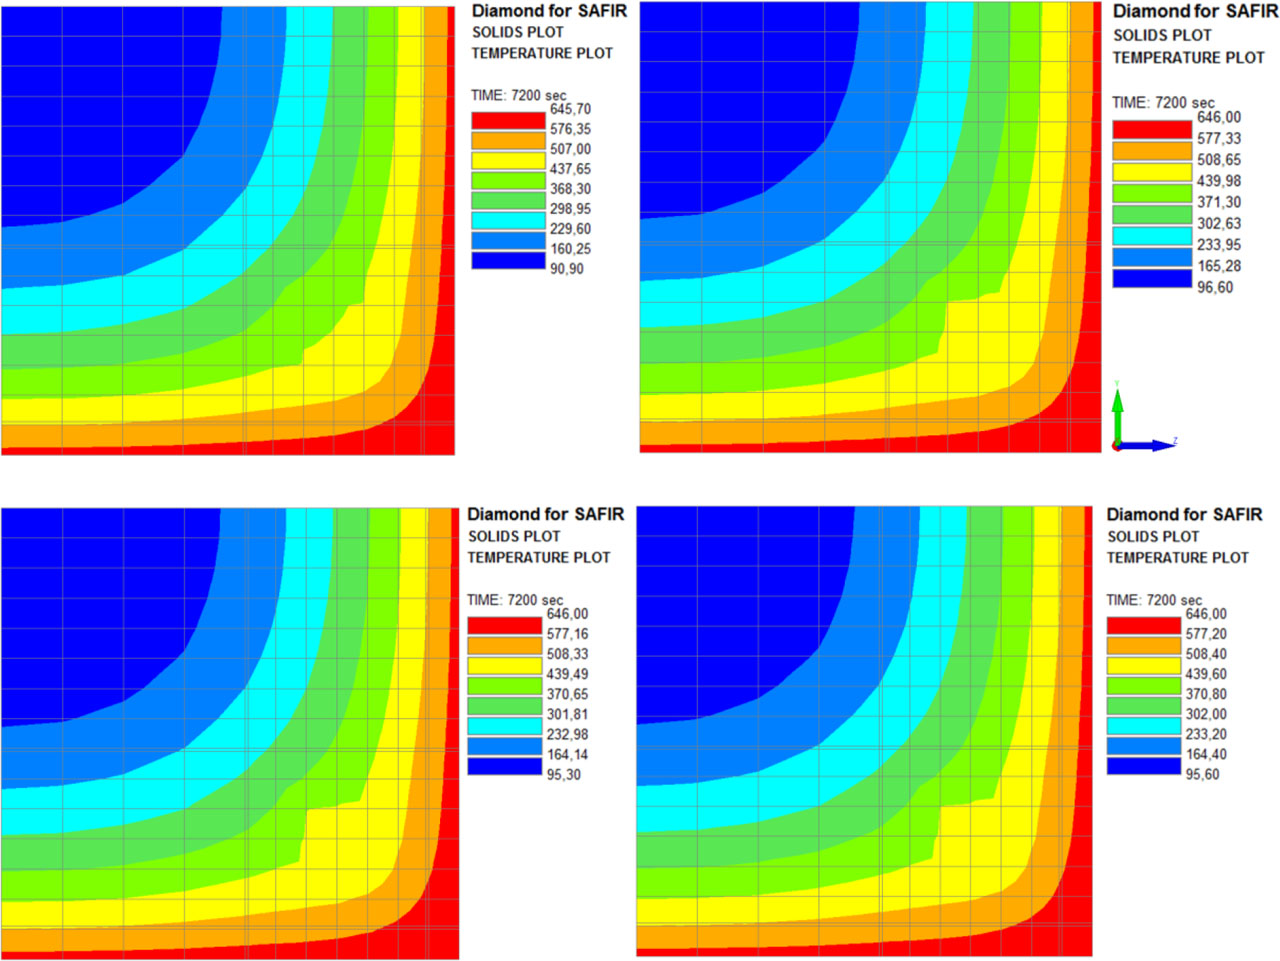
Figure 3:
Evolution of temperature distribution during heating phase
Table 2:
Temperature distribution at selected points in the column section at 250 °C
| Max T [°C] after 60 min End of warm-up phase | Max [°C] after 120 min End of stabilization phase | Max T [°C] after 940 min End of cooling phase phase | |||||||||||
|---|---|---|---|---|---|---|---|---|---|---|---|---|---|
| HPC FS | HPC PFS | HPC DPFS | HPC PFSQS | HPC FS | HPC PFS | HPC DPFS | HPC PFSQS | HPC FS | HPC PFS | HPC DPFS | HPC PFSQS | ||
| 14 | Corner | 186.7 | 188.0 | 187.6 | 188.1 | 228.0 | 228.7 | 228.6 | 228.8 | 29.1 | 28.5 | 28.3 | 28.5 |
| 79 | bars | 80.4 | 82.1 | 82.8 | 82.3 | 150.3 | 152.5 | 153.3 | 152.7 | 33.4 | 32.5 | 32.2 | 32.5 |
| 126 | Exposed face | 137.0 | 138.3 | 138.7 | 138.4 | 192.0 | 193.4 | 193.9 | 193.5 | 32 | 31.2 | 30.9 | 31.2 |
| 239 | Centre-section | 22.2 | 22.6 | 22.8 | 22.7 | 51.1 | 54.1 | 55.1 | 54.3 | 39.6 | 38.3 | 37.8 | 38.3 |
| 27 | Fiber in corner | 145.6 | 147.5 | 146.1 | 147.6 | 208.8 | 210.1 | 209.4 | 210.2 | 29.7 | 49.4 | 29.7 | |
| 20 | Fiber in face | 108.7 | 110.4 | 109.7 | 110.5 | 172.7 | 174.7 | 174.2 | 174.8 | 31.9 | 31.6 | 31.9 | |
| 118 | Fiber in center | 48.1 | 49.9 | 50.5 | 50.0 | 105.0 | 107.2 | 108.0 | 168.8 | 34.8 | 34.4 | 34.8 | |
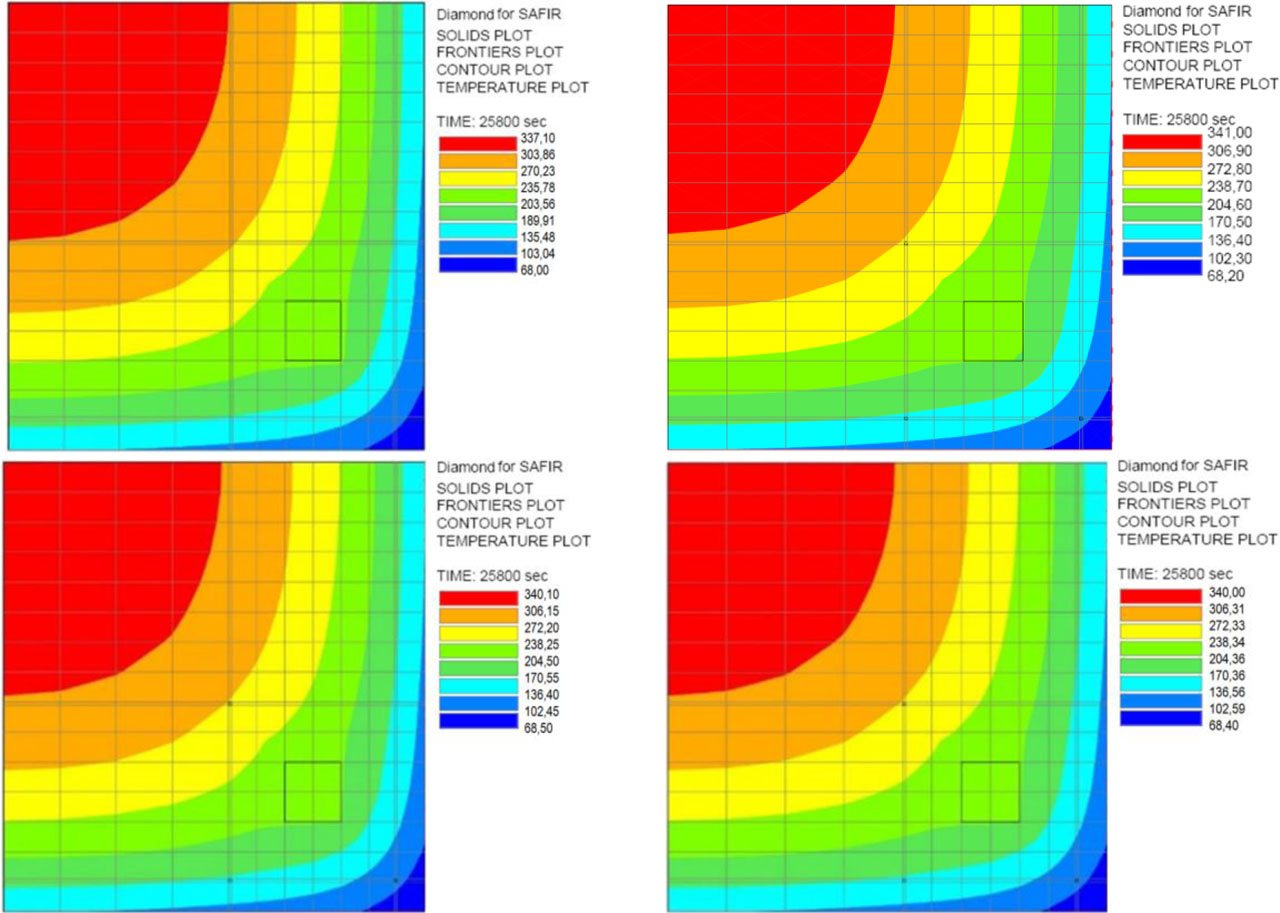
Figure 4:
Evolution of Temperature Distribution During Cooling Phase
Table 3:
Temperature distribution at selected points in the column section at 450°C
| Max T [°C] after 60 min (End of warm-up phase) | Max T [°C] after 120 min (End of stabilization phase) | Max T [°C] after 940 min (End of cooling phase) phase) | |||||||||||
|---|---|---|---|---|---|---|---|---|---|---|---|---|---|
| HPC FS | HPC PFS | HPC DPFS | HPC PFSQS | HPC FS | HPC PFS | HPC DPFS | HPC PFSQS | HPC FS | HPC PFS | HPC DPFS | HPC PFSQS | ||
| 14 | Corner | 395.4 | 397.4 | 398.0 | 397.4 | 438.3 | 438.8 | 439.0 | 438.8 | 35.5 | 34.5 | 34.2 | 34.5 |
| 79 | bars | 128.9 | 132.1 | 133.2 | 132.1 | 295.0 | 299.4 | 300.9 | 299.4 | 45 | 43.4 | 42.9 | 43.4 |
| 126 | Exposed face | 291.8 | 294.9 | 295.9 | 294.9 | 392.9 | 394.8 | 395.5 | 394.8 | 41.7 | 40.3 | 39.9 | 40.3 |
| 239 | Centre-section | 24.2 | 25.1 | 25.4 | 25.1 | 73.1 | 77.4 | 78.9 | 77.4 | 58.7 | 56.2 | 55.4 | 56.2 |
| 27 | Fiber in corner | - | 308.5 | 309.7 | 308.5 | - | 410.3 | 410.8 | 410.3 | 37.1 | 36.7 | 37.1 | |
| 20 | Fiber in face | - | 215.1 | 216.3 | 215.1 | - | 352.7 | 353.8 | 352.7 | 42 | 41.5 | 42 | |
| 118 | Fiber in center | - | 72.6 | 73.4 | 72.6 | - | 193.9 | 195.8 | 193.9 | 48.5 | 47.9 | 48.5 | |
Table 4:
Temperature distribution at selected points in the column section at 650°C
| Max T [°C] after 60 min (End of warm-up phase) | Max T [°C] after 120 min (End of stabilization phase) | Max T [°C] after 940 min (End of cooling phase) phase) | |||||||||||
|---|---|---|---|---|---|---|---|---|---|---|---|---|---|
| HPC FS | HPC PFS | HPC DPFS | HPC PFSQS | HPC FS | HPC PFS | HPC DPFS | HPC PFSQS | HPC FS | HPC PFS | HPC DPFS | HPC PFSQS | ||
| 14 | Corner | 623.2 | 624.5 | 624.8 | 624.6 | 645.7 | 646.0 | 646.0 | 646.0 | 52 | 50.4 | 49.9 | 50.4 |
| 79 | bars | 197.7 | 203.4 | 205.3 | 203.8 | 566.9 | 444.1 | 446.1 | 444.5 | 79.1 | 76.3 | 75.3 | 76.3 |
| 126 | Exposed face | 512.6 | 516.4 | 517.7 | 516.7 | 608.3 | 609.8 | 610.3 | 609.9 | 68.9 | 66.5 | 95.4 | 66.5 |
| 239 | Centre section | 26.2 | 27.4 | 27.8 | 27.5 | 90.9 | 95.3 | 96.6 | 95.6 | 120.3 | 115.2 | 113.5 | 115.2 |
| 27 | fiber in corner | - | 493.3 | 494.7 | 493.7 | - | 612.2 | 612.6 | 612.3 | 57.8 | 57.2 | 57.8 | |
| 20 | fiber in face | - | 358.6 | 360.5 | 359.1 | - | 537.8 | 538.9 | 538.1 | 71.5 | 70.7 | 71.5 | |
| 118 | fiber in center | - | 93.6 | 94.6 | 93.8 | - | 285.4 | 288.2 | 286.1 | 91.5 | 90.2 | 91.5 | |
2.5.4. Simulation Process
The material model used in the simulation must accurately represent the behavior of the structure under combined thermal and mechanical loading. The structural response is highly dependent on the load path, meaning that deformations can vary significantly, sometimes even exhibiting opposite trends for the same combination of stress and temperature. Axial thermal expansion is particularly influenced by mechanical stress during the heating phase, which suggests that thermal deformation is not solely a function of temperature but also depends on the stress state applied during heating. The selected models are designed to account for this phenomenon by incorporating transient creep deformation, either implicitly or explicitly.
All simulations were performed using the SAFIR software, employing the thermal and mechanical models defined in Eurocode 2 (2005) and Eurocode 4 (2005). The temperature distribution across the different column sections was obtained through a nonlinear transient 2D analysis. Each column under study was initially subjected to a constant load, after which the column section was exposed to natural fire, encompassing both the heating and cooling phases, to evaluate its residual characteristics. The load was applied in a decreasing, monotonic manner, and the failure time was determined for each load level. This process continued until no further failure was observed, with the final load level representing the column's load-bearing capacity under natural fire conditions.
Figure 5 illustrates the simulation approach applied to columns exposed to natural fire. For example, a load of 1000 kN is applied to the column, followed by natural fire exposure with a heating phase lasting 60 minutes. The compartment temperature returns to ambient 440 minutes after the start of the fire, with cooling continuing until the section temperature stabilizes at ambient levels.
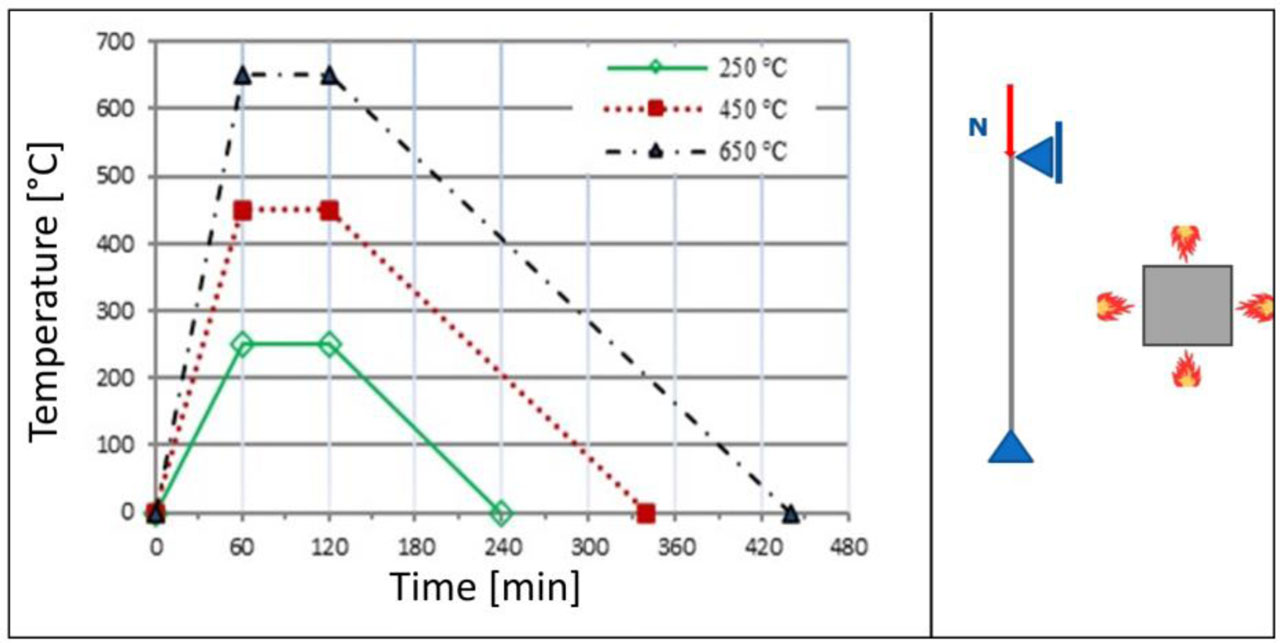
Figure 5:
Evolution of the load and applied temperature
2.6. Parametric Analysis for Evaluating Vertical Load-bearing Capacity (Nr)
2.6.1. Evolution of Nr as a Function of Temperature
Figure 6 summarizes the analytical approach applied to the reference column, which has a cross-section of 30×30 cm2 and a height of 3 m, and is exposed to natural fire scenarios with maximum temperatures of 250°C, 450°C, and 650°C. The analysis begins by determining the column’s initial load-bearing capacity at time t = 0, denoted as N20 (cold capacity). The applied load is then gradually reduced, and multiple simulations are performed to determine the fire resistance time. Based on the computed fire resistance time, failure is tracked throughout the different fire phases. The relationship between the applied load and fire resistance time highlights the evolution of the column’s load-bearing capacity. As observed, the load-bearing capacity continues to decrease even after the gas temperature inside the compartment reaches its peak. The residual load-bearing capacity of the column, denoted as Nr, corresponds to the load beyond which no further failure occurs, identified by a horizontal asymptote on the curve. In Figure 6 (b), the residual load value is determined from the horizontal asymptote shown in Figure 6 (a). The load ratio Nr/N20 is evaluated for each fire scenario once the temperatures within the column section return to ambient levels. The values on the horizontal axis represent the maximum gas temperature for each fire scenario.
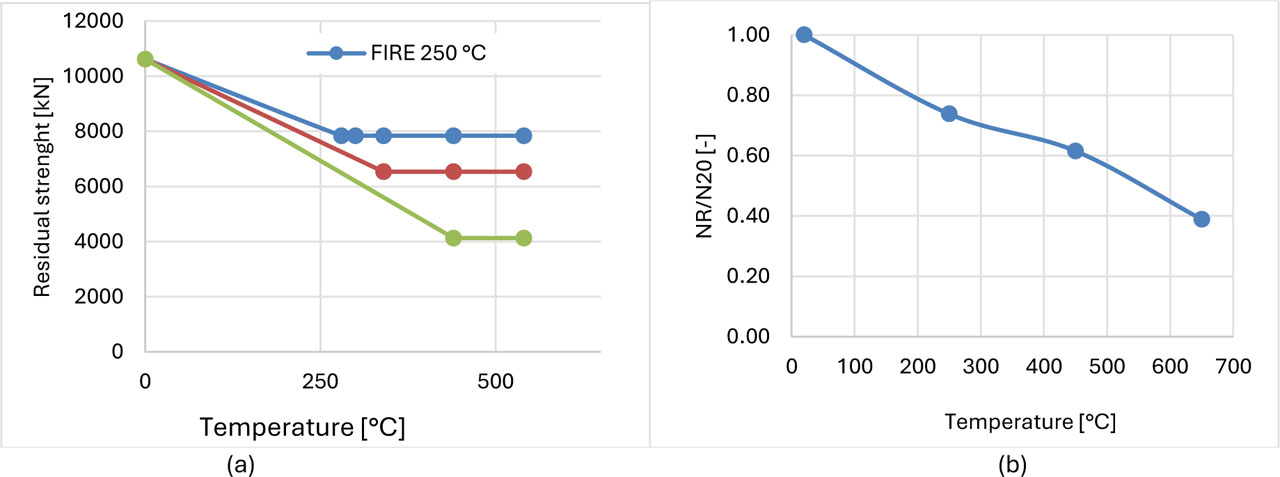
Figure 6:
Evolution [Nr] of the column as a function of temperature
2.6.2. Influence of the Effective Height on Residual Load-bearing Capacity (Nr)
The influence of column height on the residual load-bearing capacity Nr was analyzed for columns with heights of 3 m, 4 m, and 5 m, while maintaining a constant cross-section of 30×30 cm2. The results are presented in Table 5 and Figure 7, which illustrate the ratio of the load-bearing capacity for columns of varying heights (Nh/Nref) relative to the reference column (Nref) for columns exposed to a natural fire scenario with a maximum temperature of 650°C.
As shown in Table 5, the cold load-bearing capacity N20 at ambient temperature decreases as column height increases due to buckling effects. The 5 m column, with a cold load-bearing capacity of 9436.88 kN, exhibited a 12 % reduction compared to the 3 m column, which had a capacity of 10621.88 kN. Similarly, the 4 m column showed a 3 % reduction, with a capacity of 10336.88 kN. Figure 7 illustrates the influence of height-induced instability on the cold load-bearing capacity.
The residual load-bearing capacity Nr was further analyzed for columns exposed to fire scenarios at 250°C, 450°C, and 650°C. The results indicate a nonlinear decrease in residual strength as column height increases. At 250°C, the residual strength ratio Nr/N20 was 74 % for the 3 m column, 73 % for the 4 m column, and 72 % for the 5 m column. At 450°C, these values dropped to 62 %, 60 %, and 56 %, respectively. At 650°C, the residual strength ratios were 39 % for the 3 m column, 33 % for the 4 m column, and 31 % for the 5 m column.
The analysis confirms that increasing column height significantly reduces residual load-bearing capacity, primarily due to buckling effects. These findings emphasize the need to account for height and thermal exposure in the design of columns to ensure structural integrity during and after fire events.
Table 5:
Evolution of bearing capacity as a function of column height [m] and Temperature [°C]
| H | 3m | 4m | 5m | |||
|---|---|---|---|---|---|---|
| Nr | N20 | Nr/N20 | N20 | Nr/N20 | N20 | Nr/N20 |
| N20 | 10621.88 | 1.00 | 10336.88 | 1.00 | 9436.88 | 1.00 |
| N250 | 7840.00 | 0.74 | 7560.50 | 0.73 | 6780.50 | 0.72 |
| N450 | 6535.00 | 0.62 | 6160.00 | 0.60 | 5315.00 | 0.56 |
| N650 | 4130.00 | 0.39 | 3450.00 | 0.33 | 2885.00 | 0.31 |
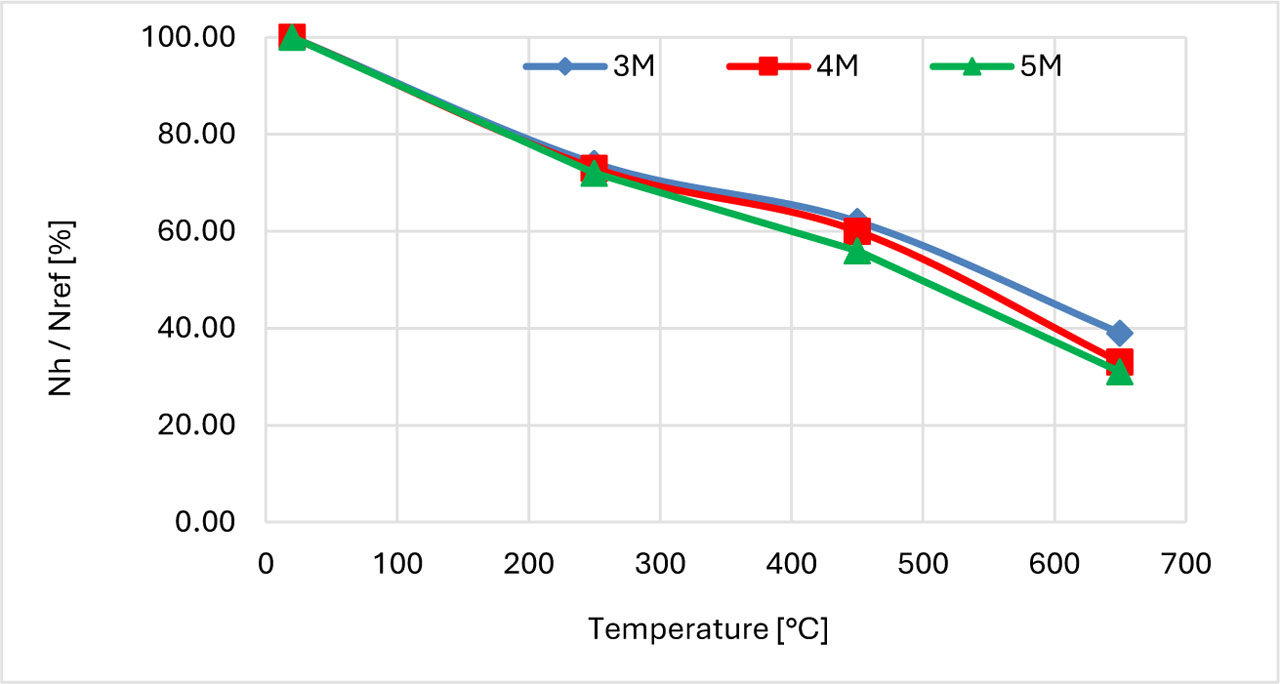
Figure 7:
Influence of Column Height on Residual Load-Bearing Capacity [Nr]
2.6.3. Influence of Column section dimensions on residual Load-bearing capacity (Nr)
The influence of column section dimensions on residual strength (Nr) was analyzed for columns with a height of 3.00 m, considering cross-sections of 30 × 30 cm2 and 40 × 40 cm2, exposed to fire scenarios with maximum temperatures of 250°C, 450 °C, and 650°C. The results are presented in Table 6 and Figure 8.
As shown in Table 6, the residual load-bearing capacity (Nr) for the 40 × 40 cm2 column was consistently higher than that of the 30 × 30 cm2 column. At 20 °C, the load-bearing capacity increased by approximately 76 % for the larger section. At 250°C, the residual strength ratio (Nr/N20) was 74 % for the 30 × 30 cm2 section and 76 % for the 40 × 40 cm2 section. Similarly, at 450°C, these values dropped to 62 % and 65 %, while at 650°C, they further decreased to 39 % and 49 %, highlighting the influence of section size on thermal performance.
Figure 8 illustrates the evolution of the residual strength ratio (Nr/N20) as a function of fire temperature for both column sections. At 250°C, the relative strength of the 30 × 30 cm2 column was approximately 0.74 compared to 0.76 for the 40 × 40 cm2 section. At 450 °C, these values were 0.62 and 0.65, respectively, while at 650°C, they reduced to 0.39 and 0.49. These results indicate that increasing the section size improves the residual strength of the column, thereby enhancing its fire resistance. The analyses confirm that increasing the cross-sectional dimensions of a column significantly enhances its residual strength under fire exposure. These findings emphasize the importance of section size in maintaining structural integrity and post-fire serviceability.
Table 6:
Evolution of bearing capacity as a function of column section dimensions
| H | 30×30 [cm2] | 40×40 [cm2] | ||
|---|---|---|---|---|
| Nr | N20 | Nr/N20 | N20 | Nr/N20 |
| N20 | 10621.88 | 1.00 | 18751.88 | 1.00 |
| N250 | 7840.00 | 0.74 | 14190.00 | 0.76 |
| N450 | 6535.00 | 0.62 | 12125.00 | 0.65 |
| N650 | 4130.00 | 0.39 | 9200.00 | 0.49 |
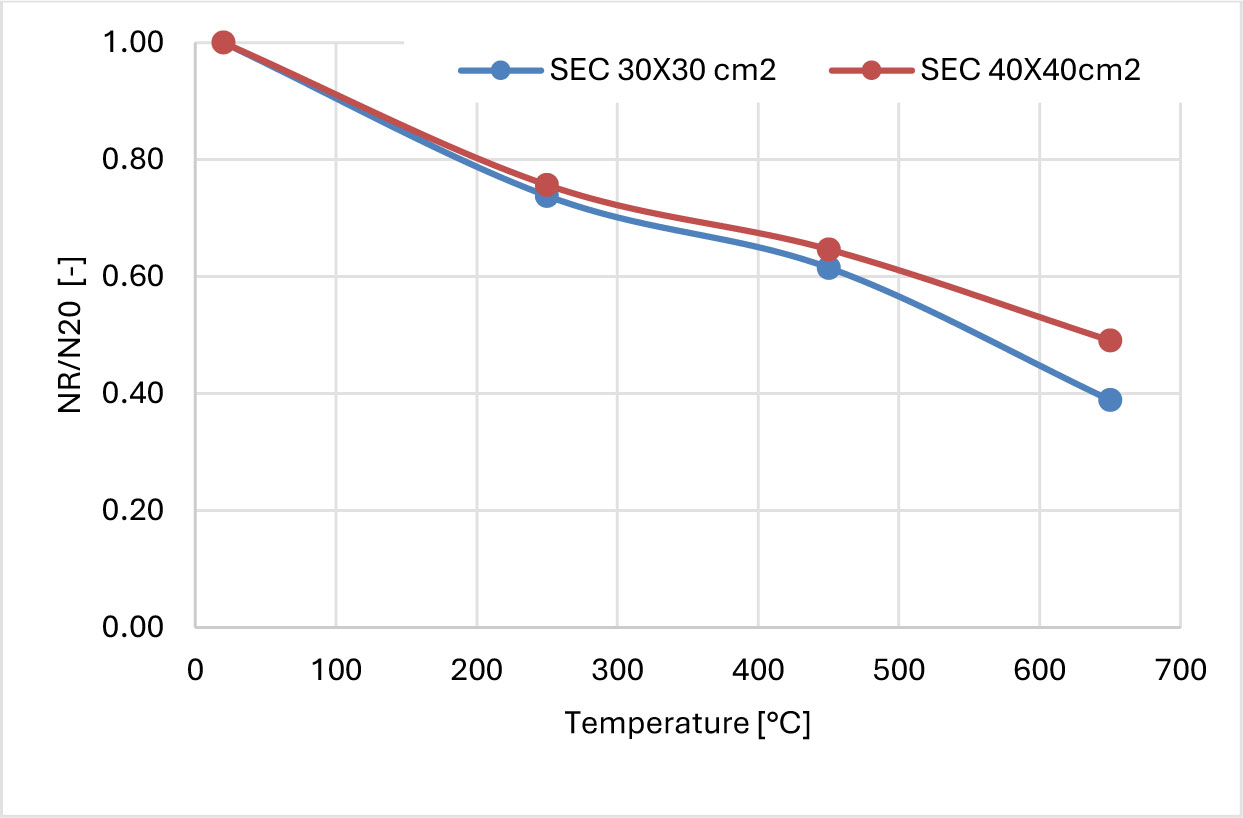
Figure 8:
Evolution of [Nr/N20] as a function of column section and temperature
2.6.4. Influence of Support Conditions on Load-bearing Capacity (Nr)
The effect of support conditions on the residual strength of columns under elevated temperatures was analyzed using two configurations, with results summarized in Figure 9 and Table 7. In the first configuration, columns with double support at the base and single support at the top (SS-DS) exhibited a significant reduction in residual strength as the temperature increased. At 20°C, the residual strength was at its maximum (N20) but progressively declined to 74 % at 250°C, 62 % at 450°C, and 39 % at 650 °C. This trend confirms the substantial negative impact of high temperatures on the structural performance of columns.
As shown in Table 7, these results indicate that under these support conditions, the columns become nonfunctional beyond 650 °C. In the second configuration, columns with triple support at the base and single support at the top (SS-TS) demonstrated slightly higher residual strength compared to the first configuration, although the general decreasing trend with increasing temperature remained. At 20°C, the residual strength was marginally higher and decreased to 74 % at 250°C, 62 % at 450°C, and 41 % at 650°C. These results, detailed in Table 7, highlight the influence of support conditions on the ability of columns to retain their residual strength after thermal exposure.
As shown in Figure 9, the relationship between residual strength and temperature demonstrates that support conditions significantly affect the columns' load-bearing capacity under thermal stress. However, regardless of the configuration, columns lose their structural functionality after prolonged exposure to temperatures exceeding 650 °C.
This underscores the importance of accounting for thermal effects and support conditions in the structural design of columns subjected to fire scenarios.
Table 7:
Evolution of bearing capacity as a function of support conditions
| Double support and single support | Triple support and single support | |||
|---|---|---|---|---|
| Nr | N20 | Nr/N20 | N20 | Nr/N20 |
| N20 | 10621.88 | 1.00 | 10833.75 | 1.00 |
| N250 | 7840.00 | 0.74 | 8040.00 | 0.74 |
| N450 | 6535.00 | 0.62 | 6725.00 | 0.62 |
| N650 | 4130.00 | 0.39 | 4460.00 | 0.41 |
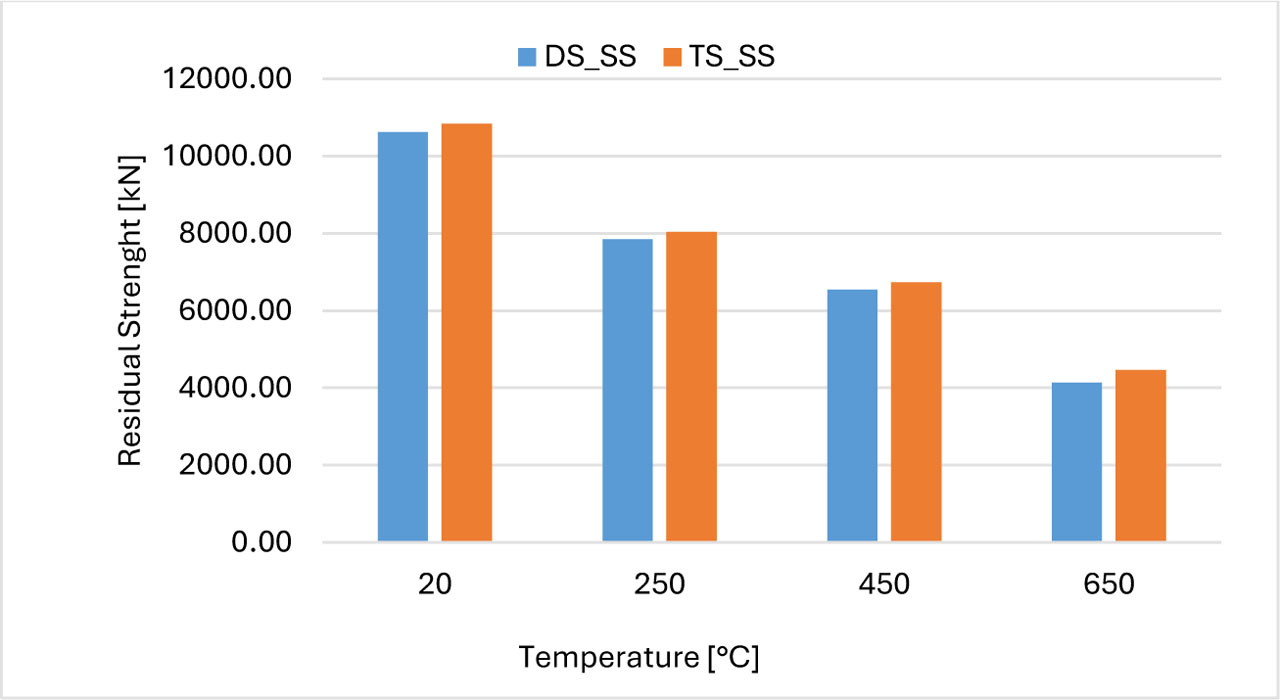
Figure 9:
Evolution of bearing capacity as a function of support conditions
2.7. The influence of Different Concrete mix types on the Residual Strength (Nr)
The influence of different high-performance concrete (HPC) mix types on the residual strength Nr was analyzed for columns exposed to elevated temperatures. Three types of HPC mixes were evaluated:
HPC with silica fume (HPCFS)
HPC with silica fume and polypropylene fibers (HPCPFS)
HPC with silica fume and date palm fibers (HPCDPFS)
The results are presented in Table 8 and Figure 10, which illustrate the residual load-bearing capacity Nr for each mix type at ambient temperature (20 °C) and after exposure to fire scenarios at 250°C, 450°C, and 650°C. As shown in Table 8, the cold load-bearing capacity N20 at ambient temperature varied across the mix types. The HPCFS mix exhibited the highest load-bearing capacity (N20=10621.88 kN), followed by HPCPFS (N20=9965.5 kN) and HPCDPFS (N20=8791.87 kN). These results indicate that the addition of fibers, particularly date palm fibers, reduced the initial load-bearing capacity compared to the silica fume-only mix. The residual load-bearing capacity Nr was further analyzed for each mix type at elevated temperatures. At 250°C, the residual strength ratio Nr/N20 was 74 % for HPCFS, 75 % for HPCPFS, and 77 % for HPCDPFS. At 450 °C, these values dropped to 62 %, 61 %, and 71 %, respectively. At 650°C, the residual strengths were 39 % for HPCFS, 39 % for HPCPFS, and 57 % for HPCDPFS. The results demonstrate that the addition of polypropylene fibers (HPCPFS) had a marginal effect on residual strength compared to the silica fume-only mix (HPCFS). However, the inclusion of date palm fibers (HPCDPFS) significantly improved the residual strength at higher temperatures, particularly at 650°C, where it retained 57 % of its load-bearing capacity compared to 39 % for the other mixes. These findings highlight the role of fiber type and composition in enhancing the fire resistance of high-performance concrete. The use of date palm fibers, in particular, shows potential for improving structural integrity under fire conditions.
Table 8:
Effect of concrete mix types on residual strength
| HPCFS | HPCPFS | HPCDPFS | ||||
|---|---|---|---|---|---|---|
| N20 [kN] | Nr/N20 [-] | N20 [kN] | Nr/N20 [-] | N20 [kN] | Nr/N20 [-] | |
| N20 [°C] | 10621.88 | 1.00 | 9965.5 | 1.00 | 8791.87 | 1.00 |
| N250 [°C] | 7840 | 0.74 | 7448 | 0.75 | 6750 | 0.77 |
| N450 [°C] | 6535 | 0.62 | 6115 | 0.61 | 6227 | 0.71 |
| N650 [°C] | 4130 | 0.39 | 3840 | 0.39 | 5040 | 0.57 |
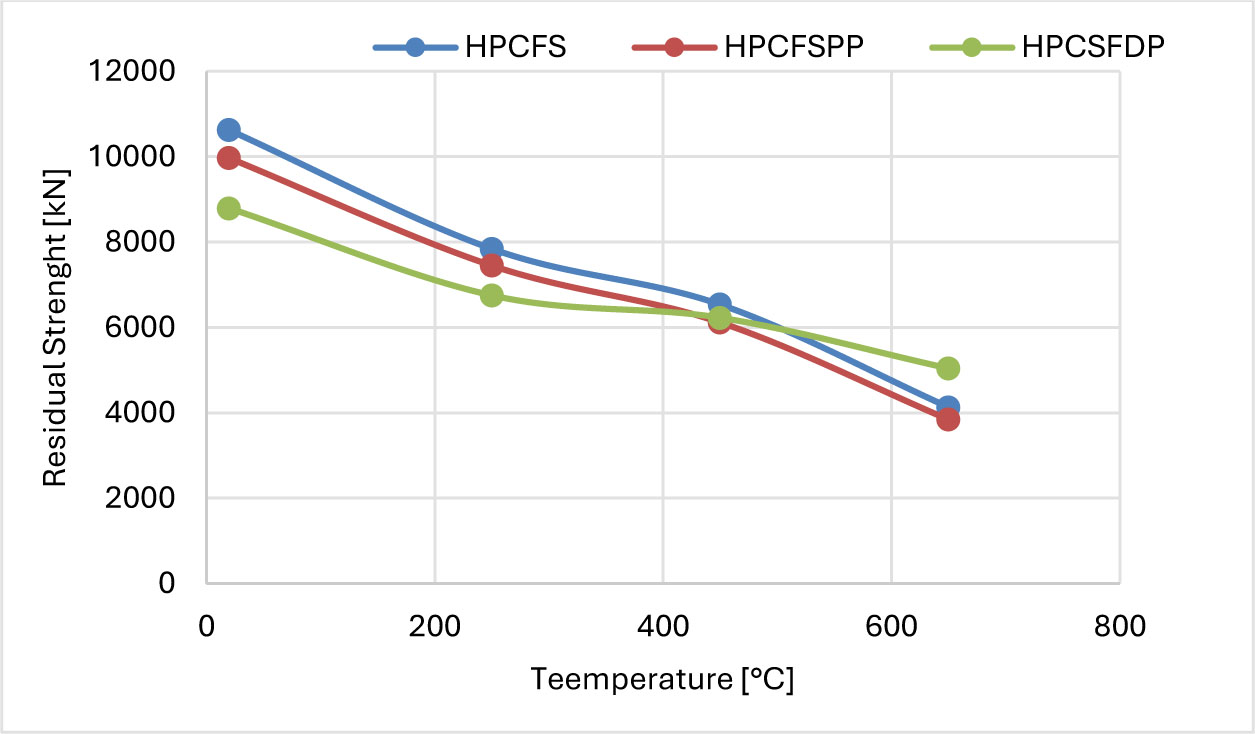
Figure 10:
Variation of Bearing Capacity for Different Concrete Mixes
3. Results and Discussion
This section presents the key findings of the study, focusing on the thermal and mechanical behavior of reinforced concrete columns subjected to natural fire scenarios. The discussion highlights the influence of temperature, column geometry, support conditions, and concrete mix composition on residual load-bearing capacity.
3.1. Temperature Distribution and Thermal Behavior
The numerical simulations revealed that the temperature distribution within the column cross-section is highly dependent on fire intensity, exposure duration, and concrete composition. The core of the section retains heat longer due to thermal inertia, which influences post-fire mechanical performance. Columns with larger cross-sections exhibited lower peak temperatures in the core, indicating better thermal resistance. The presence of fibers, particularly date palm fibers, slightly affected temperature propagation but contributed to improved thermal stability at elevated temperatures.
3.2. Influence of Column Height and Cross-section on Residual Strength
The results confirmed that increasing column height negatively impacts residual load-bearing capacity due to increased susceptibility to buckling. Shorter columns exhibited higher resistance to fire-induced deformations. In contrast, larger cross-sections significantly enhanced post-fire structural integrity, with a higher proportion of load-bearing capacity retained after fire exposure. At 650°C, columns with 40 × 40 cm2 sections retained up to 49 % of their initial strength, compared to only 39 % for 30 × 30 cm2 sections.
3.3. Effect of Support Conditions
Support conditions played a crucial role in determining the columns' ability to withstand fire-induced stresses. Columns with fixed supports exhibited greater resistance to thermal degradation than those with more flexible boundary conditions. However, beyond 650 °C, all support configurations experienced significant reductions in load-bearing capacity, highlighting the limitations of traditional support systems under extreme fire conditions.
3.4. Impact of Concrete Composition on Fire Resistance
The concrete mix design significantly influenced residual strength. The addition of polypropylene fibers had a marginal effect on post-fire behavior, whereas the incorporation of date palm fibers (HPCDPFS) substantially improved residual strength, particularly at high temperatures. At 650°C, columns with HPCDPFS retained 57 % of their initial strength, compared to only 39 % for standard HPC mixes. This enhancement is attributed to the improved crack resistance and thermal stability provided by the fibers.
3.5. Effect of Geometry (Square section)
Square cross-sections were selected in this study because they are among the most common geometries used in reinforced concrete framed structures, where both architectural and structural constraints often favor rectangular or square shapes. Furthermore, most fire design provisions in current structural codes are primarily calibrated for rectangular sections, making this choice highly relevant for practical engineering applications.
Nevertheless, circular cross-sections could offer advantages in fire scenarios, particularly due to the uniformity of the concrete cover around the reinforcement, which may improve thermal protection. Their assessment was beyond the scope of this study but represents a promising direction for future research.
3.6. Validation of Numerical Simulations
The numerical simulations performed using SAFIR software accurately captured the thermo-mechanical behavior of the fire-exposed columns. The predicted temperature distributions and residual strengths aligned well with experimental data from the literature, confirming the reliability of the adopted modeling approach. These results reinforce the applicability of numerical simulations in predicting real fire effects and optimizing structural fire resistance strategies.
4. Conclusion
This study investigated the residual load-bearing capacity of reinforced concrete columns exposed to natural fire scenarios, emphasizing the critical role of both the heating and cooling phases. The findings confirm that fire exposure significantly reduces the structural integrity of columns, with residual strength strongly influenced by fire duration, cooling conditions, column geometry, support constraints, and concrete mix composition.
Parametric analyses demonstrated that increasing column height exacerbates susceptibility to buckling, whereas larger cross-sections enhance both thermal resistance and mechanical performance. The support conditions also play a crucial role, with more rigid configurations offering greater resistance to thermal degradation. However, beyond 650°C, all columns exhibited severe strength loss, underscoring the limitations of conventional structural designs under extreme fire conditions.
Concrete composition emerged as a key factor in fire resistance. The inclusion of fibers, particularly date palm fibers (HPCDPFS), significantly improved post-fire performance by retaining up to 57 % of the initial load-bearing capacity at 650°C, compared to only 39 % for conventional HPC mixes. Despite partial recovery of steel reinforcement properties upon cooling, concrete suffers irreversible damage, particularly under rapid cooling conditions, leading to additional strength losses of up to 33 %.
Numerical simulations conducted using SAFIR software effectively replicated the thermal and mechanical response of fire-exposed columns, reinforcing the reliability of computational models in predicting structural performance under realistic fire scenarios. These findings highlight the necessity of integrating advanced fire resistance strategies in structural design, including optimized material selection and realistic fire exposure modeling, to enhance the durability and safety of reinforced concrete structures in fire-prone environments. Although column-scale experimental validation could not be performed in this study due to technical limitations, the adopted SAFIR models were informed by and compared with our previous experimental research on concrete specimens at elevated temperatures (Hamda et al., 2023; Hamda et al., 2025). The numerical results obtained in this work exhibit similar trends to those observed experimentally, supporting the reliability of the simulation approach. Ongoing work in our laboratory aims to extend this validation to reinforced concrete columns on a real scale.
The findings provide guidance for fire design and assessment practice. They emphasize the importance of adequate concrete cover, reinforcement detailing, and column geometry in delaying reinforcement heating and preserving load-bearing capacity. The positive influence of fiber-reinforced concretes (e.g., HPCDPFS) highlights the potential for innovative material specifications in fire-resistant design. Moreover, the validated numerical approach demonstrates that SAFIR can support performance-based fire design and post-fire assessment, where residual capacity should be evaluated numerically rather than relying solely on visual inspection. These results also suggest that future updates to design provisions could integrate residual capacity assessment methods, enabling safer and more economical decisions regarding the repair, strengthening, or demolition of fire-damaged RC structures.
Abbreviations:
- HPC:
High-performance concrete
- HPCFS:
High-performance concrete with silica fume and without fibers
- HPCPFS:
High-performance concrete with Silica fume included the addition of polypropylene fibers.
- HPCDPFS:
High-performance concrete with Silica fume included the addition of Date Palm fibers.
- HPCPFSQS:
High-performance concrete with Silica fume and polypropylene fibers based on quarry sand.
Notes
[1] Declaration of Competing Interests
The authors declare that they have no known competing financial interests or personal relationships that could have influenced the work reported in this paper.
[3] Contributed by Authorship Contribution Statement
H.M.: Investigation, laboratory testing, analysis, and validation. G.C.: Conceptualization, writing, formal analysis, and validation. B.M. and B.A.A.: Supervision, review, and editing. All authors have read and approved the final version of the manuscript.