

Table 1:
Sample details.
| Beam designation | Width (mm) | Length (mm) | Thickness (mm) | Location of notch | Direction | B/t |
|---|---|---|---|---|---|---|
| Control-2.7 | 150 | 1500 | 2.7 | - | - | 55.56 |
| Control- 4.7 | - | - | 4.7 | - | - | 31.9 |
| Hollow-2.7 | - | - | 2.7 | - | - | 55.56 |
| Hollow-4.7 | - | - | 4.7 | - | - | 31.9 |
| STV-2.7 | - | - | 2.7 | top | vertical | 55.56 |
| STV-4.7 | - | - | 4.7 | top | vertical | 31.9 |
| STH-2.7 | - | - | 2.7 | top | horizontal | 55.56 |
| STH-4.7 | - | - | 4.7 | top | horizontal | 31.9 |
| SBV-2.7 | - | - | 2.7 | bottom | vertical | 55.56 |
| SBV-4.7 | - | - | 4.7 | bottom | vertical | 31.9 |
| SBH-2.7 | - | - | 2.7 | bottom | horizontal | 55.56 |
| SBH-4.7 | - | - | 4.7 | bottom | horizontal | 31.9 |
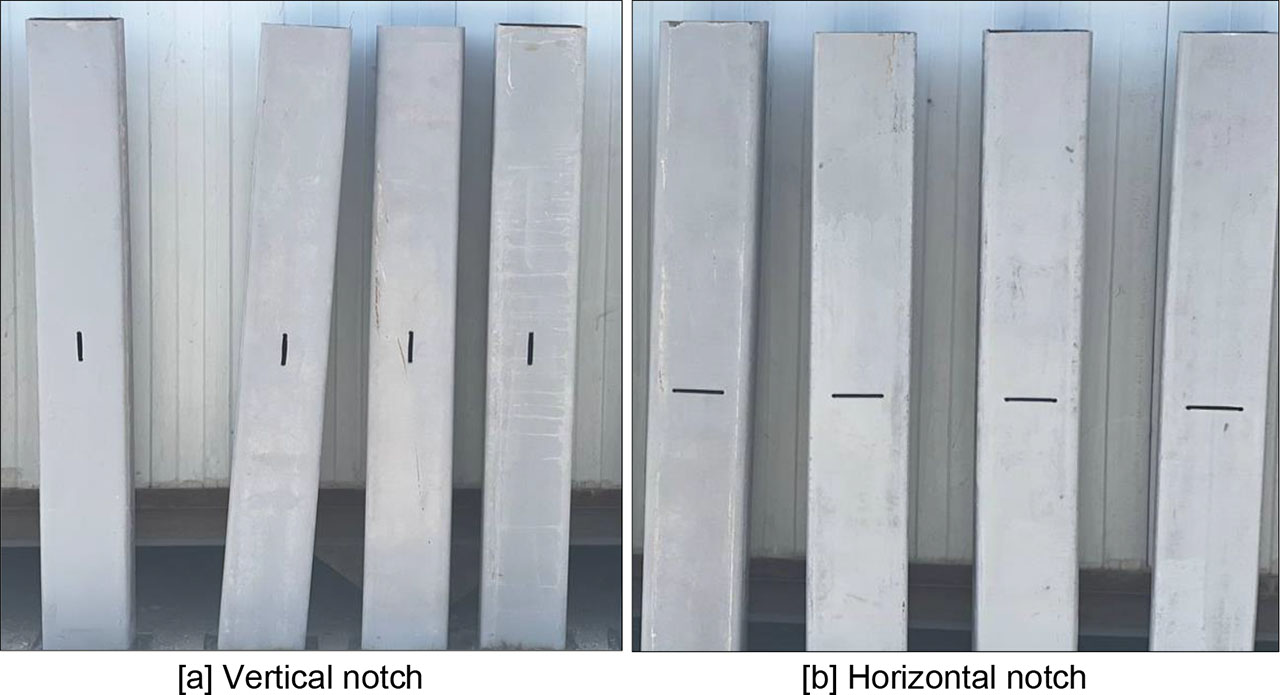
Fig. 1:
Vertically and Horizontally Oriented Notches.
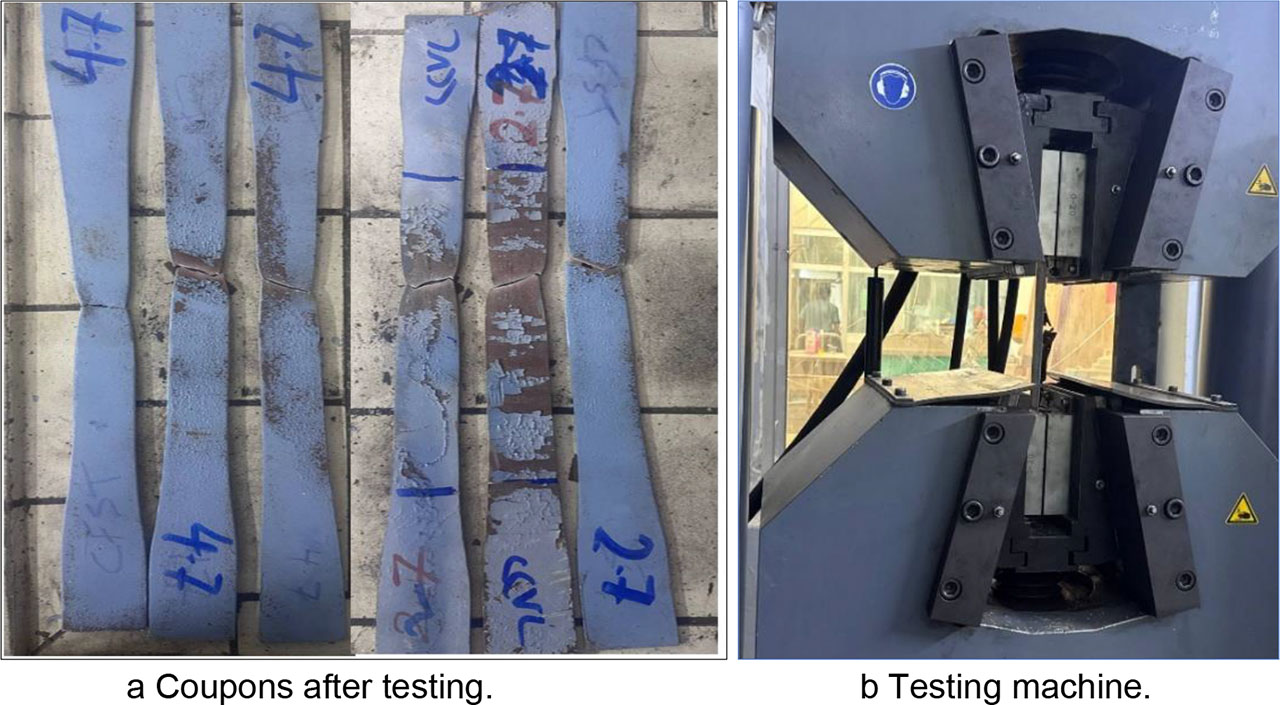
Fig. 2:
Tensile strength test of steel coupons.
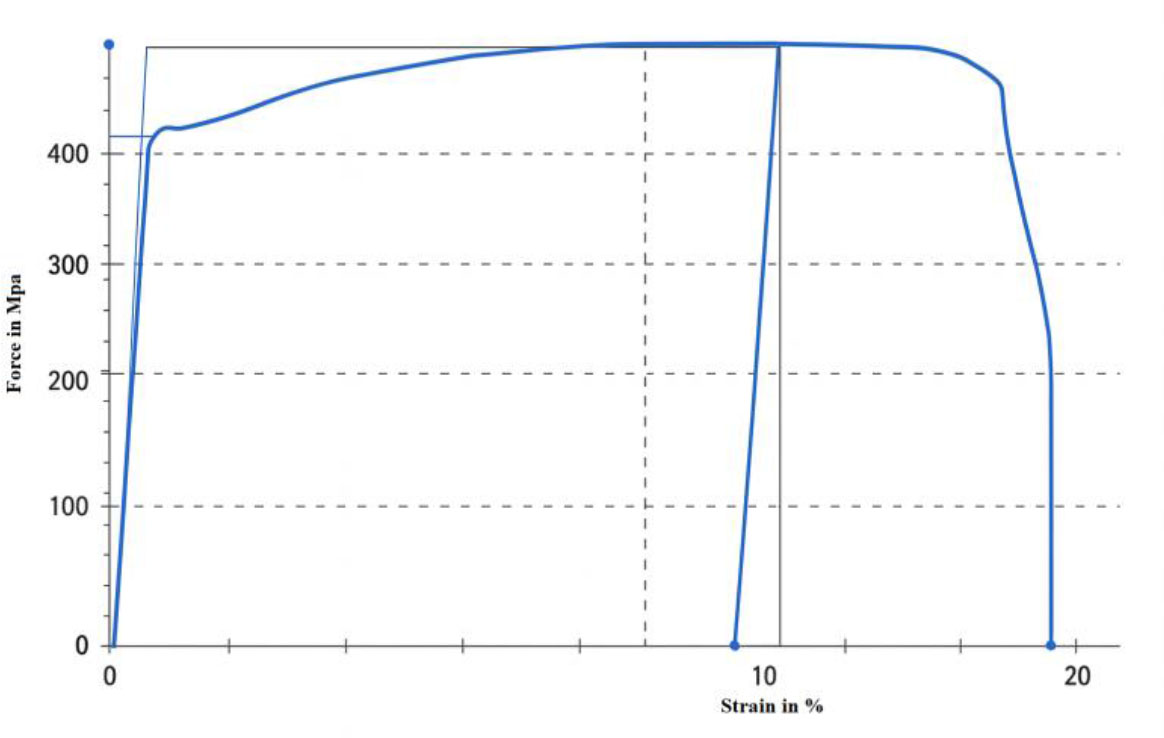
Fig. 3:
Stress-strain curve behaviour and tensile properties of steel tubes.
Table 3:
Results of mechanical properties.
| Specimens | fcu(MPa) exp. | fc′(MPa) exp. | ft (MPa) | Ec (GPa) | fr (MPa) | |||
|---|---|---|---|---|---|---|---|---|
| Exp. | ASTM C496M-17 | Exp. | ASTM C469M-22 | Exp. | ASTM C78M-22 | |||
| Cubes | 42.1 | - | - | - | - | - | - | - |
| Cylinders | - | 34.1 | 3 | 3.1 | 30.4 | 27.4 | - | - |
| Prisms | - | - | - | - | - | - | 4.1 | 3.6 |
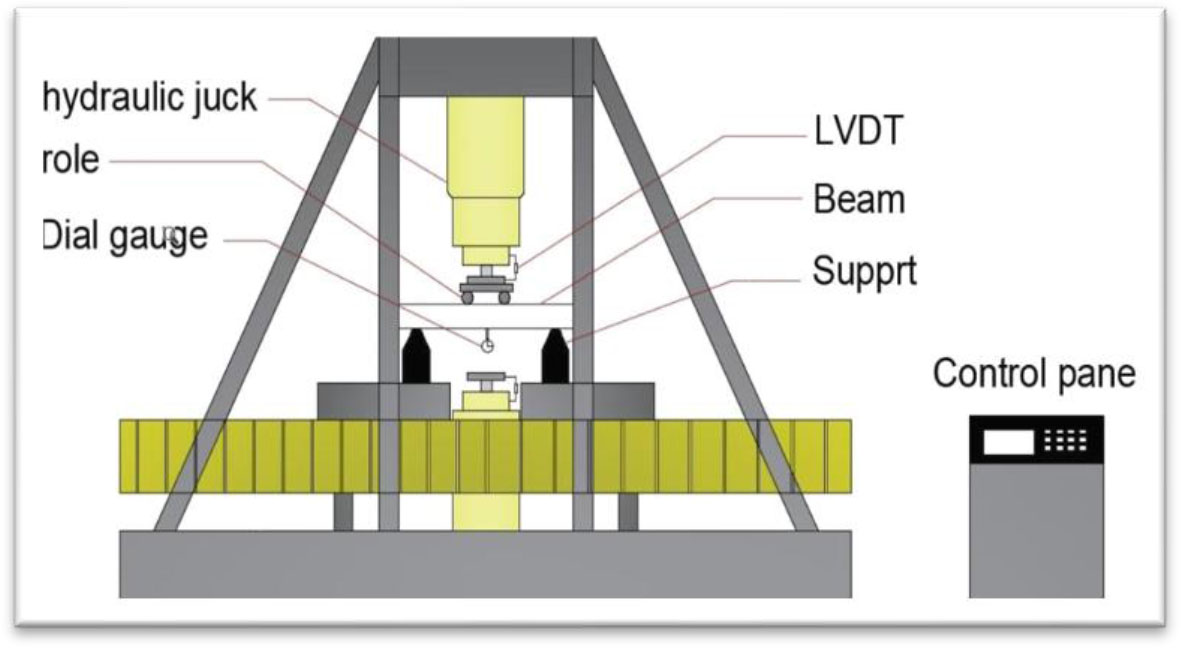
Fig. 4a:
Hydraulic testing machine.
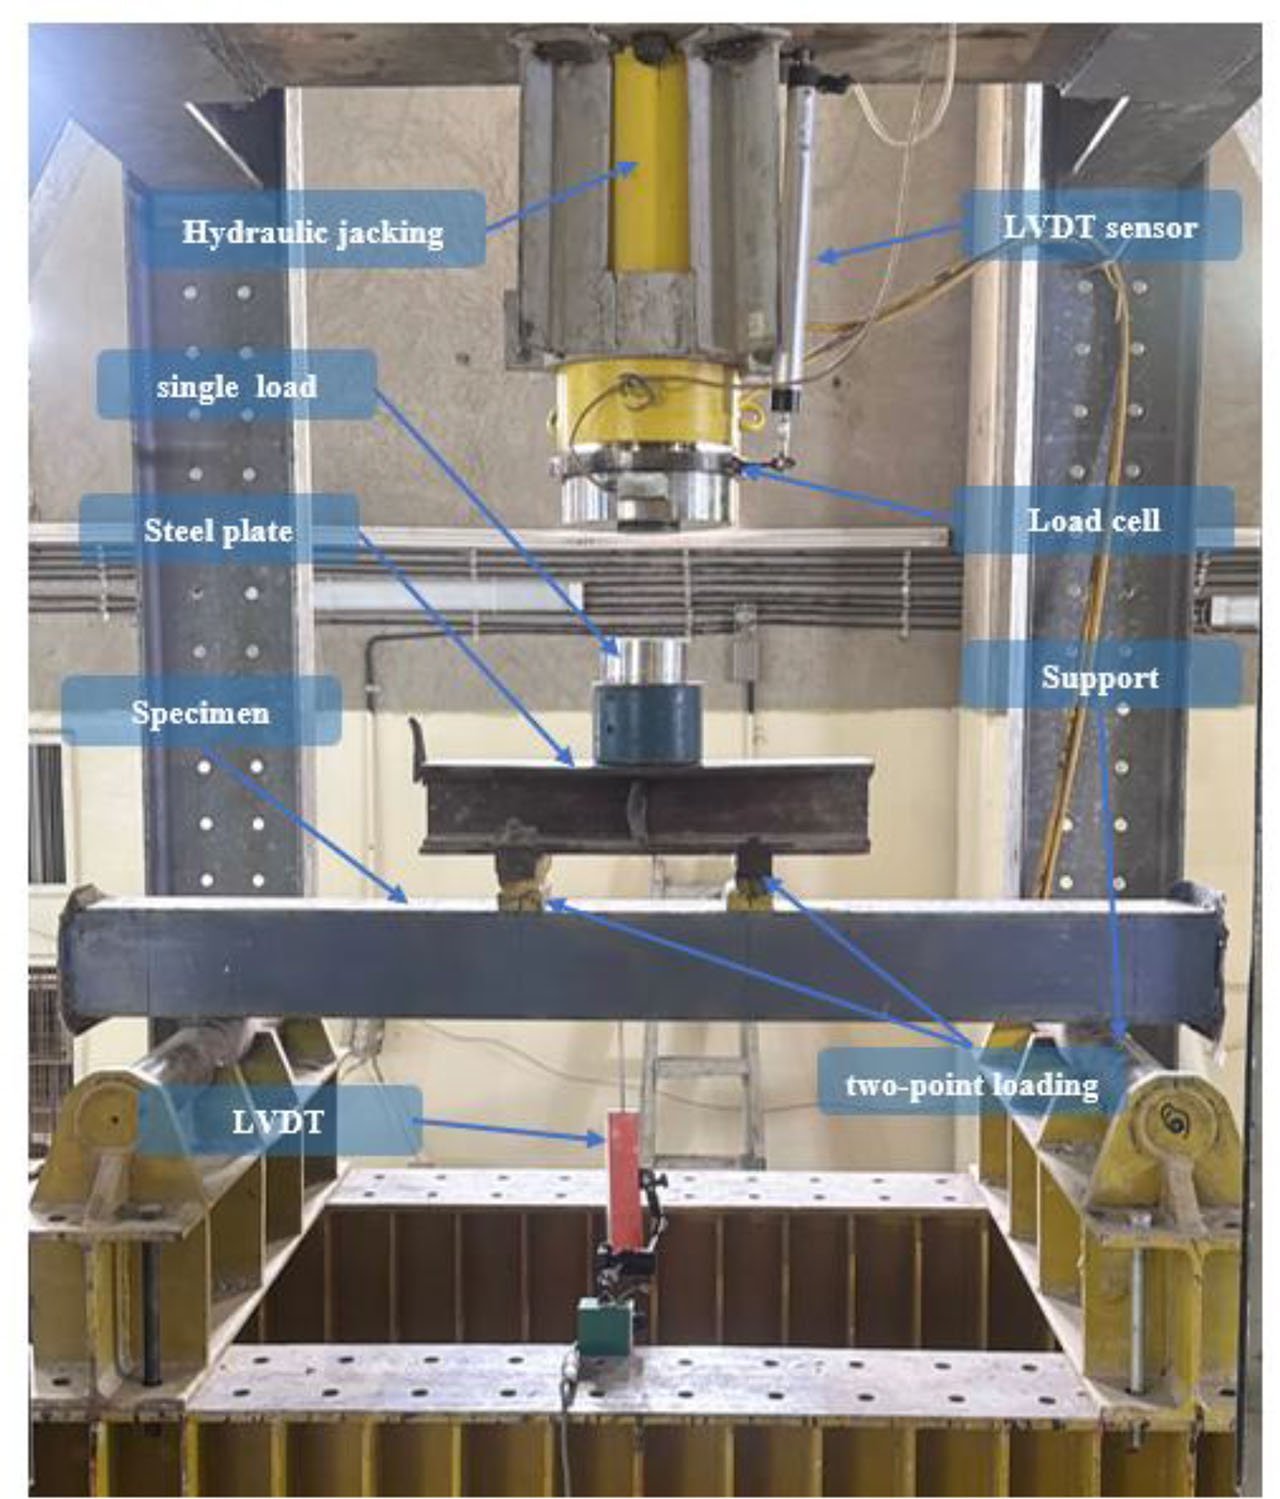
Fig. 4b:
Test setup for beam specimen.
Table 4:
Summary of the experimental results.
| Beam designation | Ultimate load pu (kN) | Ultimate Deflection du (mm) | % decrease in Ultimate Load | % Decrease in Ultimate Deflection |
|---|---|---|---|---|
| Hollow-2.7 | 45.3 | 9.5 | 72.71 | 77.38 |
| Hollow-4.7 | 154 | 16.3 | 49.84 | 71.40 |
| Control-2.7 | 166 | 42 | - | - |
| Control- 4.7 | 307 | 57 | - | - |
| STV-2.7 | 156 | 13 | 6.02 | 69.05 |
| STV-4.7 | 276 | 31 | 45.61 | 45.61 |
| STH-2.7 | 159 | 33 | 4.22 | 21.43 |
| STH-4.7 | 290 | 52 | 5.54 | 8.77 |
| SBV-2.7 | 153 | 13 | 7.83 | 69.05 |
| SBV-4.7 | 296 | 34 | 3.58 | 40.35 |
| SBH-2.7 | 116 | 10 | 30.12 | 76.19 |
| SBH-4.7 | 233 | 20 | 24.10 | 64.91 |
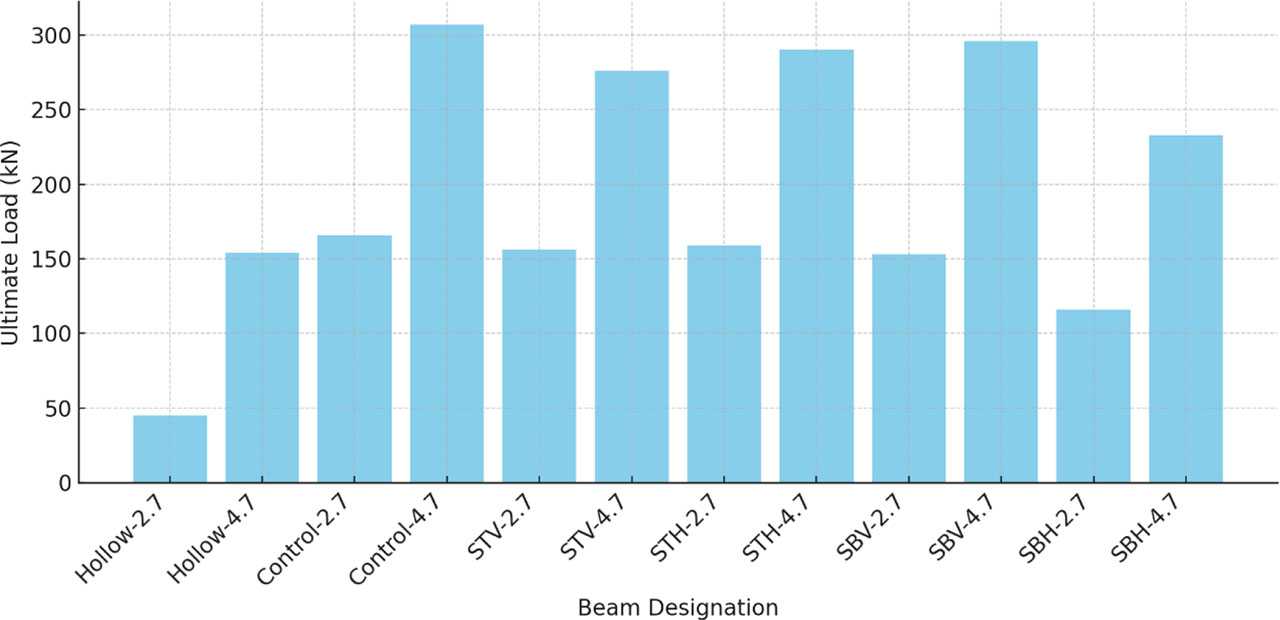
Fig. 5:
Ultimate load.
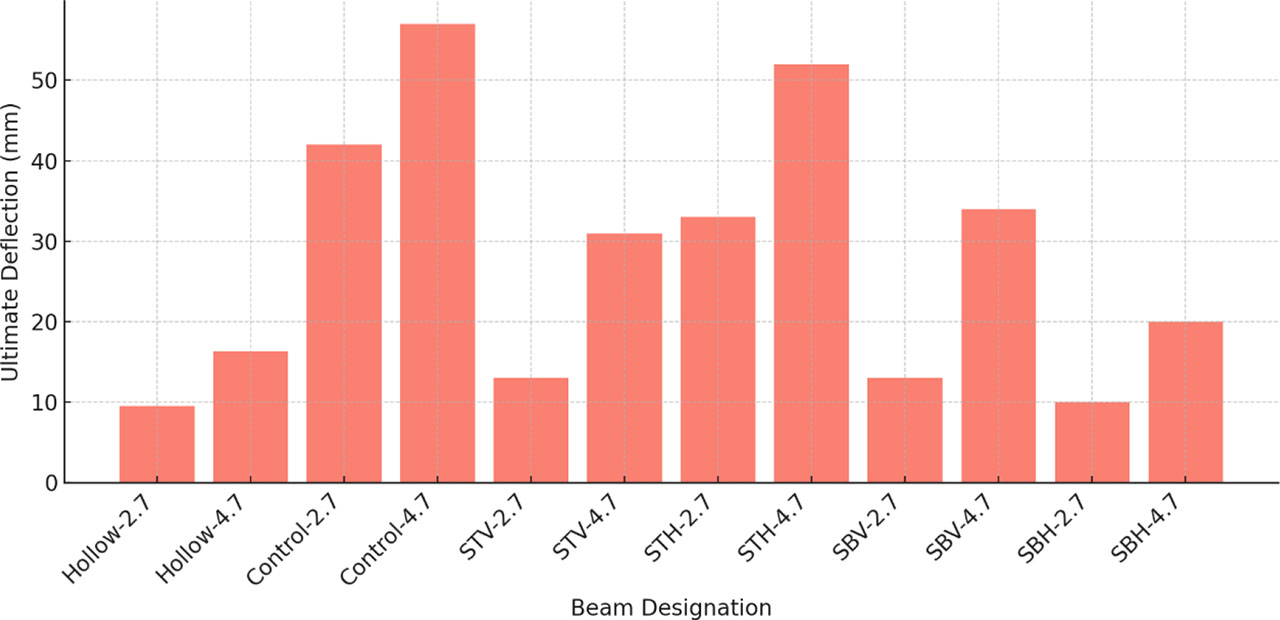
Fig. 6:
Ultimate deflection at ultimate load.
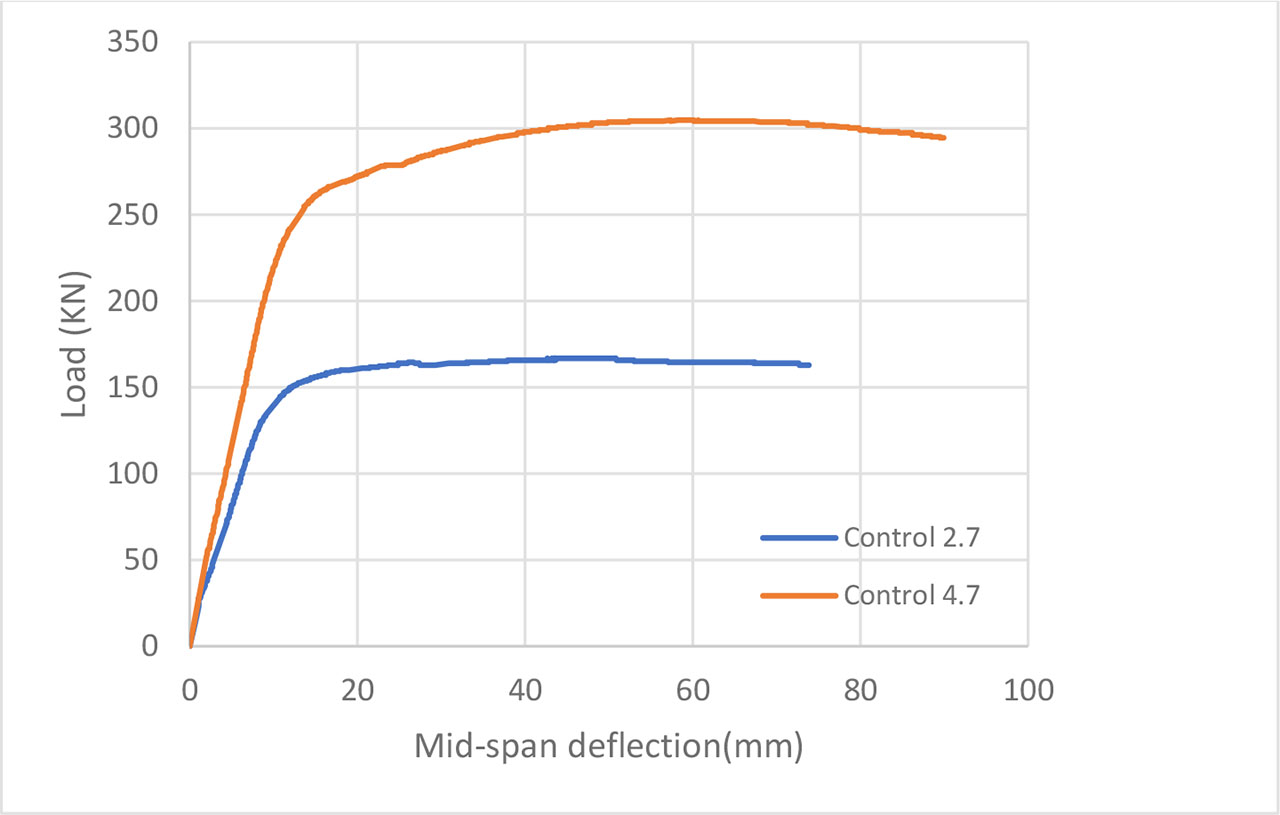
Fig. 7:
Load deflection curves of control beams.
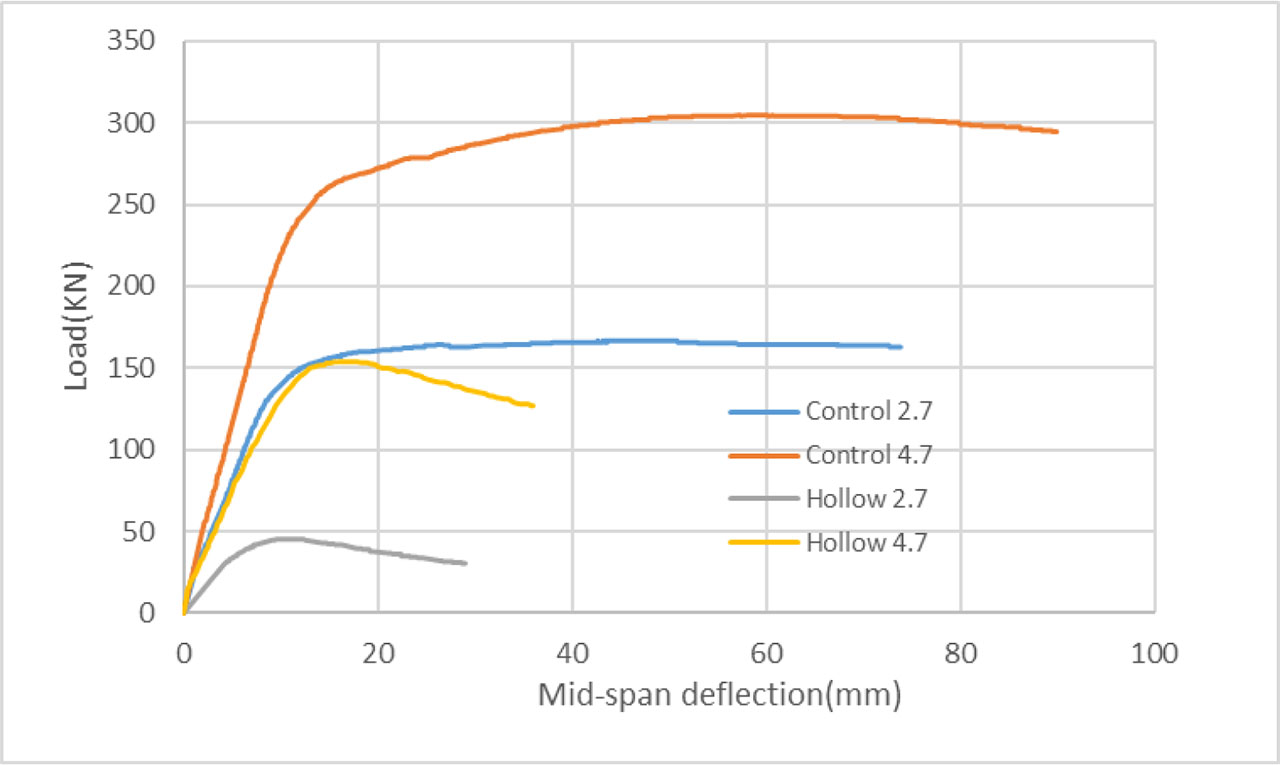
Fig. 8:
Load-deflection curves for control specimens compared to hollow specimens.
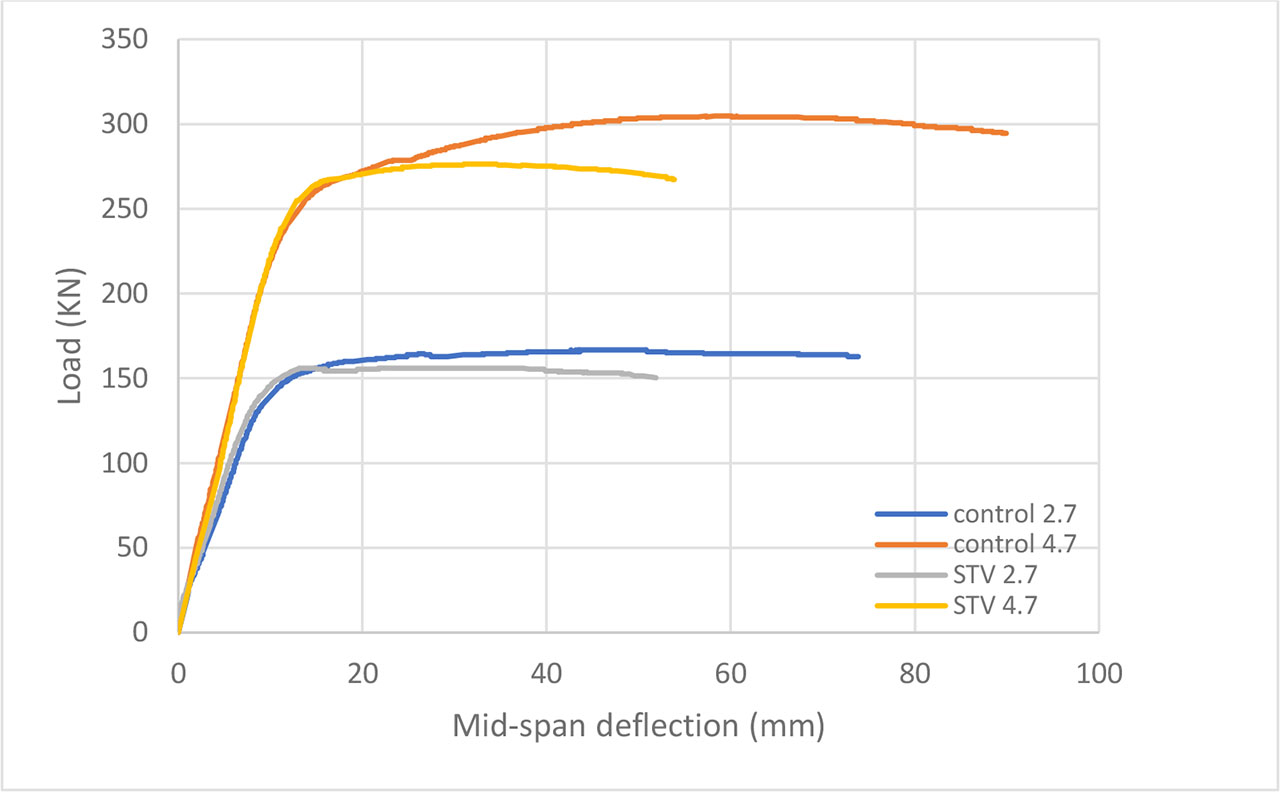
Fig. 9:
Load-deflection curves for control specimens compared to STV specimens.
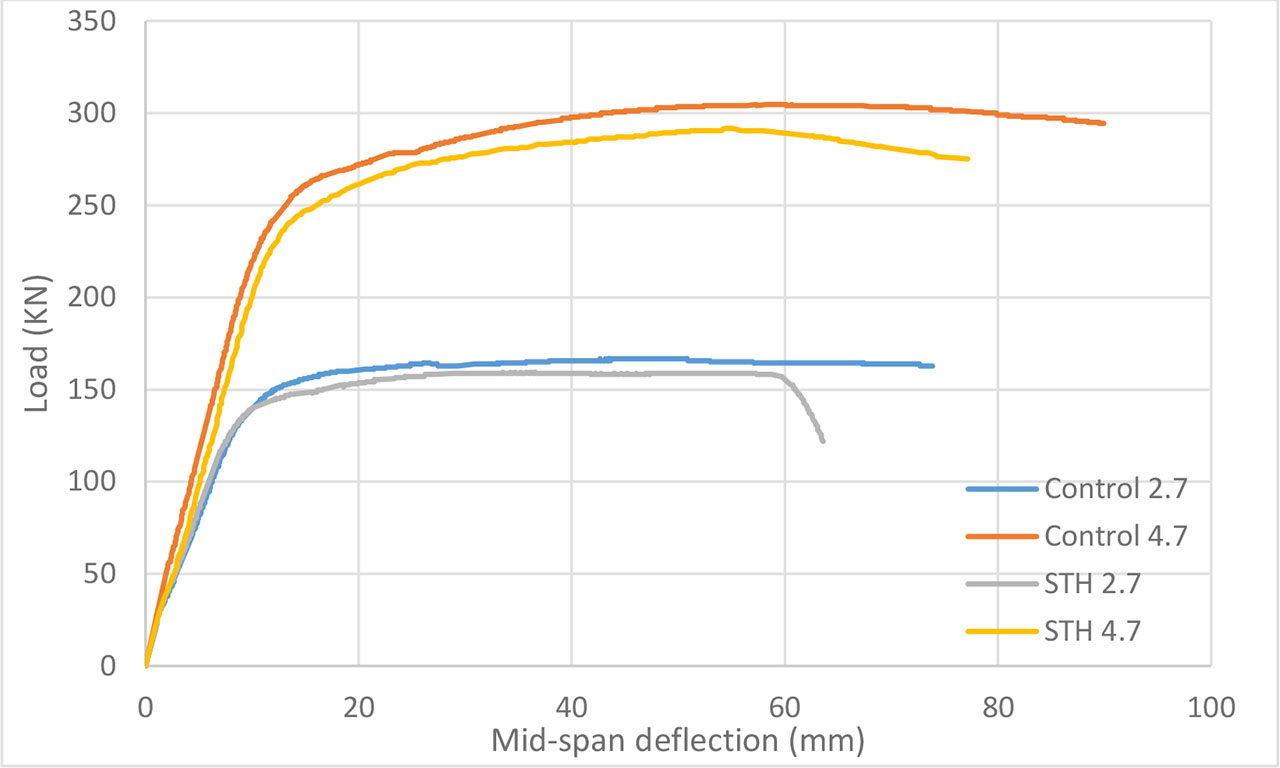
Fig. 10:
Load-deflection curves for control specimens compared to STH specimens.
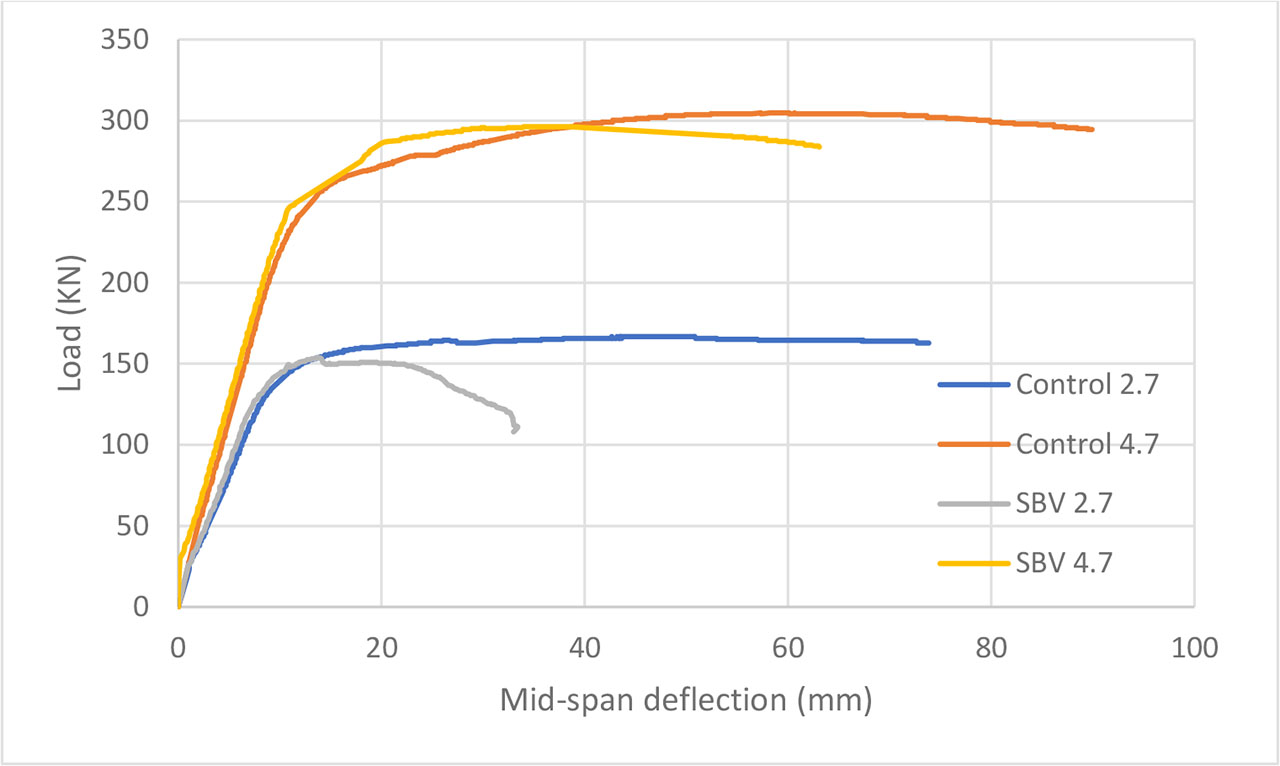
Fig. 11:
Load-deflection curves for control specimens compared to SBV specimens.
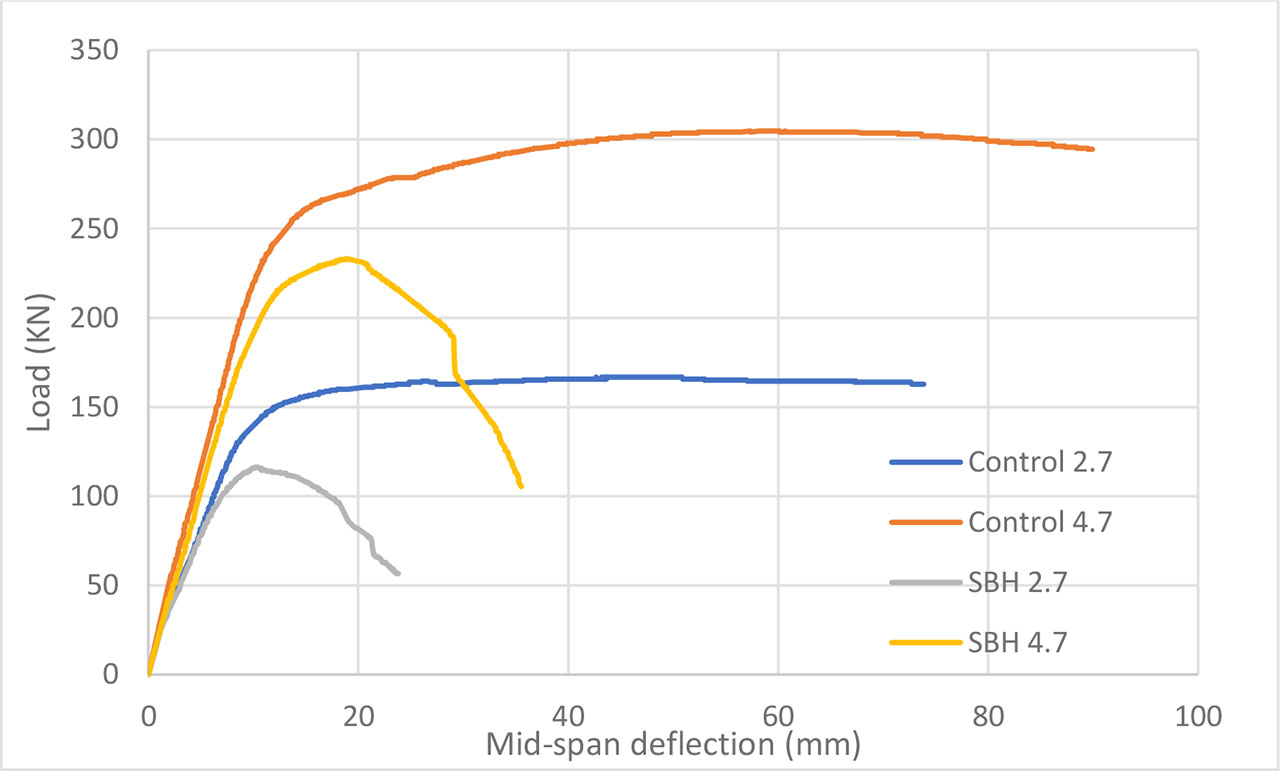
Fig. 12:
Load-deflection curves for control specimens compared to SBH specimens.
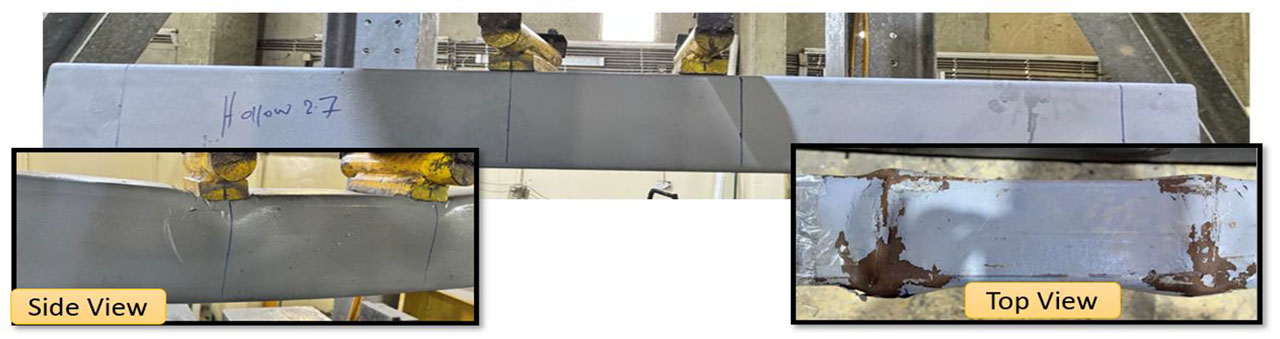
Fig. 13a:
Failure Behaviour of Hollow Steel Tube Beams with thickness 2.7.
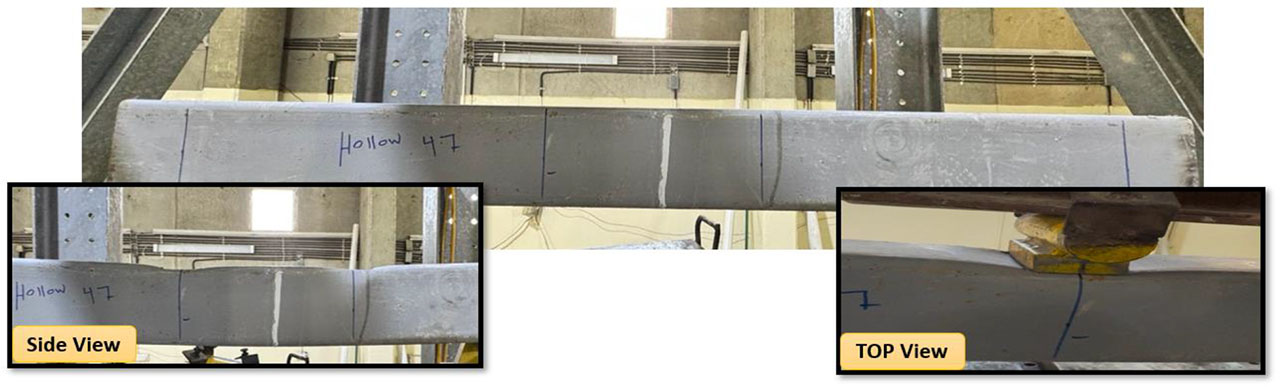
Fig. 13b:
Failure Behaviour of Hollow Steel Tube Beams with thickness 4.7.
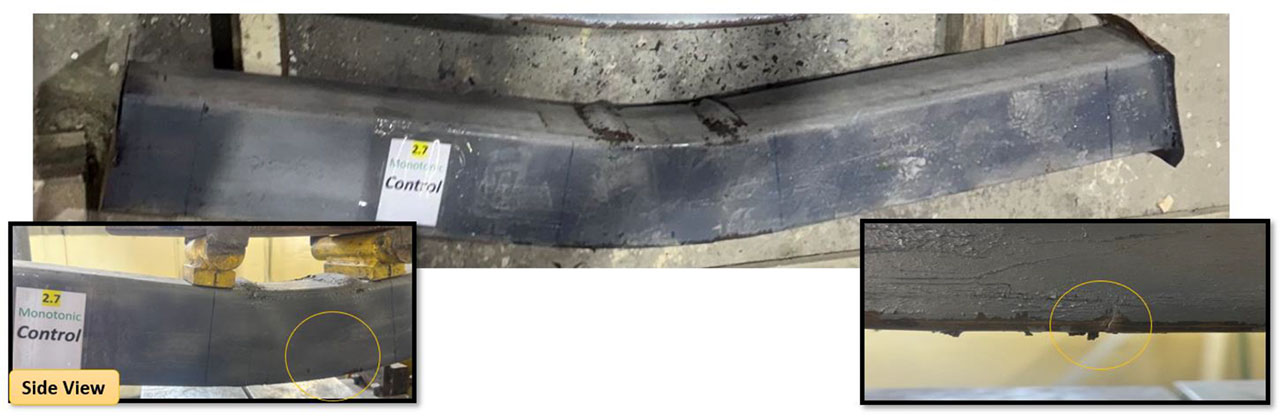
Fig. 14a:
Failure Behaviour of Control Steel Tube Beams with thickness 2.7.
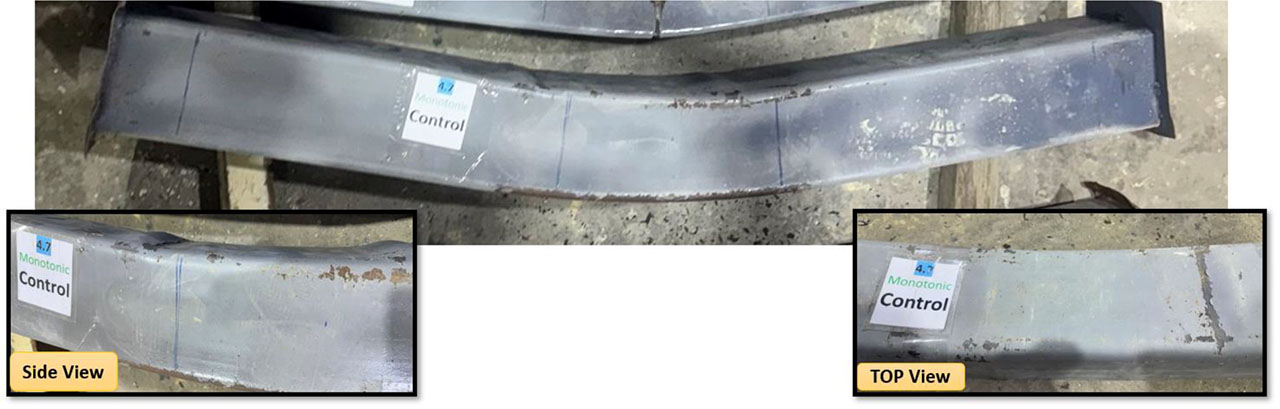
Fig. 14b:
Failure Behaviour of Control Steel Tube Beams with thickness 4.7.
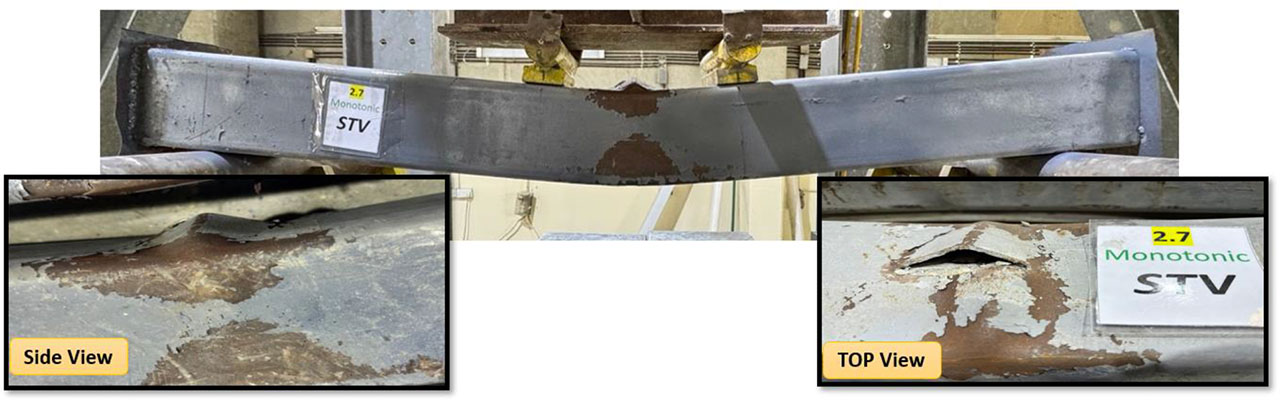
Fig. 15a:
Failure behaviour of STV beams with vertical notches in the compression zone with thickness 2.7.
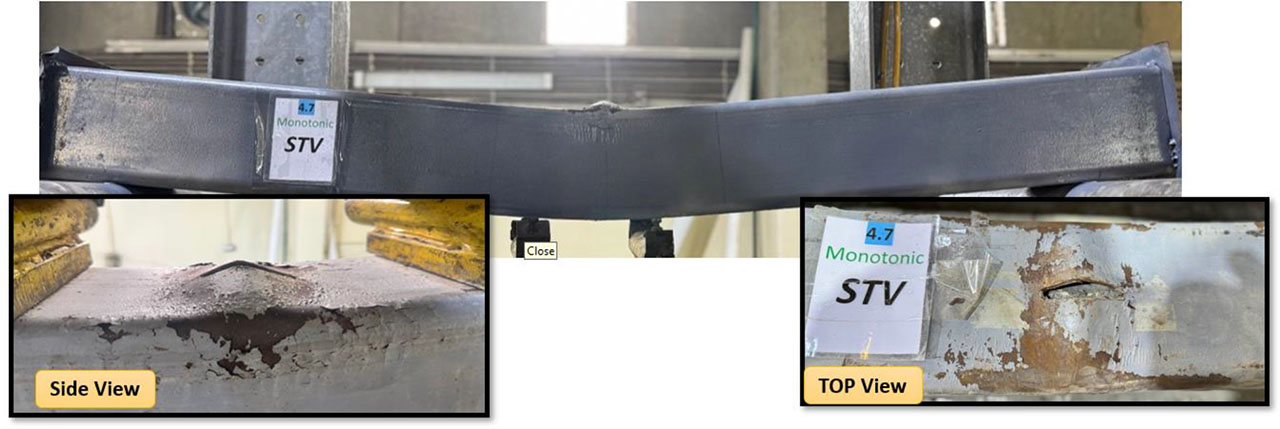
Fig. 15b:
Failure behaviour of STV beams with vertical notches in the compression zone with thickness 4.7.
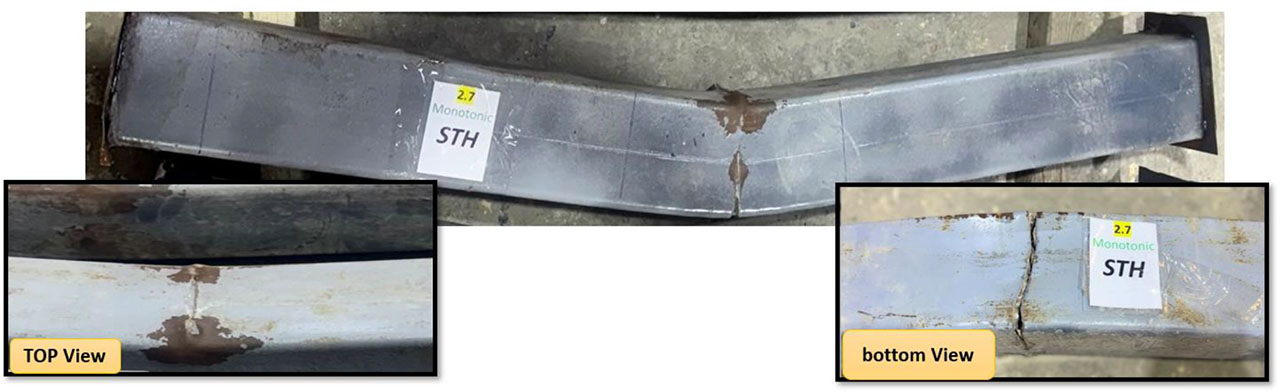
Fig. 16a:
Failure behaviour of STH beams with horizontal notches in the compression zone with thickness 2.7.
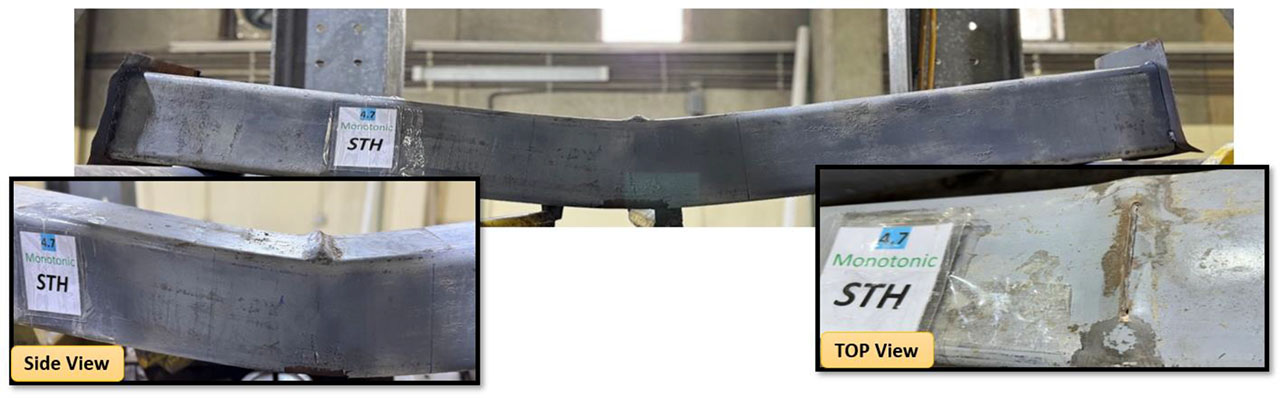
Fig. 16b:
Failure behaviour of STH beams with horizontal notches in the compression zone with thickness 4.7.
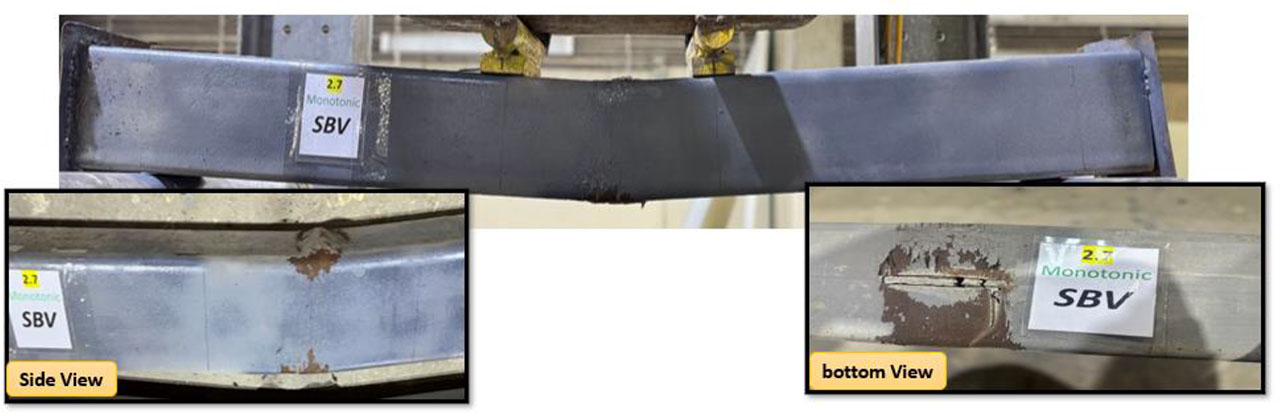
Fig. 17a:
Failure behaviour of SBV beams with vertical notches in the tension zone with thickness 2.7.
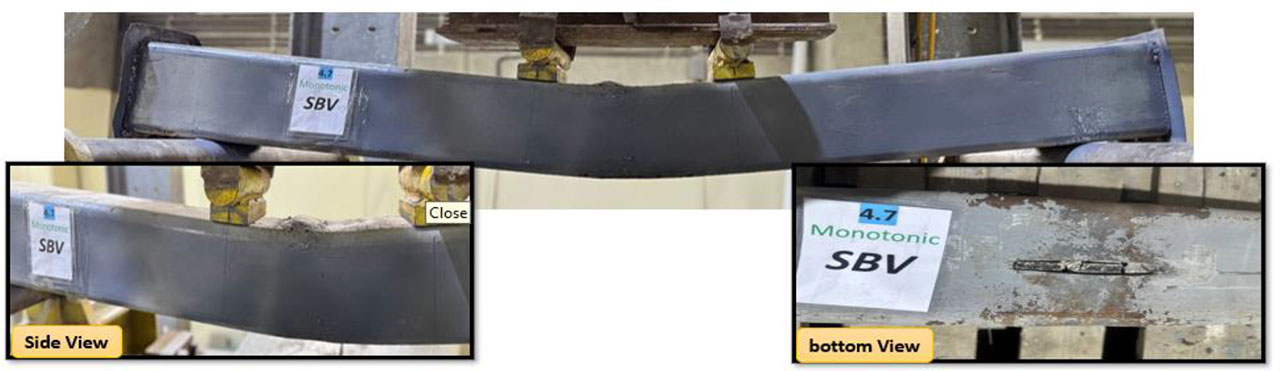
Fig. 17b:
Failure behaviour of SBV beams with vertical notches in the tension zone with thickness 4.7.
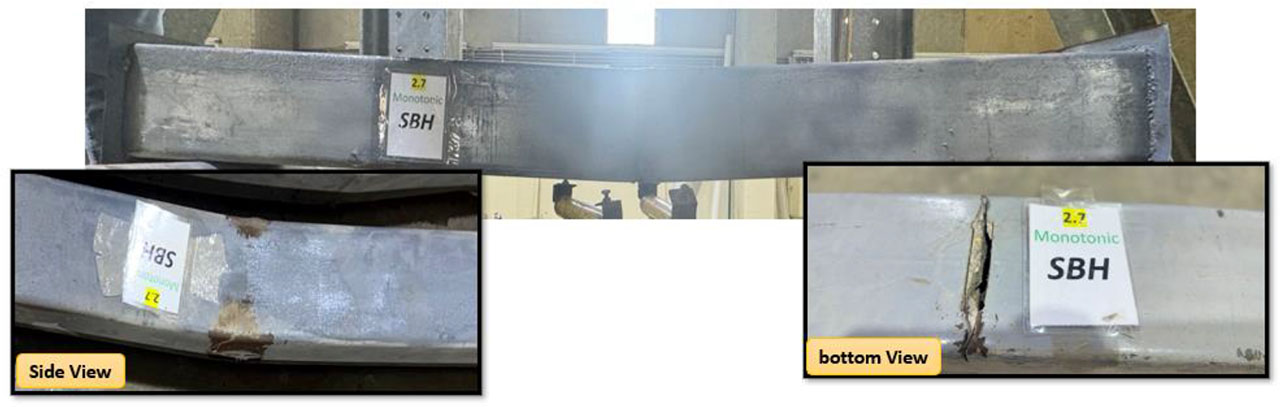
Fig. 18a:
Failure behaviour of SBH beams with horizontal notches in the tension zone with thickness 2.7.
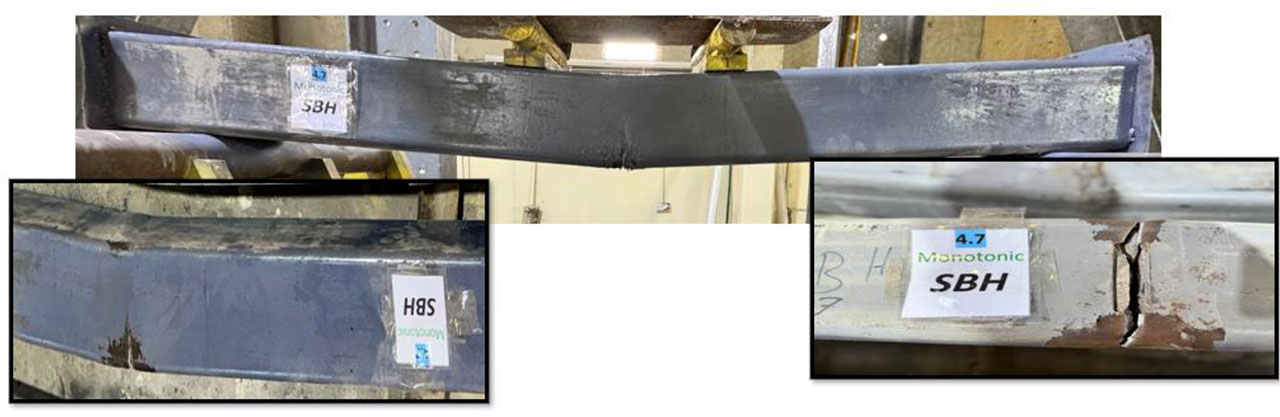
Fig. 18b:
Failure behaviour of SBH beams with horizontal notches in the tension zone with thickness 4.7.