

The growth of a road network is a crucial sign of a nation's progress (Henao-Pereira et al., 2020). Road safety is intrinsically linked to the quality of the roadway, as hazardous occurrences are more probable on degraded surfaces (Mohammed & Ismael, 2021; Rozo-Verjel & Pérez-Fernández, 2021;Singh & Singh, 2024). For best efficiency, asphalt pavements must demonstrate durability and sustainability during their lifespan (Omar et al., 2020; Ismael et al., 2021; Ugla & Ismael, 2023). Given the rising traffic volumes and vehicle loads, it is essential to design asphalt pavement to achieve the requisite resistance against many types of failures, including stress fractures, rutting, and low-temperature cracking (Albayati & Al-Mosawe, 2023; Raof & Ismael, 2019). Consequently, bituminous mixtures with superior durability and resistance, such as stone matrix asphalt (SMA), may mitigate this distress to the greatest extent feasible. The utilization of the SMA mix is prevalent in many locations globally for high-traffic zones (Rahman et al., 2020). SMA is a gap-graded combination including a coarse aggregate skeleton of approximately 70–80%, a bitumen component of about 6–7%, fiber content between 0.3–0.5%, and filler content of roughly 8–12%. The coarse aggregate structure enables stone-on-stone contact in the combination, enhancing strength, while the increased mortar content of the binder ingredient improves durability (Błazejowski, 2016; Shiva Kumar & Ravi Shankar, 2020). Reinforcement typically involves incorporating materials with desirable properties into other materials lacking these attributes. Fiber reinforcement was employed to support tensile strength, enhance the pavement's resistance to various distresses, and inhibit the initiation and spread of cracks (Mahrez & Karim, 2010). Stabilizing additives (such as cellulose fiber, polymers, and mineral fiber) in SMA mixtures are used to prevent bitumen drainage and enhance indirect tensile strength and cohesive characteristics (Jasim & Ismael, 2021; Kar et al., 2019; Ramalingam et al., 2017). Multiple studies have successfully utilized cellulose fibers in SMA mixtures to alleviate the drain-down problem due to their significant absorption of asphalt material. These fibers are costly and not easily accessible. Consequently, numerous researchers have effectively utilized waste fibers in SMA combinations, including coir, banana, jute, kenaf, sisal, coconut, basalt, and glass fibers. They are often utilized as stabilizing additives and demonstrate exceptional resistance to fatigue, rutting, drain-down, and moisture-induced damage (Ali & Al-Tameemi, 2025; Kumar & Ravitheja, 2019; Tanzadeh et al., 2019).
Researchers have extensively studied jute fibers. JF goods are distinguished by their environmentally favorable characteristics, including biodegradability and renewable sourcing, which enhance their sustainability. JF demonstrates significant biodegradability, guaranteeing that things crafted from this substance can naturally degrade without inflicting enduring environmental damage. Moreover, JF's regenerative characteristics, featuring a quick growth cycle of 4–6 months and substantial cellulose production, highlight its viability as a sustainable substitute for traditional materials. Furthermore, the principal element of JF goods, jute, sequesters carbon dioxide (CO2) and emits oxygen, mitigating greenhouse effects and stabilizing the ecosystem. Moreover, jute products have a minimal carbon footprint and require less energy (Singh et al., 2018; Tarannum Jarin et al., 2024).
Sharma & Goyal (2006) assessed the efficacy of JF with crumb rubber-modified binder (CRMB). Both stabilizing treatments primarily diminished the drainage; nevertheless, JF proved the most effective. Shanbara et al. (2018) demonstrated that incorporating 14 mm long JF at a concentration of 0.35% by mix weight in cold-mix asphalt significantly enhanced the indirect tensile strength of the asphalt mixture. Gallo et al. (2021) exhibited that including 20 mm JF at a concentration of 0.2% in an asphalt mixture improved air void content and indirect tensile strength. However, the tensile strength ratio experienced a minor decrease. Hassan et al. (2021) investigated the application of JF as a reinforcing component in asphalt mixtures. Findings from the Marshall stability and flow test revealed that 0.5% and 1% JF improved stability by 29% and 10%, respectively. The OAC increased from 4% to 5%. JF-modified mixtures demonstrated enhanced deformation resistance relative to unmodified combinations, with the authors advocating for a JF concentration of 0.5%. Ismael et al. (2022) studied the JF at various concentrations (0.25%, 0.5%, and 0.75%) and lengths (5, 7.5, and 10 mm) within SMA mixtures. JF at a concentration of 0.5% and a length of 7.5 mm can significantly enhance the rutting resistance and stability of the SMA by 34% and 63%, respectively. Furthermore, JF demonstrated improved drain-down characteristics. According to the review performed by AlSaadi et al. (2023), the incorporation of natural fiber in the SMA mixture can improve mechanical properties, be used as a substitution for synthetic fiber because of its excellent adhesion to asphalt, and keep the binder from draining down. (Gallo et al., 2024) found that adding JF at 0.1%, 0.2%, and 0.3% by weight of the total mixture, with lengths of 10mm and 20 mm, resulted in a proportional relationship between JF content and air voids. Shorter 10mm fibers also increased the air void content.
Although several studies have shown that JF improve the properties of asphalt mixtures, the literature is still plagued by inconsistencies and limitations. Gallo et al. (2021) noted a slight decrease in the TSR despite improved air voids, suggesting that larger fiber lengths may negatively impact moisture resistance. Hassan et al. (2021) observed that increasing the content of JF improved Marshall stability but also increased the OAC, which may effect cost and workability. Sharma & Goyal (2006), on the other hand, focused solely on reducing drain-down, without examining the effect of fibers on rutting or aging resistance. While Ismael et al. (2022) emphasized the importance of fiber length and content in influencing mechanical performance, other studies relied on fixed parameters without assessing the effect of changes in these factors. This discrepancy between the results indicates the absence of a comprehensive research framework to evaluate the effects of both JF length and content in SMA mixtures. Accordingly, this study aims to fill this gap by evaluating the effects of different lengths and content of WJF on the functional properties of mixtures, promoting their use as a sustainable alternative to synthetic stabilizers.
The primary objective of this research is to study the effect of different percentages and lengths of WJF on the design of a SMA mixture with optimum WJF length and content. The testing is accomplished by executing various laboratory experiments, including Marshall stability, volumetric characteristics, drain-down test, ITS, and compressive strength. The goal is to improve the sustainability and efficacy of asphalt pavements by incorporating cost-effective and environmentally friendly WJF.
Asphalt cement, with a penetration grade of 40/50, was bought from the Al-Daurah refinery in Baghdad. Table 1 enumerates the physical parameters of asphalt cement. All test results adhere to the standards set by (SCRB, 2003).
Physical Characteristics of Asphalt Cement
| Test | Unit | ASTM | Result | SCRB |
|---|---|---|---|---|
| Penetration (25°C, 100 g, 5 sec) | 0.1 mm | D5 | 44 | 40–50 |
| Softening Point (Ring & Ball) | °C | D36 | 54 | …… |
| Specific Gravity @ 25°C | …… | D70 | 1.04 | …… |
| Ductility (25°C, 5 cm/min) | cm | D113 | 119 | >100 |
| Flash Point (Clevel and Open Cup) | °C | D92 | 314 | >232 |
| Kinematics viscosity, at 135°C | cSt | D2170 | 453 | ≥400 |
| Residue from Thin-Film-Oven-Test, D1754 | ||||
| Retained Penetration (% of original) | % | D5 | 80 | ˃ 55 |
| Ductility (25°C, 5 cm/min) | cm | D113 | 69 | ˃ 25 |
Coarse crushed aggregate sourced from the Al-Nibaai quarry in Baghdad was employed. The size of the coarse aggregate for the asphalt-wearing course ranged from 19 mm to 4.75 mm sieve sizes. Table 2 delineates the physical characteristics of coarse aggregate. Fine aggregate consists of particles ranging in size from No. 4 (4.75 mm) to No. 200 (0.075 mm). Table 3 outlines the physical characteristics of fine aggregate. Limestone dust was employed as a filler. It was acquired from a lime production facility in Karbala, Iraq. These materials are compatible with the standards (SCRB, 2003).
Physical Characteristics of Coarse Aggregate
| Test | ASTM Designation No. | Results | SCRB Specification |
|---|---|---|---|
| Los Angeles Abrasion, [%] | (C131, 2014) | 16.3 | 30 Max. |
| Flat and Elongated, [%] | (D4791, 2023) | 1.8 | …… |
| Absorption, [%] | (C127, 2015) | 0.562 | …… |
| Soundness, [%] | (C88, 2013) | 3.87 | …… |
| Bulk Specific Gravity | (C127, 2015) | 2.611 | …… |
Jute fiber is a natural fiber employed in various quantities and lengths, as shown in Figure 1. It is a fiber formed from plants, principally consisting of cellulose, hemicellulose, and lignin (Faruk et al., 2012). Due to its high strength, cost-effectiveness, and environmentally sustainable characteristics, JF is the next most produced natural fiber worldwide, behind cotton, and is predominantly utilized in the packaging sector (Gani & Ali, 2018; Islam et al., 2018). Table 4 shows some physical properties of WJF, were determined through experimental testing conducted with a Tinius Olsen H50KT universal tensile testing machine (produced in the UK), adhering to conventional laboratory protocols.
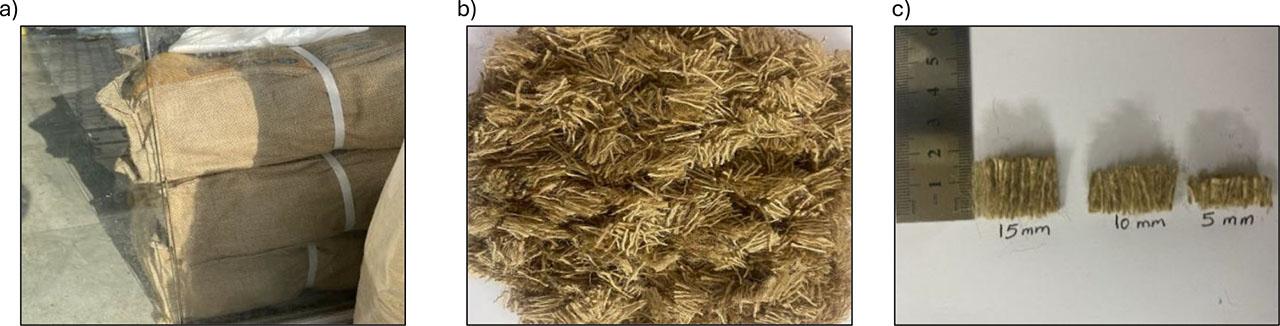
Waste jute fiber: (a) WJF Utilized in Packaging, (b) WJF after Cutting, (c) WJF at required
Physical Characteristics of Fine Aggregate
| Test | ASTM Designation No. | Results |
|---|---|---|
| Liquid Limit, [%] | (D4318, 2017) | 6.4 |
| Soundness, [%] | (C88, 2013) | 1.94 |
| Absorption, [%] | (C128, 2015) | 0.724 |
| Bulk specific gravity | (C128, 2015) | 2.651 |
Characteristics of WJF
| Property | Unit | Jute fiber |
|---|---|---|
| Density | [g/cm3] | 1.41 |
| Diameter | [mm] | 1 |
| Yield Force | [N] | 41.5 |
| Elong at Yield | [%] | 4.95 |
| Tensile Strength | [MPa] | 52.8 |
| Max. Force | [N] | 41.5 |
| Elong at Max. | [%] | 4.95 |
| Elongation | [%] | 19.67 |
The composite aggregate gradation adheres to the specifications set out by (AASHTO T 325, 2012), with a nominal maximum aggregate size of 12.5 mm, typically employed for wearing course construction. The aggregate gradations for SMA blends were chosen for this assignment. A minimum of three gradation trials is necessary to ascertain the appropriate aggregate gradation. The three selected gradients are: the middle gradient of the standard, the coarse gradient, which is the midpoint between the lower limit of the standard and the middle gradient, and the fine gradient, defined as the average gradient between the upper limit of the standard and the middle gradient, as illustrated in Figure 2. A fiber content of 0.3% and a fiber length of 10mm were used for each gradient.
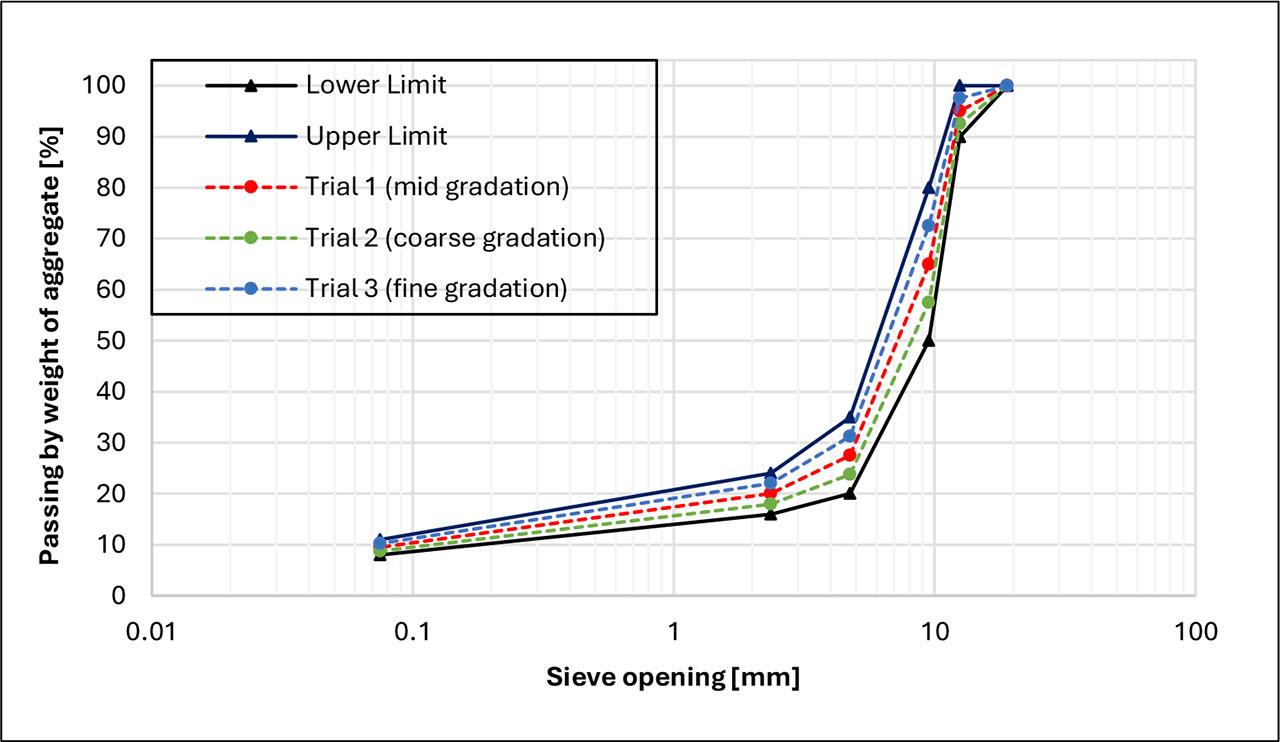
Aggregate gradation
The stone-on-stone arrangement of the coarse aggregate structure is crucial in SMA blends. It is attainable when the void in coarse aggregate (VCA) within a compacted mixture (VCAmix) is smaller than the void in coarse aggregate (VCADRC) as calculated by Equation 1.
Where:
GCA – the bulk specific gravity,
γs – the unit weight derived from the dry-rodded test [kg/m3],
γw – the unit weight of water [1000 kg/m3].
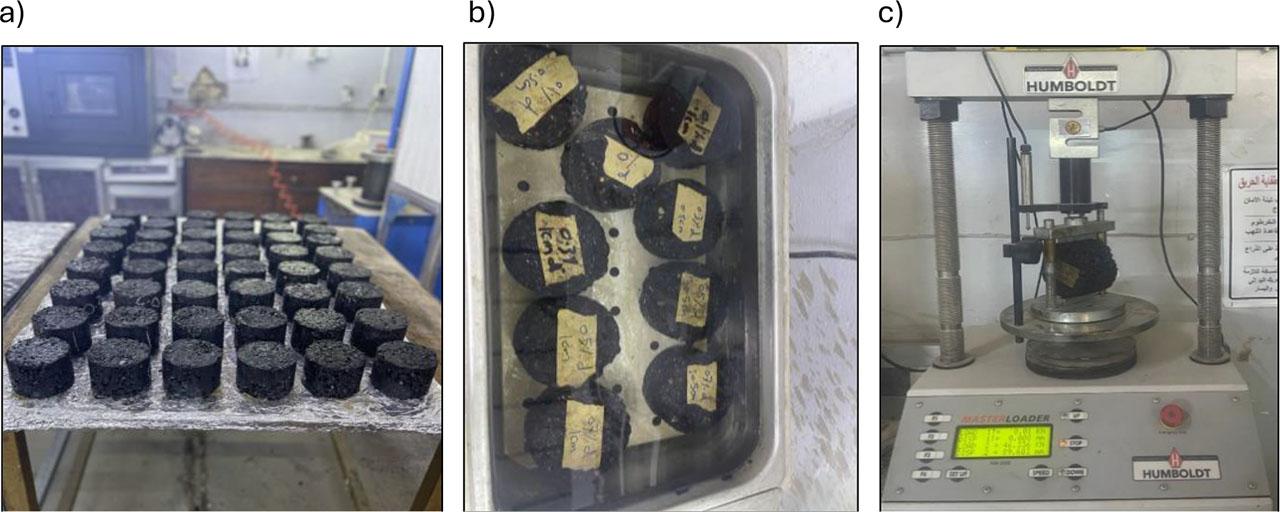
Following the preparation phase of the mixture's components, WJF were added in the aggregate at four specific concentrations (0.1%, 0.3%, 0.5%, and 0.7%) based on the total weight of the mixture, employing three lengths of 5, 10, and 15 mm, applied individually by a dry process. To avert fiber clumping during mixing, WJF were incrementally and uniformly introduced to the heated aggregate during a quick dry mixing process lasting 60 seconds to guarantee uniform fiber distribution. Bitumen was subsequently included, and wet mixing persisted for an additional 90 seconds to attain a homogenous mixture and Visual examination to prevent clumping issues during mixing benefited this objective (Albayati & Qadir-Ismael, 2024;Ismael & Al-Taher, 2015). The mixing and compaction temperatures were established according to viscosity thresholds of (170±20 cSt and 280±30 cSt), respectively. After that, the heated mixes were set in a steel frame and compacted with 75 blows to form a Marshall sample measuring 101.6 mm in diameter and 63.5 mm in height. Three samples were created for each of the six asphalt contents (4.5%, 5%, 5.5%, 6%, 6.5%, and 7% by weight of the mixture and then the average was taken. The Asphalt Institute stipulates that four percent air voids serve as the principal criterion for ascertaining the OAC for each mixture's design process. Figure 3 displays the Marshall-prepared specime
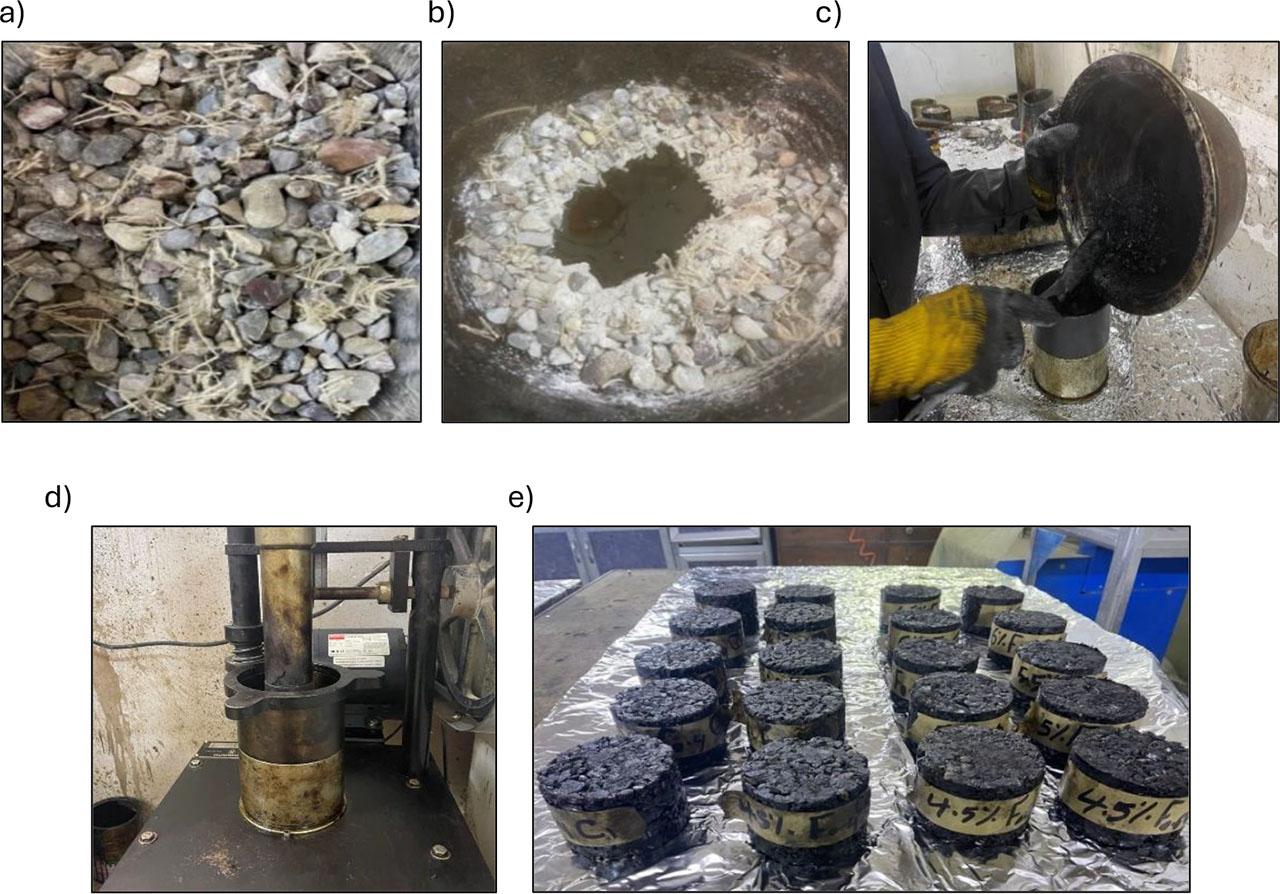
Preparation of Marshall Specimens: (a) Mixing Aggregate with WJF, (b) Adding Asphalt to the Mix, (c) Adding Mix into the Mold (d) Marshall Compactor with mix, (e) Marshall Specimens
Marshall's test examines stability and the corresponding flow magnitude, as specified in (ASTM D6927, 2015). The specimens were immersed in a 60 °C water bath for 40 minutes to attain the specified testing temperature. Thereafter, the samples were immediately set in the Marshall apparatus to avert a decline in temperature. Figure 4 displays the Marshall test. A compressive force was applied to the specimen at a rate of 50.8 mm/min until failure occurred. The peak load at material failure is referred to as Marshall stability, whereas the corresponding deformation due to the plastic of the specimen is termed flow value (Al-Bayati & Ismael, 2023). Additionally, the bulk and maximum specific gravities were determined using ASTM D2726 and D2041, respectively.
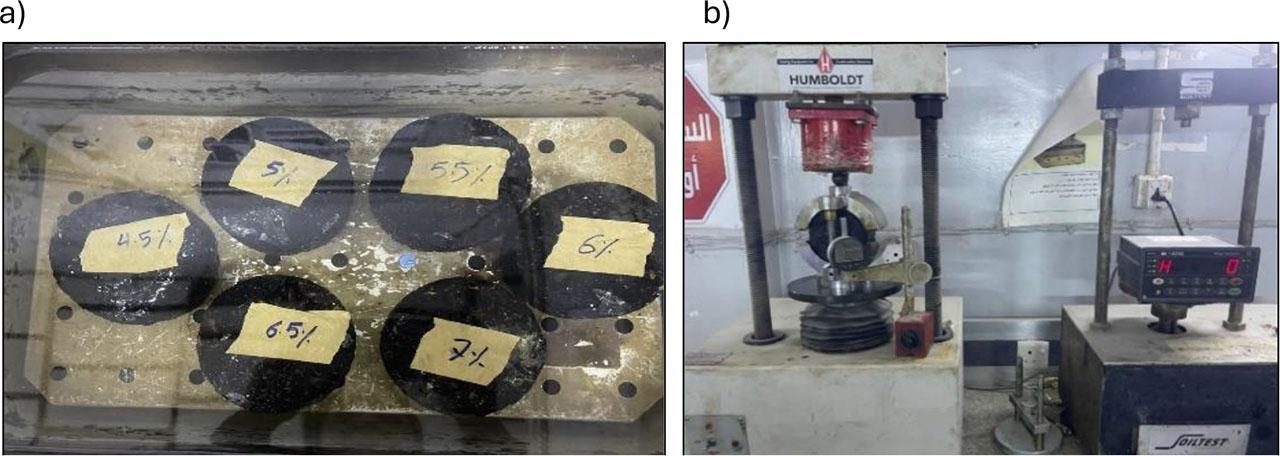
Marshall testing: (a) Specimens in water path at 60 °C, (b) Marshall Stability and Flow Test
The drain-down test evaluates the likelihood of asphalt binder separating from aggregates during mixing, transportation, placement, and compaction as described in (AASHTO T 305, 2018), with an allowable limit of less than 0.3%. The procedure outlined in (ASTM D 6390, 2017) was adhered to during the testing period. The test was conducted using loose samples at the manufacturing temperature. Three samples were prepared and then the average was taken. Figure 5 displays the drain-down test. The volume of the mastic drain-down was determined using Equation 2:
Where:
C – the mass of the empty pan in grams,
D – the mass of the pan and sample after removal from the oven in grams,
A – the mass of the empty basket in grams,
B – the mass of the basket and sample in grams.
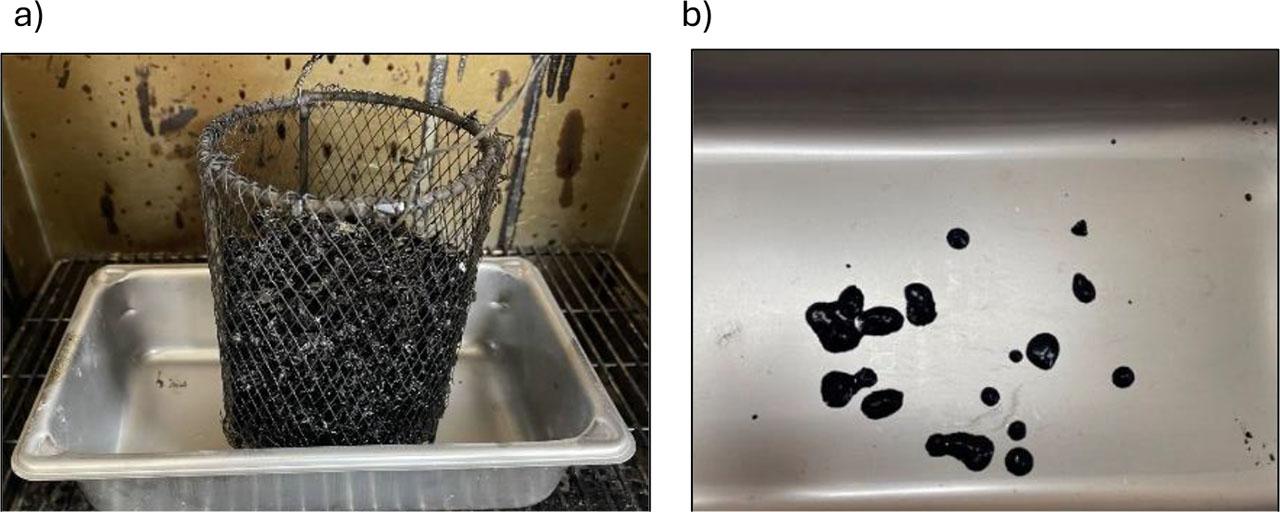
Drain down test: (a) The Wire basket and sample in the oven, (b) The drained out materials
The indirect tensile strength test was performed according to the procedure outlined in (ASTM D6931, 2012). For each mix, three specimens were produced using the Marshall compaction process and the average was taken. The samples had a diameter of 101.6 mm and a height of 63.5 mm. A vertical compressive load was applied at a deformation rate of 50±5 mm/min until the maximum load was attained. The peak load was documented. Experiments were performed at 25°C, as illustrated in Figure 6. Equation 3 was employed to compute ITS (kPa) values.
Where:
P – ultimate load failure [N],
t – height of the specimen [mm],
d – Diameter of the specimens.
Indirect tensile strength testing: (a) ITS Specimens, (b) Specimens in water path at 25°C, (c) ITS Testing
Samples approximately 101.6 mm by 101.6 mm were chosen in compliance with (ASTM D1074, 2017). This procedure was utilized to create a test mixture to ascertain the suitable component weight, roughly 1900 g. About fifty percent of the asphalt mixture was placed into the mold to prevent honeycombing, and a heated spoon was employed to rapidly shovel the material ten times at random and fifteen times along the mold's perimeter. The remaining portion was swiftly placed into the mold cylinder and compacted likewise. Following compaction at 150 psi, the mixture was exposed to a pressure of 3000 psi. Subsequently, permit the sample to equilibrate to ambient temperature for 24 hours. Three samples are necessary for each mixture and the average was taken. The specimens, then positioned vertically, allowed for applying an axial force at an average rate of 5.08 mm/min to the original surface until failure occurred (Ismael & Ismael, 2019). The compressive strength (kPa) was computed by dividing the highest significant vertical force observed during deformation by the original cross-sectional area of the test specimen. Figure 7 displays specimens for compressive strength testing.
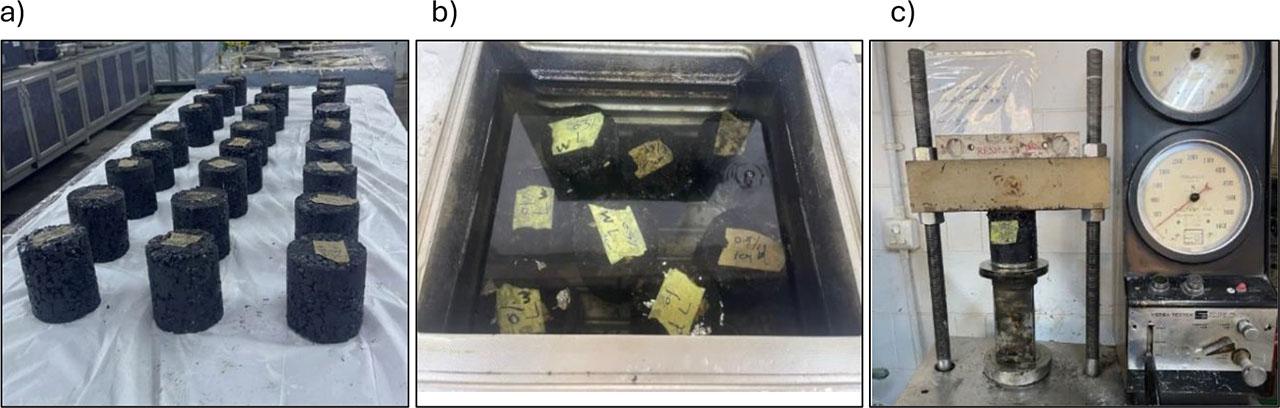
Compressive strength test: (a) Specimens 4*4 inch, (b) Specimens in water path at 25°C, (c) Specimen Testing
Table 5 displays the results for each of the three trial gradations. Trial gradation two (mid-gradation) had the greatest stability and satisfied the additional requirements, so it was chosen as the selected aggregate gradation for this study.
The mechanical and volumetric properties of the three trial aggregate gradations for SMA.
| Property | Trial 1 (fine gradation) | Trial 2 (mid-gradation) | Trial 3 (coarse gradation) | Requirement AASHTO M 325) |
|---|---|---|---|---|
| Optimum asphalt content% | 6.18 | 6.24 | 6.33 | 6% min |
| Stability [kN] | 10.4 | 11.42 | 9.48 | - |
| Flow [mm] | 3.34 | 3.51 | 3.63 | - |
| Bulk density [g/cm3] | 2.346 | 2.327 | 2.296 | - |
| Max. specific gravity | 2.444 | 2.424 | 2.391 | - |
| Air voids [%] | 4% | 4% | 4% | 4% |
| VMA [%] | 16.44 | 17.18 | 18.36 | 17% min |
| VFA[%] | 75.60 | 76.64 | 78.14 | |
| VCAMIX [%] | 35.1 | 36.44 | 38.36 | <VCADRC |
| VCADRC [%] | 40.53 | 41.84 | 42.37 | - |
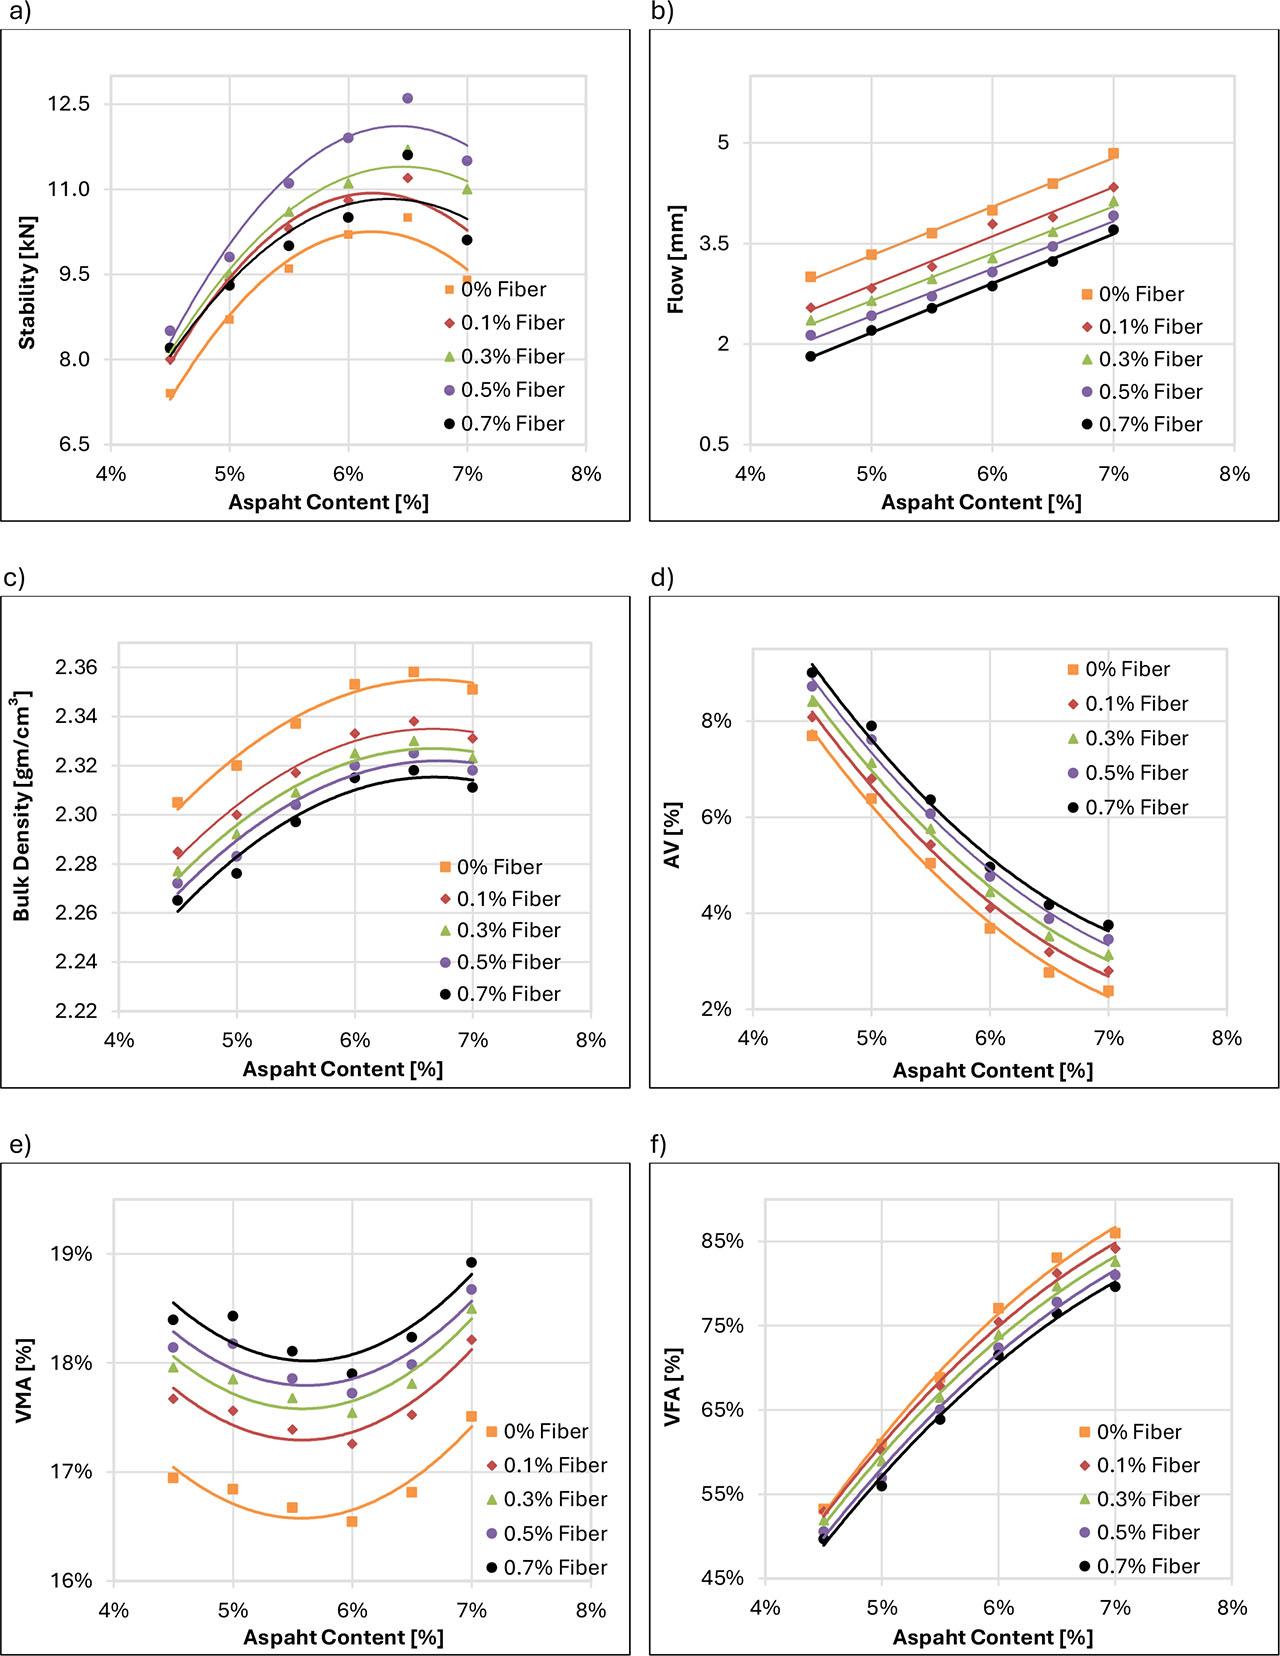
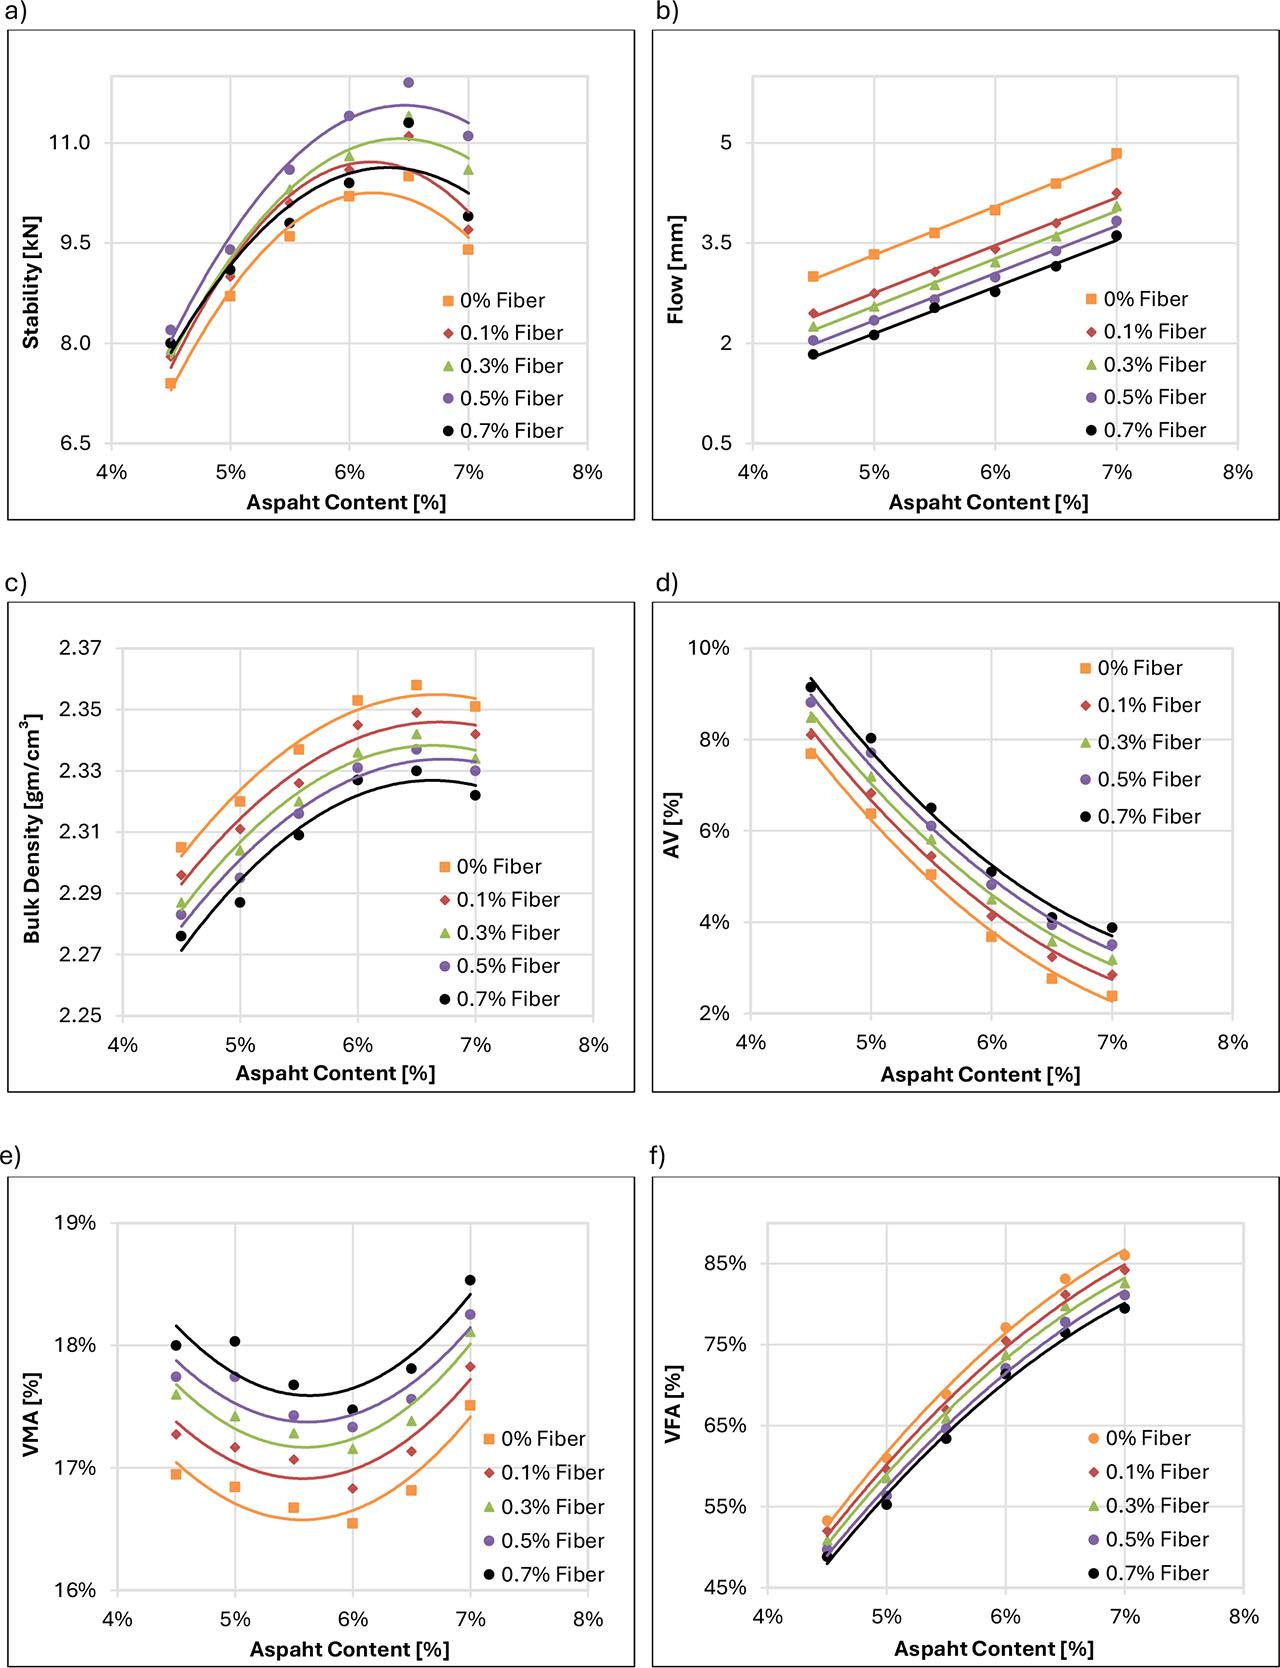
Figures 8, 9 and 10 illustrate the test results for the volumetric and mechanical properties of asphalt mixtures, using WJF length 5mm, 10mm and 15 mm, respectively.
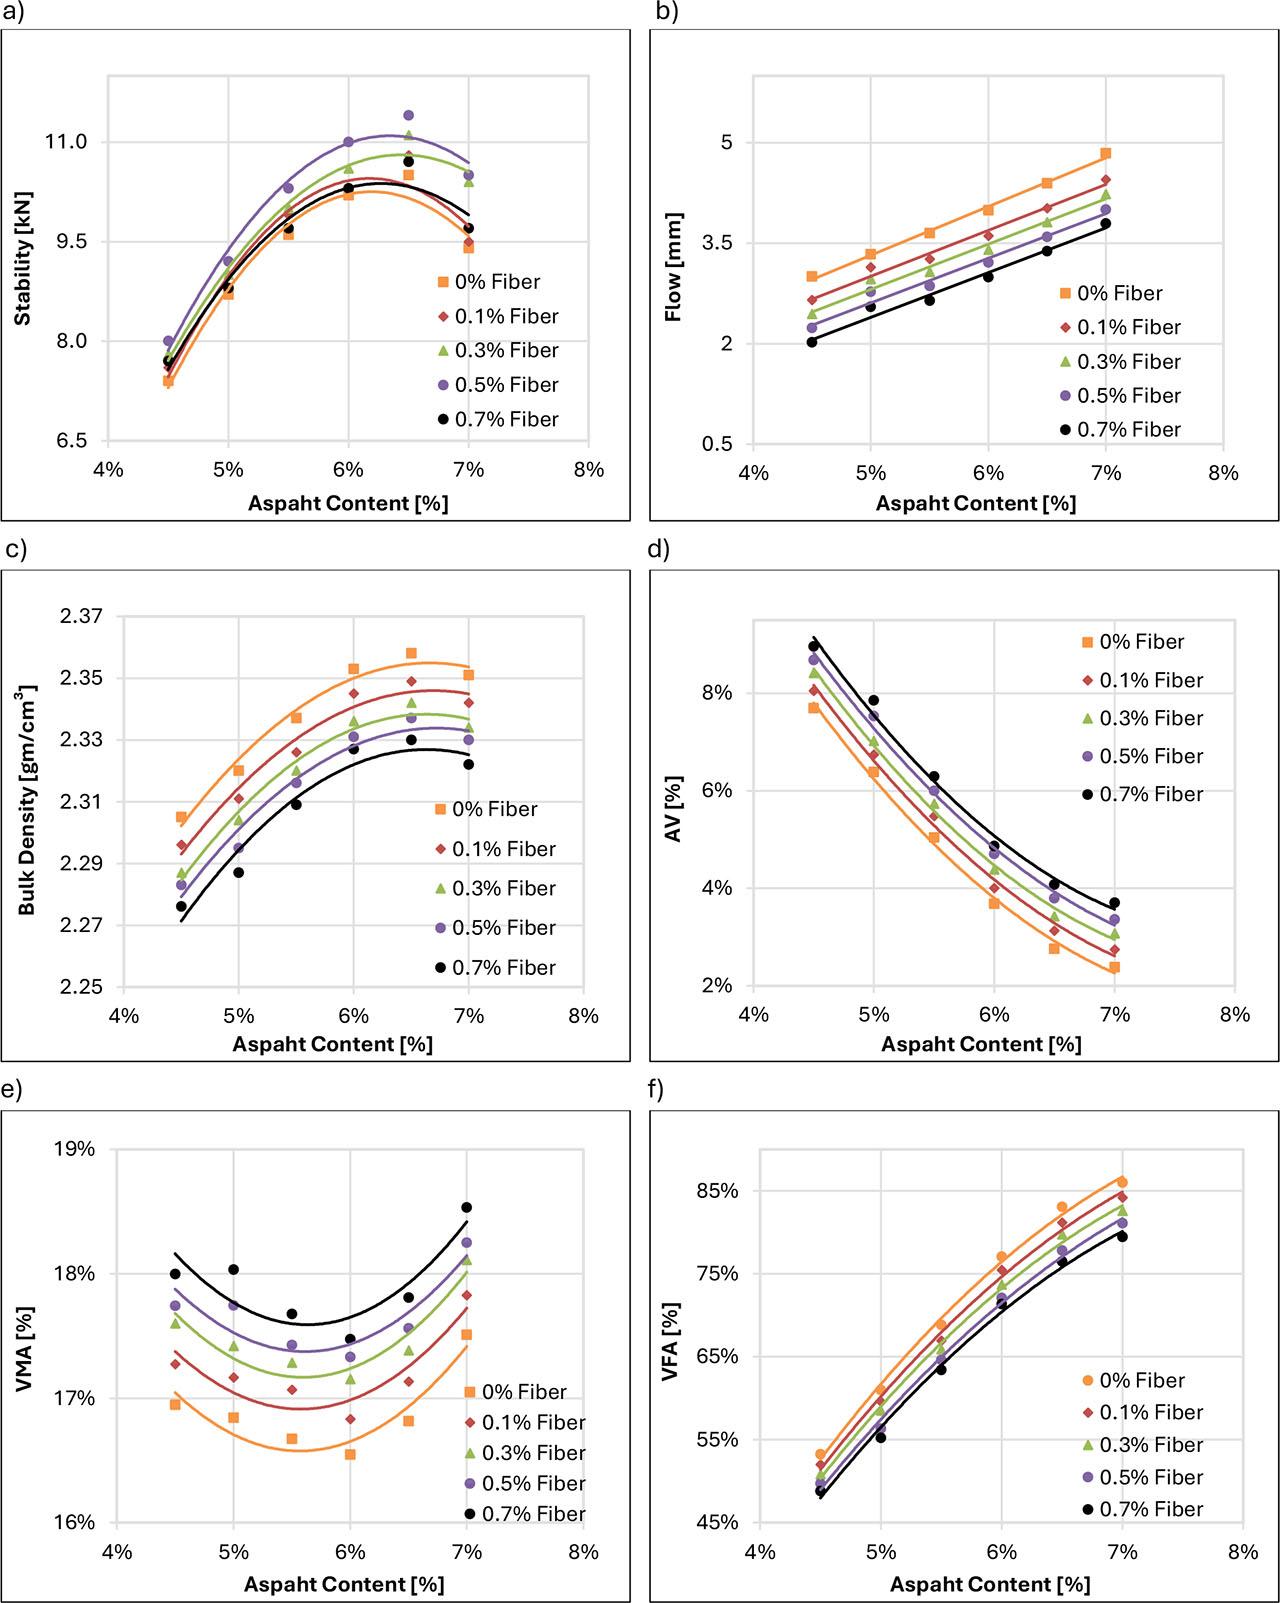
Mechanical and volumetric properties of SMA mixtures (WJF =5mm length): (a) Stability, (b) Flow, (c) Bulk density, (d) AV%, (e) VMA%, (f) VFA %
Mechanical and volumetric properties of SMA mixtures (WJF =10mm length): (a) Stability, (b) Flow, (c) Bulk density, (d) AV %,(e) VMA%, (f) VFA %
Mechanical and volumetric properties of SMA mixtures (WJF =15mm length): (a) Stability, (b) Flow, (c) Bulk density, (d) AV %, (e) VMA%, (f) VFA %
The test findings indicated that the optimum asphalt content increases with more fiber dosage, as shown in Figure 11. This result is clarified as follows: Fiber inclusion requires a greater amount of asphalt to adequately cover its surface due to the fiber's ability to absorb the lighter components of asphalt. As fiber content rises, the specific surface area expands, leading to more asphalt absorption and an increase in OAC. Table 6 displays the OAC% for various fiber lengths and dosages. This OAC increasing trend, as the WJF was increased, is supported by the findings reported by (Al-Saad & Ismael, 2022; Chin & Charoentham, 2021).
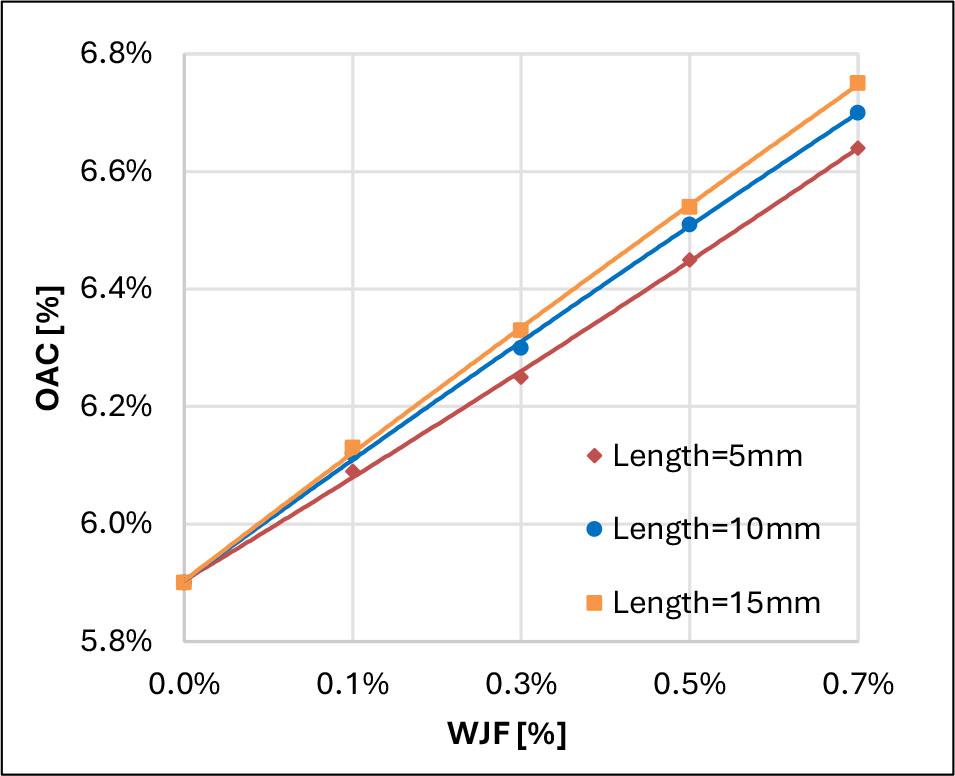
The effect of WJF on OAC
Optimum asphalt content for each mixture
| Length | 5 [mm] | 10 [mm] | 15 [mm] |
|---|---|---|---|
| Dosage | |||
| 0 [%] | 5.90% | ||
| 0.10 [%] | 6.09% | 6.12% | 6.13% |
| 0.30 [%] | 6.25% | 6.30% | 6.33% |
| 0.50 [%] | 6.45% | 6.51% | 6.54% |
| 0.70 [%] | 6.64% | 6.70% | 6.75% |
The test findings demonstrated that the Marshall stability of the asphalt mix initially increased and subsequently decreased with rising fiber content, reaching a peak value at a fiber content of 0.5% and a length of 10 mm, as illustrated in Figure 12. This enhancement is attributed to the superior fiber-matrix interaction at the optimal concentration, where fibers are effectively dispersed and facilitate stress transmission and mechanical interlocking. Adding additional fibers to the asphalt mixture may fail to diffuse uniformly and may clump together, leading to susceptible areas within the mixture and diminished load-bearing capacity. Consequently, Marshall stability decreases with an increase in fiber concentrations. Furthermore, all 10 mm WJF-reinforced mixes exhibit enhanced Marshall stability relative to their 5 mm and 15 mm equivalents. Resulting from the development of a more efficient internal fiber network that improves stress distribution and crack resistance. Conversely, shorter fibers may inadequately bridge, while longer fibers may overlap excessively, reducing contact with the binder. These findings align with the research conducted by (Hassan et al., 2021; Ismael et al., 2022; Naveen Kumar & Sunitha, 2016).
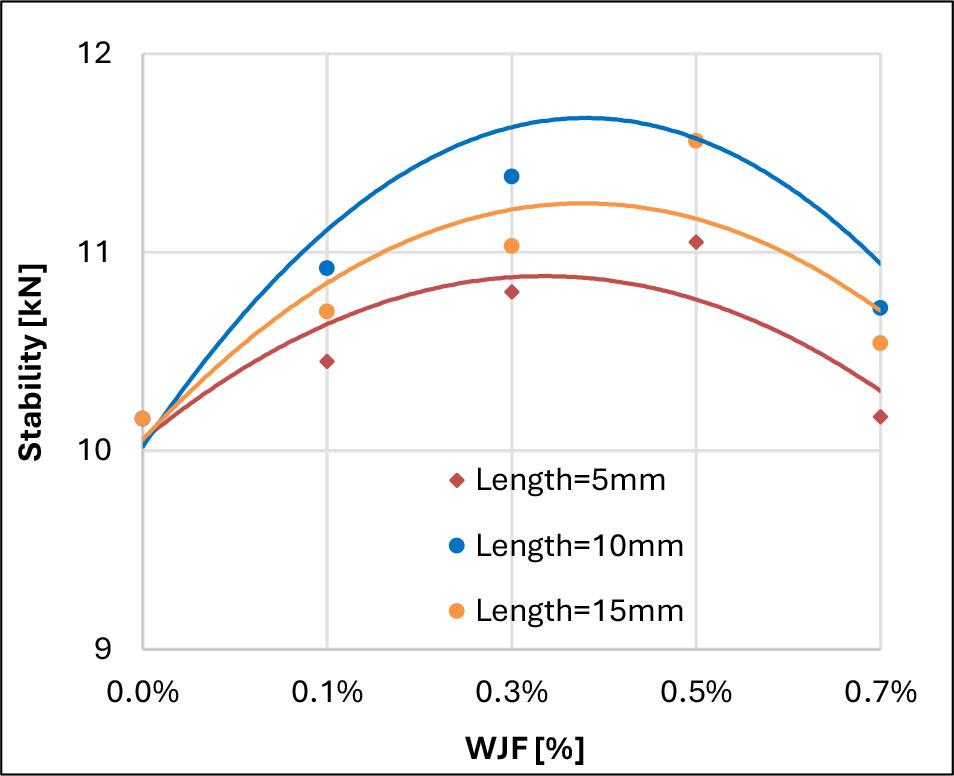
The effect of WJF on Marshall stability
WJF in the SMA mixtures decreased the flow across all proportions and lengths. This is because the mixtures exhibited less flexibility, leading to a decrease in flow value. Figure 13 shows the Marshall flow for all mixes. The largest length reduced the flow due to the increased bonding within the mixture. These outcomes are supported by the findings reported by (Albayati & Ismael, 2023; S. Singh et al., 2022).
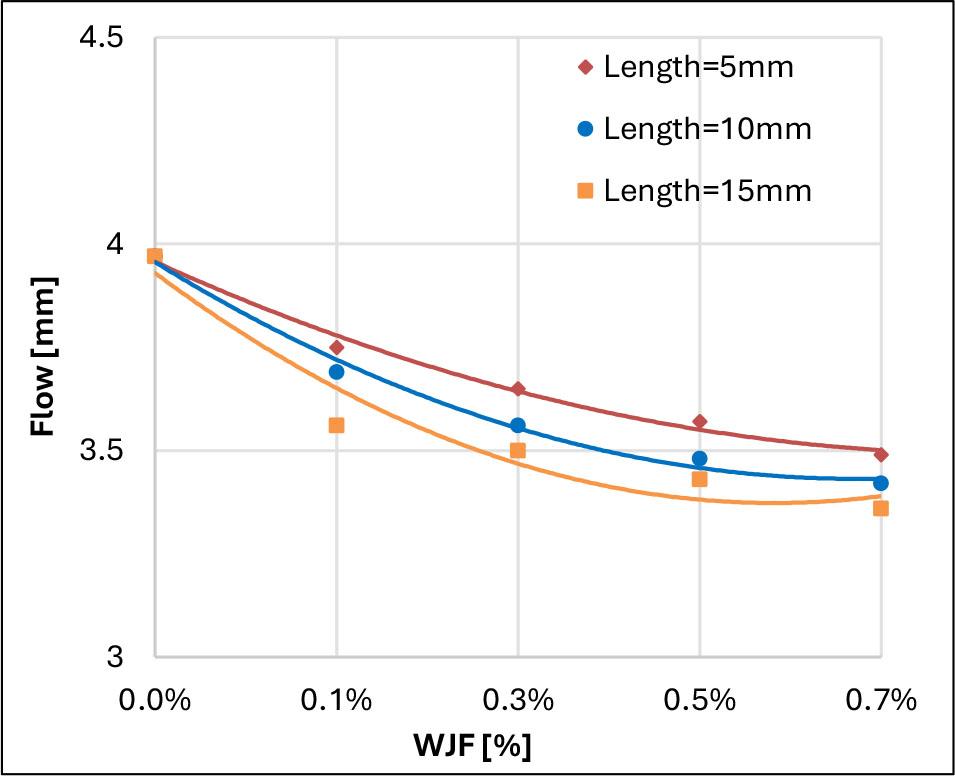
The effect of WJF on the Marshall flow
Incorporating fibers into the mixture decreased its specific gravity since the density of the fibers was lower than that of asphalt and aggregate, as shown in Figure 14. Conversely, fiber has good elastic properties compared to asphalt, hence resisting compaction and the densification of the mixtures. An increase in fiber content and length improved the air voids, VMA, and VFA of the asphalt mixture, as seen in Figures 15 and 16, respectively. This arises from the expanded surface areas (aggregates and fibers) necessitating wetting by the binder; neglecting this would result in an augmentation of voids within the mixture. These outcomes are supported by the findings reported by (Ferreira da Costa et al., 2020; Shanbara et al., 2018).
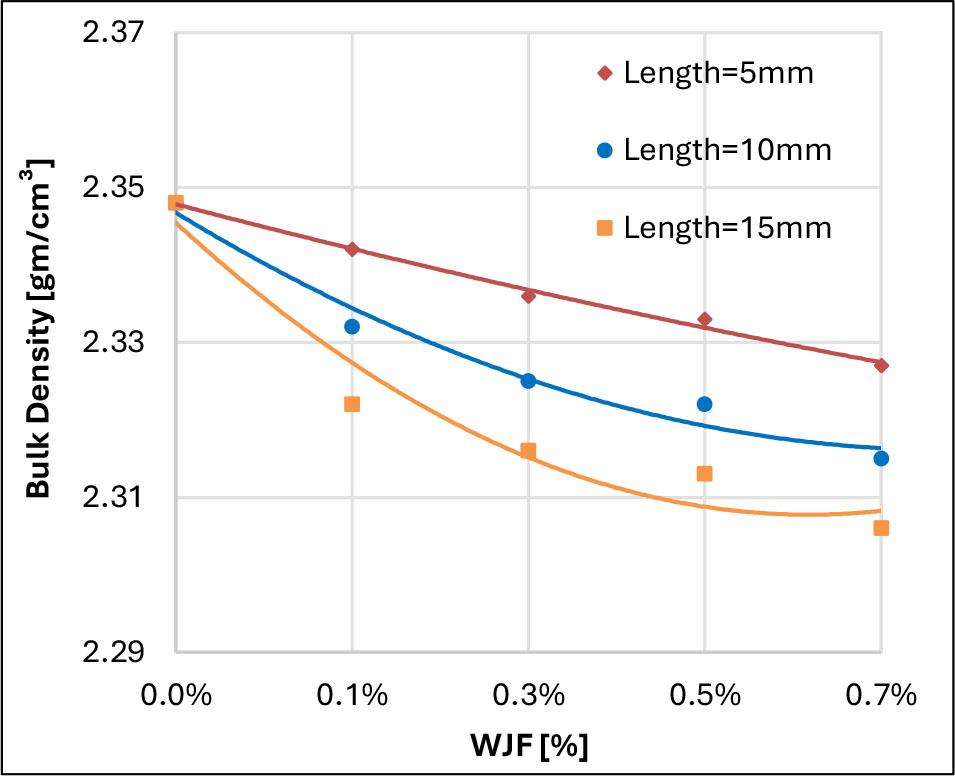
The effect of WJF on bulk density
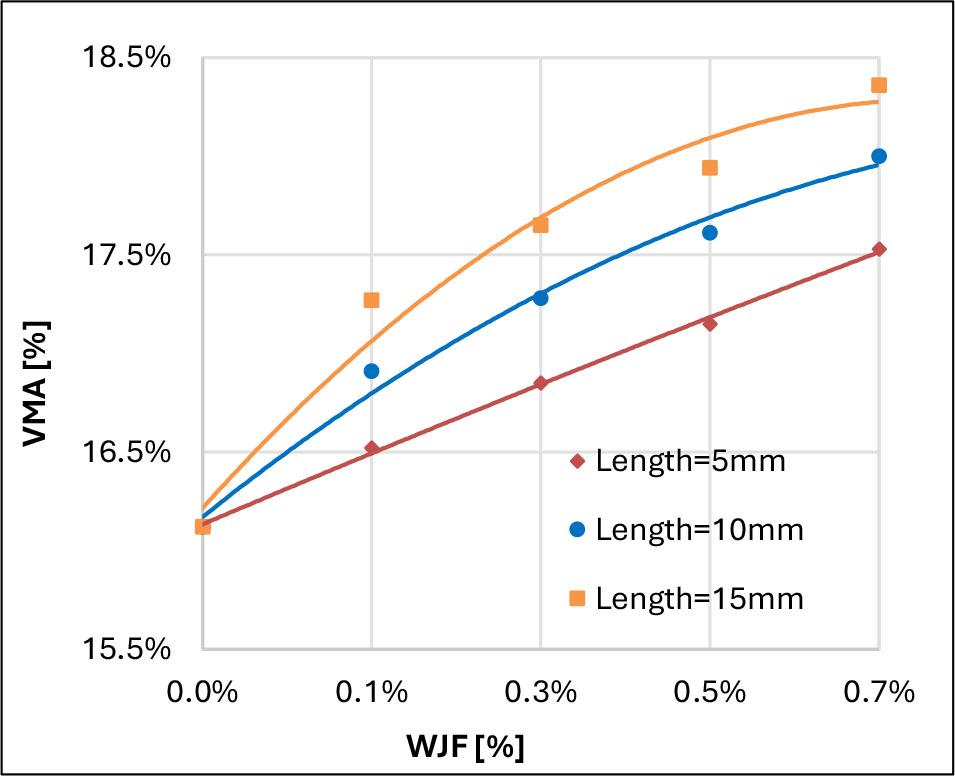
The effect of WJF on VMA%
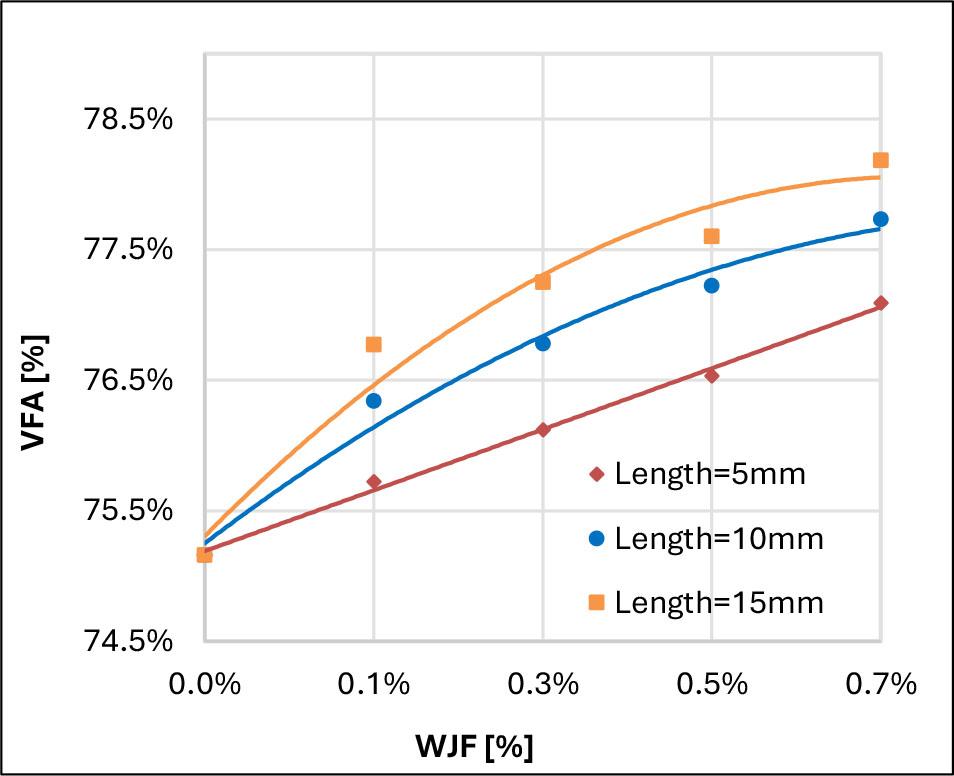
The effect of WJF on VFA
Figure 17 depicts the outcomes of the drain-down test. The initial control mixtures exhibited a significantly higher drain-down value. Typically, increased fiber content reduces the drain-down value. The drain-down magnitude decreased to merely 0.05% with the incorporation of WJF at a concentration of 0.7% and a length of 5 mm. The explanation for this behaviour is related to the natural properties of WJF, which have a somewhat coarse structure that enhances bitumen absorption. The results demonstrated that an increase in length adversely affected the drain-down value for a similar percentage of fibers. This phenomenon can be explained by the observation that as fiber length rises, dispersion decreases, leading to a reduced ability to function as an absorbing membrane. The findings align with the research undertaken by (Devulapalli et al., 2022; Ismael et al., 2022).
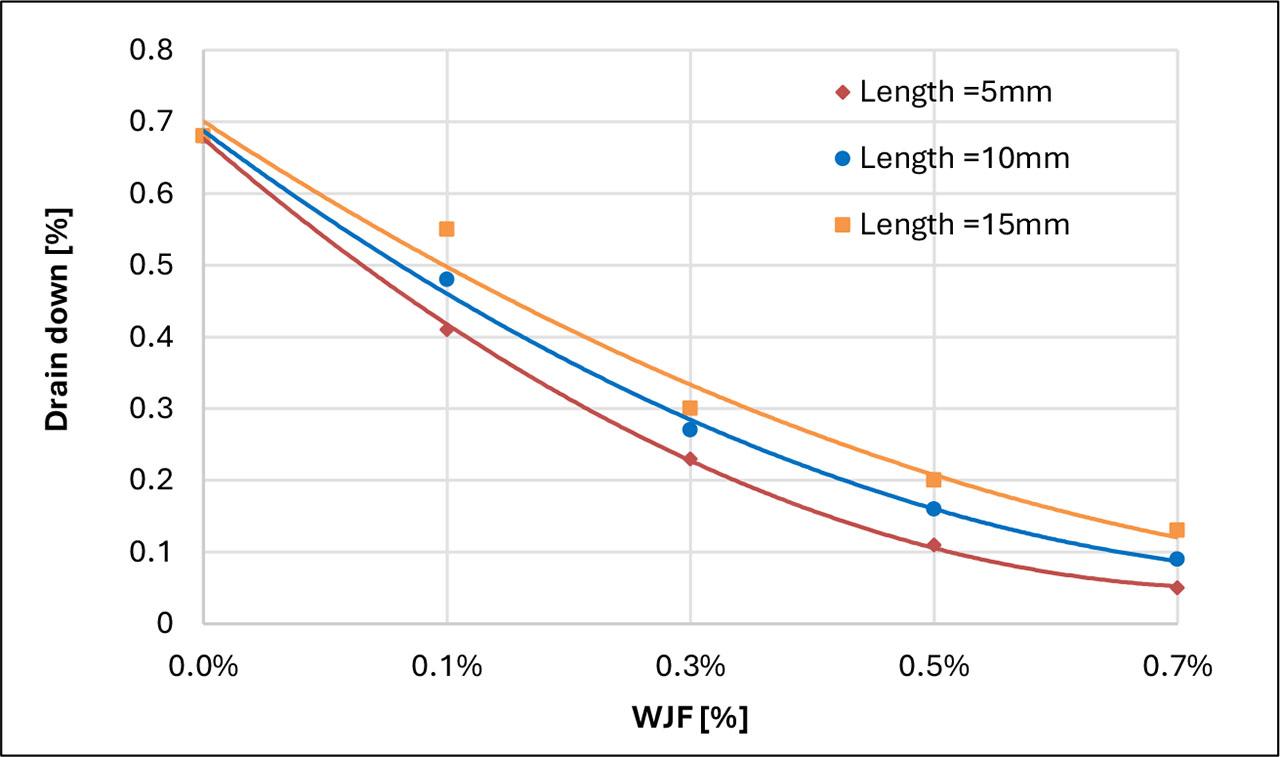
Effect of WJF on drain down
Figure 18 presents the data derived from the ITS test, demonstrating the influence of varying fiber percentages and lengths on ITS values. Incorporating WJF resulted in a rise in ITS up to a dose of 0.5% for all fiber lengths, followed by a decline with additional increments in fiber content. The enhancement results from superior fiber-matrix adhesion and stress transfer, wherein fibers impede crack progression via mechanical interlocking. Additionally, an increase in fiber content led to a higher quantity of fiber observed on the fractured surface, accompanied by diminished adhesion. The ITS of mixes containing all three fiber lengths at a dosage of 0.5% increased that of the control mix by 13.4%,19.24%, and 16.24% for fiber lengths 5mm,10mm, and 15mm, respectively. These outcomes are supported by the findings reported by (Jain et al., 2020; Panda et al., 2013; Sharma & Goyal, 2006).
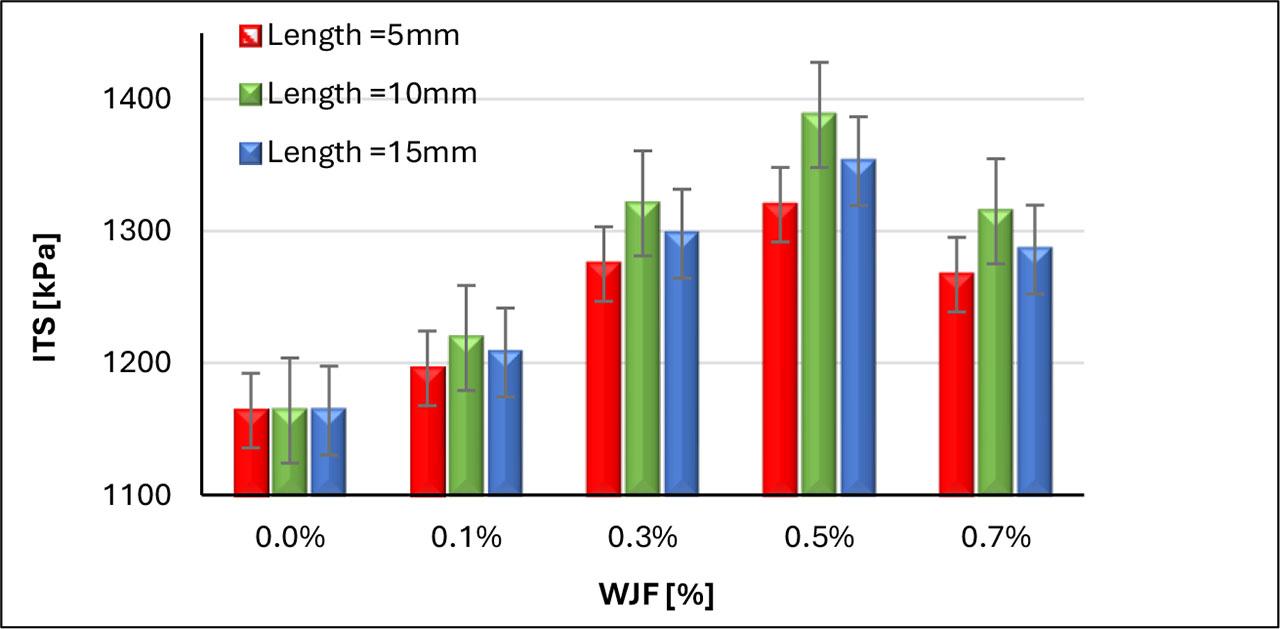
Effect of WJF on ITS
Figure 19 depicts the data acquired from the compressive strength test, showing the impact of different fiber percentages and lengths on compressive strength values, incorporating WJF resulted in an enhancement of compressive strength up to a concentration of 0.5% for all fiber lengths, after which a decline was observed with additional increments in fiber content. This improvement is attributed to enhanced fiber-matrix interaction and stress distribution, with fibers providing internal reinforcement that aids in resisting compressive loads. An augmentation in fiber content led to increased fiber on the cracked surface, accompanied by reduced adhesion. The compressive strength of mixes comprising all three fiber lengths at a dosage of 0.5% exceeded that of the control mix by 15.62%, 21.36%, and 18.7% for fiber lengths 5mm, 10mm, and 15mm, respectively. probably attributable to enhanced network development. These outcomes are supported by the findings reported by (Hussein et al., 2023).
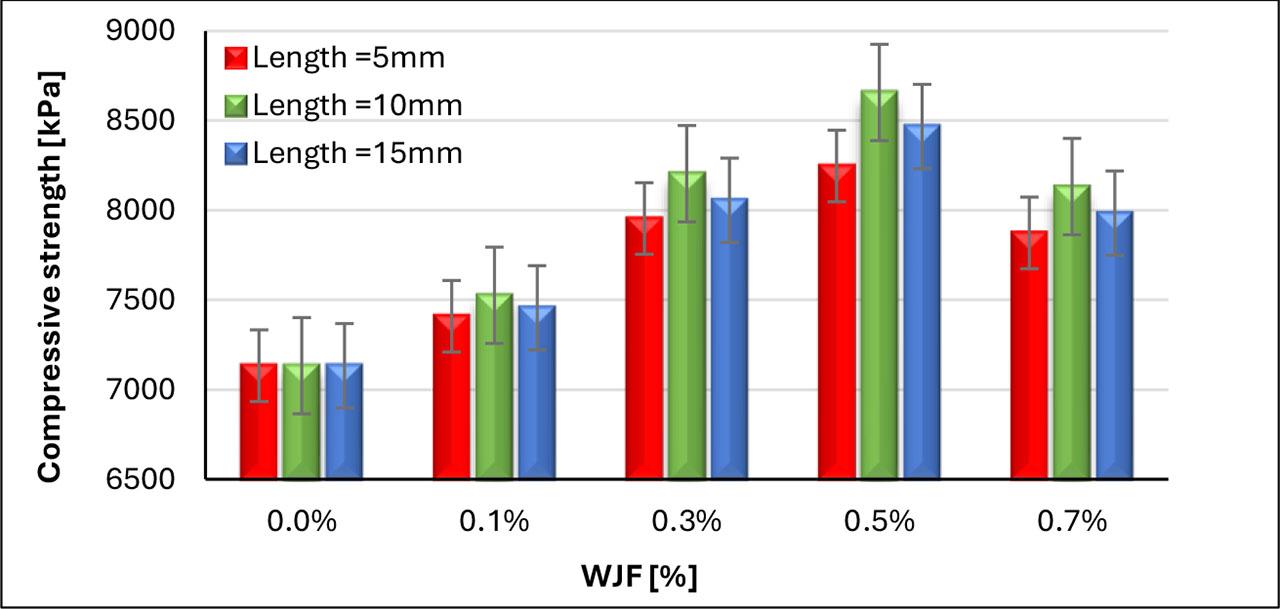
Effect of WJF on compressive strength
The research results revealed that the use of WJF in SMA mix demonstrates a significant enhancement of mechanical properties. This suggests the potential for WJF to be used as a cost-effective and sustainable reinforcement additive in actual road construction. WJF may be recovered from waste textile or packaging material and reused in asphalt mix without the need for new mixing plants. The optimal length and proportion (10 mm and 0.5% by weight) are technologically feasible. Applications involving these fibres also save waste and promote green construction.
Figure 20 shows microscope images (15x magnification) of SMA mixes reinforced with 0.5% WJF at 5 mm, 10 mm, and 15 mm lengths. Stable three-dimensional networks formed by SMA reinforced with WJF allowed the production of an adhesive bituminous layer that prevented asphalt runoff. This structural network can withstand severe temperatures by creating grids connecting fibers between aggregate and binder particles (Hussein et al., 2023; H. Singh et al., 2018). The three lengths differed in fiber distribution, network setup, and asphalt adhesion.
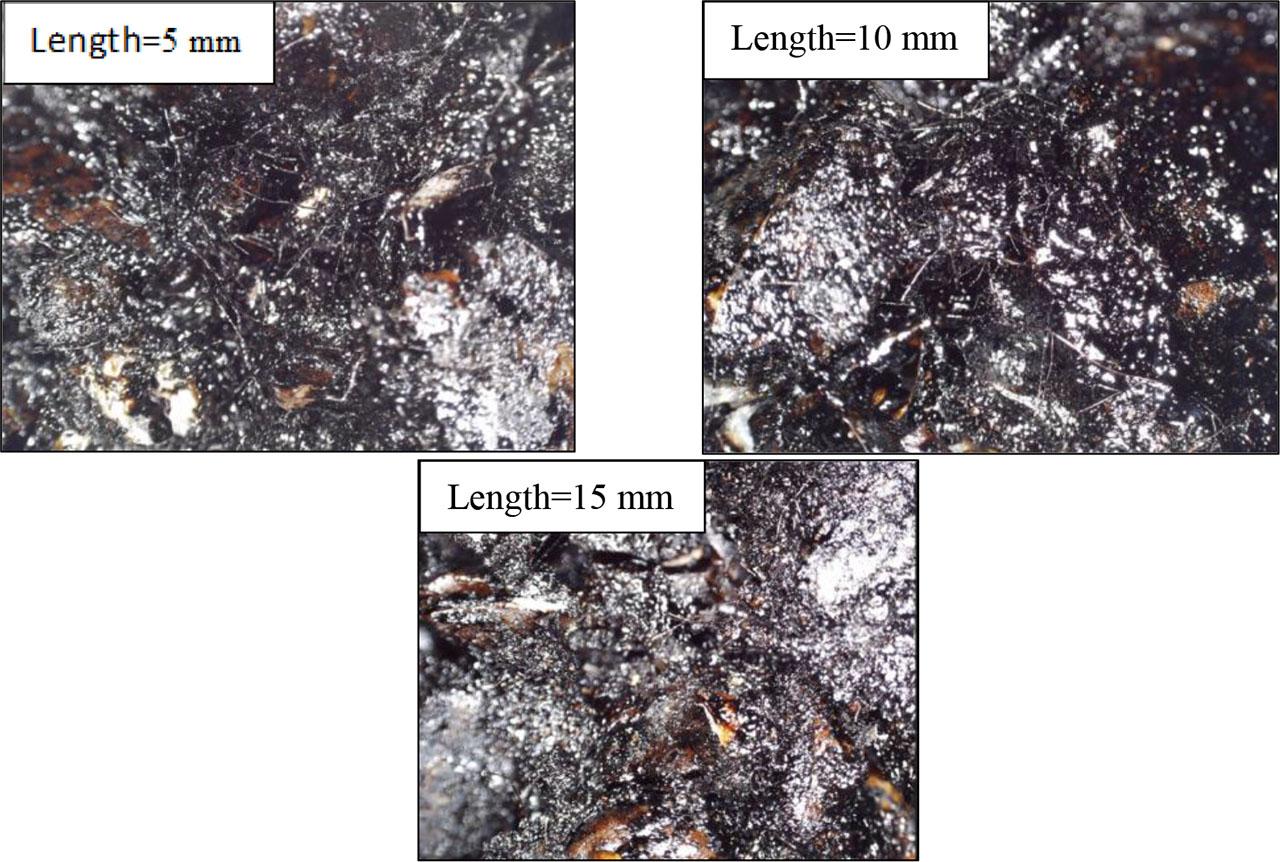
Microscope Images of the SMA mixtures reinforced with WJF at three fiber lengths 5 mm, 10 mm and 15 mm.
The 5 mm fibers were shorter and less entangled, making the fiber-asphalt matrix less cohesive. Their length limited their ability to form continuous 3D networks, reducing asphalt matrix anchoring points. This structure may limit stress transmission and lack load-resistant deformation or fracture.
In contrast, 10 mm fibers had the best dispersion and binder-aggregate entanglement. These fibers formed a strong network that increased asphalt matrix friction. Strong interlocking and adhesion with bitumen prevented moisture infiltration and improved mechanical interlock, reducing rutting and cracking.
Despite their length, 15 mm fibers showed signs of bending or clumping, possibly leading in localized fiber agglomeration. This may reduce asphalt layer uniformity and dispersion. Long fibers may not align well with the aggregate matrix, resulting in inefficient stress distribution.
Multiple linear regression models were developed using SPSS to examine the effect of various mix design variables on the mechanical parameters of the mixture. A distinct predictive model was created to forecast indirect tensile strength (ITS). The ultimate value of ITS was regarded as a dependent variable, whereas the independent variables encompassed fiber content (Fc), fiber length (FL).
Seventy percent of the data (31 samples) was randomly picked for model estimation. After computing the model, it is applied to 30% of the sample data, containing 14 samples, to validate it. Data are normally distributed if the skewness and kurtosis are within ± 3.00 and ± 7.00, respectively (Tabachnick, B. G., & Fidell, 2014). Table 7 shows the regression Coefficients, and Table 8 illustrates the ANOVA test of the build-up model (70% of the dataset).
Regression Coefficients of build-up model (70% of the dataset)
| Model N=14 | Standardized Coefficients | T [-] | P- value [-] | R Square [-] | Skewness [-] | Kurtosis [-] |
|---|---|---|---|---|---|---|
| Beta [-] | ||||||
| (Constant) | 114.937 | 0.000 | 0.893 | −0.203 | −1.074 | |
| length | −0.454 | −7.342 | 0.000 | |||
| WT.FI | 0.827 | 13.381 | 0.000 |
ANOVA test for building the model (70% of the dataset)
| ANOVA | |||||
|---|---|---|---|---|---|
| Model | Sum of Squares [-] | df [-] | Mean Square [-] | F [-] | P- value [-] |
| Regression | 0.115 | 2 | 0.058 | 116.777 | 0.000 |
| Residual | 0.014 | 28 | 0.000 | ||
| Total | 0.129 | 30 | |||
The model's explanatory capabilities were initially assessed to evaluate its appropriateness for predicting indirect tensile strength. Consequently, the ITS model derived from 70% of the dataset was employed to compute the ITS probabilities for the 30% hold-out sample. Table 9 show regression coefficients that the Squared Multiple Correlation (R2) for the ITS model was 0.918, indicating a strong relationship (Moore, D. S., Notz, W., Fligner, M. A., & Linder, 2013) and table 10 present ANOVA test for validity model (30% of dataset).
Regression Coefficients of build-up model (30% of dataset)
| Model N=14 | Standardized Coefficients | t [-] | P- value [-] | R Square [-] | Skewness [-] | Kurtosis [-] |
|---|---|---|---|---|---|---|
| Beta [-] | ||||||
| (Constant) | 75.322 | 0.000 | 0.918 | −0.209 | −1.262 | |
| length | −0.372 | −4.256 | 0.001 | |||
| WT.FI | 0.829 | 9.501 | 0.000 |
Most models adjust their parameters after using 70% of the data to reduce mistakes and improve forecast precision. The remaining 30% is tested. The models' performance was tested using this set after training. R2 evaluated the models on the test set. The entire dataset was used to retrain the models. Allowing access to all data can improve model performance. Table 11 shows regression coefficients, and Table 12 provides an ANOVA test for the validity model (100% of the dataset). The final mathematical model was derived in Equation (4).
ANOVA test for validity model (30% of dataset)
| ANOVA | |||||
|---|---|---|---|---|---|
| Model | Sum of Squares [-] | df [-] | Mean Square [-] | F [-] | P- value [-] |
| Regression | 0.059 | 2 | 0.029 | 61.621 | 0.000 |
| Residual | 0.005 | 11 | 0.000 | ||
| Total | 0.064 | 13 | |||
Regression Coefficients of build-up model (100% of dataset)
| Model N=45 | Standardized Coefficients | t [-] | P-value [-] | R Square [-] | Skewness [-] | Kurtosis [-] |
|---|---|---|---|---|---|---|
| Beta [-] | ||||||
| (Constant) | 140.822 | 0.000 | 0.894 | −0.237 | −1.117 | |
| length | −0.453 | −8.996 | 0.000 | |||
| WT.FI | 0.830 | 16.501 | 0.000 |
Table 10: ANOVA test for validity model (100% of dataset)
| ANOVA | |||||
|---|---|---|---|---|---|
| Model | Sum of Squares [-] | df [-] | Mean Square [-] | F [-] | P- value [-] |
| Regression | 0.172 | 2 | 0.086 | 176.599 | 0.000 |
| Residual | 0.020 | 42 | 0.000 | ||
| Total | 0.192 | 44 | |||
The optimum asphalt content of the SMA mixture rises with the incorporation of WJF. The maximum increase occurred at the 0.7% WJF content and length of 15mm, where the increase in asphalt content was 14.4% over the control mixture.
Incorporating WJF into SMA mixes improves Marshall properties. The stability values increase with fiber length and content to a threshold and then decrease. The highest stability level increase was 19.09% at the WJF content of 0.5% and length of 10mm.
Incorporating WJF in the SMA mixtures decreases the flow values across all proportions and lengths. The highest decrease in the flow was 15.36%, with the WJF content of 0.7% and length of 15mm.
Higher WJF doses resulted in a decrease in the drain-down. For the same fiber fraction, the drain-down decreased with shorter fiber length. The highest decrease occurred when the drain down reached only 0.05% at WJF content of 0.7% and a length of 5 mm.
All WJF combinations exhibited higher ITS and compressive strength than those without fibers. The 0.50% and 10 mm fiber length composition gave the highest ITS improvement by 19.24% and compressive strength by 21.36% over the control mixture.
Environmentally, the use of WJF is an eco-friendly option by making use of waste textile, lessening environmental pollution, and encouraging environmentally friendly road construction practices.
This study focused on assessing the fundamental mechanical properties of SMA mixes reinforced with used WJF in three specified lengths (5 mm, 10 mm, and 15 mm) and four percentages (0.1%, 0.3%, 0.5%, and 0.7%), excluding considerations of the mix's longevity under diverse environmental conditions. Consequently, future research is advised to perform a thorough assessment of the effect of WJF on durability characteristics, encompassing moisture resistance, resistance to permanent deformation (rutting), long-term durability under traffic loads, and the behaviour of mixtures under short and long term aging, to guarantee consistent performance of the asphalt mix under realistic operational conditions.