

Southeast Asia reports the highest global crash fatalities involving motorized two and three-wheelers. According to the World Health Organization [1], 48% of all road traffic deaths in the region were attributed to crashes involving these vehicle types in 2021. This disproportionately high figure underscores the extensive use of motorcycles across Southeast Asia and highlights the considerable exposure of motorcyclists to traffic-related hazards. The prevalence of motorcycles is driven by their affordability, manoeuvrability in congested urban environments, and accessibility for individuals across diverse socioeconomic backgrounds.
Thailand exemplifies this trend, where motorcycles are not only utilized for personal mobility but also serve as a fundamental component of informal and formal transport services, including motorcycle taxis and delivery operations. Data from the Department of Land Transport [2] indicate a consistent upward trend in motorcycle registrations, reaching approximately 22.6 million units in 2023, equivalent to 51% of all registered vehicles in the country. However, this widespread reliance on motorcycles has significant implications for road safety. In 2023, motorcyclists accounted for approximately 80% of all road traffic fatalities in Thailand [3], revealing the severe vulnerability of this group within the national traffic system.
The safety of other road users, particularly pedestrians is also adversely affected by the high density of motorcycles. Notably, pedestrian fatalities in Bangkok due to collisions with motorcycles accounted for 49% of the total in 2023 [3], suggesting a critical and under-addressed safety issue. These crashes frequently occur at unsignalized mid-block crosswalks, where the lack of traffic control devices increases the likelihood of conflict between road users. Such environments present risks, as they rely heavily on mutual awareness and compliance with traffic laws, which are often inconsistently observed. At present, the primary consideration in the design of integrated transport infrastructure is ensuring safety [4].
Empirical evidence from a behavioural study was conducted by ThaiRoads revealed that only 8% of motorcyclists yielded to pedestrians at unsignalized mid-block crosswalks, despite legal mandates requiring drivers to slow down or stop when pedestrians are present [5]. This non-compliance raises serious concerns regarding road user behaviour, legal enforcement, and the effectiveness of current infrastructure in ensuring pedestrian protection. The low rate of compliance also suggests systemic issues related to risk perception, cultural attitudes toward traffic regulations, and the prioritization of vehicular over pedestrian movement.
In response to these challenges, the present study aims to investigate the behavioural factors influencing motorcyclists’ decision-making when encountering pedestrians at unsignalized mid-block crosswalks in Bangkok, Thailand. These locations are particularly prone to collisions due to their geometric design and the absence of active traffic control. Although legal provisions require motorcyclists to yield to pedestrians, observational data suggest that a substantial proportion of motorcyclists engage in risky behaviour, such as failing to decelerate or attempting to cross before pedestrians, thereby increasing the likelihood of injury or fatality for both parties.
Understanding the determinants of motorcyclist behaviour at unsignalized mid-block crosswalks is essential for advancing pedestrian safety, informing urban traffic management strategies, and guiding evidence-based policymaking. The findings contribute to the development of design guidelines that emphasize geometric features and promote safety policies aimed at reducing conflicts between motorcyclists and pedestrians, thereby improving the overall safety of the urban transportation network.
Numerous studies have aimed to identify the factors that influence gap acceptance behaviour. For example, there is an analysis related to how drivers select gaps when turning left across pedestrian flows at signalized crosswalks [6]. This study employed a cumulative Weibull distribution to model the probability of gap acceptance, considering the direction pedestrians were moving. The findings indicated that drivers are more inclined to accept shorter lags or gaps when pedestrians are approaching from the near side of the crosswalk. Another study explored gap acceptance behaviour of turning vehicles at a signalized intersection within a university campus, incorporating the interaction among vehicles, pedestrians, and cyclists [7]. The study concluded that heavier vehicles such as buses, vans, and trucks exhibit larger critical gap values compared to smaller passenger vehicles.
Other studies have investigated vehicle-pedestrian dynamics at unsignalized or mid-block crossings. For instance, [8] applied logit and probit models to study driver yielding behaviour and pedestrian gap acceptance using empirical data from an unsignalized crossing. This study discovered that drivers are more likely to yield to groups of pedestrians and that drivers of heavier vehicles are more inclined to yield than those in lighter vehicles. Similarly, [9] developed a logistic regression model to assess driver yielding at unsignalized crosswalks. The model factored in vehicle speed, distance to the crosswalk, pedestrian assertiveness, vehicle platooning, and the presence of crossing infrastructure. Results showed that assertive pedestrians increase the likelihood of driver yielding, whereas vehicles traveling in platoons decrease it.
While extensive research has been conducted on gap acceptance, most studies have cantered on car drivers’ decision-making processes. Gap acceptance generally refers to how drivers or riders assess opportunities to merge or cross traffic, particularly at conflict points such as intersections, highway on-ramps, and pedestrian crossings. [10] examined driver behaviour in response to bicycles, whereas [11] investigated gap acceptance decisions involving cars and motorcycles at junctions. Other researchers have proposed frameworks to assess gap acceptance in the context of vehicle-pedestrian interactions, particularly during turning movements [6, 7, 12]. Advances in modelling approaches, such as the use of logistic regression, time-to-collision metrics, and stochastic models, have provided deeper insight into driver and rider decision-making. For example, [13] used hierarchical Bayesian models to evaluate lane-changing behaviour and associated gap acceptance in dense traffic.
Two key temporal measures are integral to the concept of gap acceptance: lag and gap [14]. In vehicle-pedestrian conflicts, [6] defined a lag as the time taken for a pedestrian to reach the conflict area, while a gap refers to the time interval between two pedestrians, measured from the exit of the first to the entry of the second into the conflict zone. These intervals determine whether a driver can manoeuvre safely through the crossing. In cases where no suitable lag or gap is available, drivers must slow down or stop until a safe opportunity arises. [12] also examined right-turning vehicle-pedestrian interactions and classified lag as the time between a vehicle passing the conflict point and the arrival of a pedestrian or group. A gap was defined as the time between successive pedestrian groups leaving and entering the conflict zone. Similarly, [7] described lag as the time taken for a vehicle to reach the conflict area. These temporal gaps reflect the severity and complexity of potential conflicts.
Although there is extensive research on gap acceptance, there has been relatively little research on motorcyclist behaviour, particularly in developed countries where motorcycles are not widely used. Few studies have examined the behaviour of motorcyclists in mixed traffic environments, particularly in developing cities [15, 16]. [15] assessed the critical gaps required by motorcyclists at priority-controlled junctions. The findings showed that motorcyclists accept significantly shorter gaps than other vehicle types. [16] studied two-wheeler behaviour at uncontrolled T-intersections using logit modelling. This study found that younger riders are more likely to accept a smaller gap, as well as when the other vehicle is a two-wheeler or when both conditions apply. Similar patterns of risk acceptance were observed in the work of [17], who investigated vulnerable road user interactions in mixed traffic environments.
A review of existing literature reveals a lack of prior research specifically examining how motorcyclists respond to pedestrians at unsignalized mid-block crosswalks. To address this gap, the present study investigates the factors that influence motorcyclists’ decision-making, including motorcyclist characteristics and the physical features of the crosswalk, particularly in the context of developing countries with heterogeneous traffic environments.
Gap acceptance behaviour and associated variables were observed at eight unsignalized mid-block crosswalks in Bangkok, as illustrated in Fig. 1a, each exhibiting different geometric configurations. All selected locations were multi-lane roads and included variations in median design; specifically, crosswalks with no median and those with raised medians. To assess the potential impact of visibility, crosswalks with different colour patterns (black-white and red-white) were also included. Sample images of the crosswalk colours are shown in Fig. 1b and 1c. Data were collected for a single direction at each site over a three-hour period during peak pedestrian activity, under normal weather conditions, using video recordings.
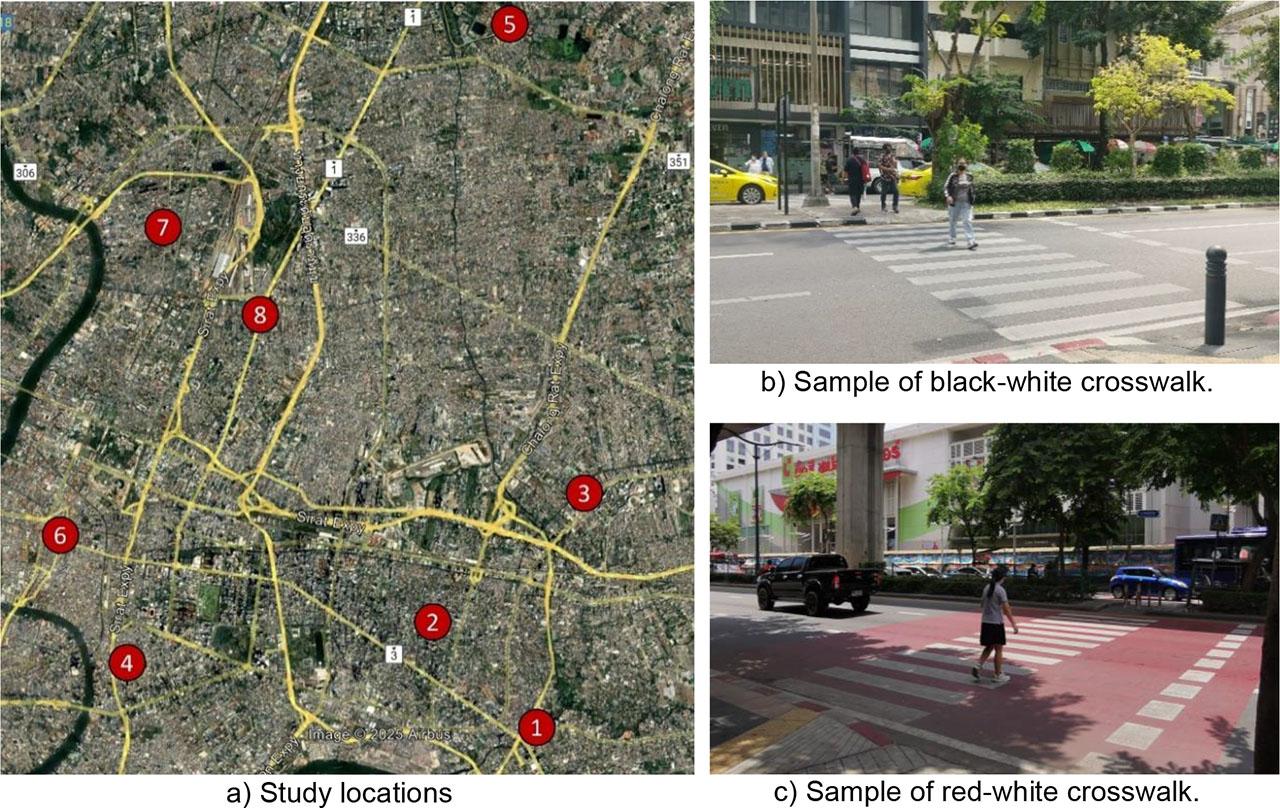
Study locations and samples of crosswalk colours.
The crosswalk locations were selected based on multiple criteria to ensure the reliability and consistency of observational data. These criteria included consistent pedestrian activity during observation period, unobstructed roadside visibility, feasible camera placement for clear video capture, and the presence of pedestrian crossing warning signs. The selected crosswalks are located on roads functionally classified as primary arterials and collectors within Bangkok’s urban network, reflecting high to moderate traffic volumes. All sites are located within commercial or business districts in Bangkok, where pedestrian crossing activity is frequent during daytime hours. Table 1 outlines the characteristics at each site, while Fig. 2 provides a schematic of a typical unsignalized mid-block crosswalk and the corresponding camera placement.
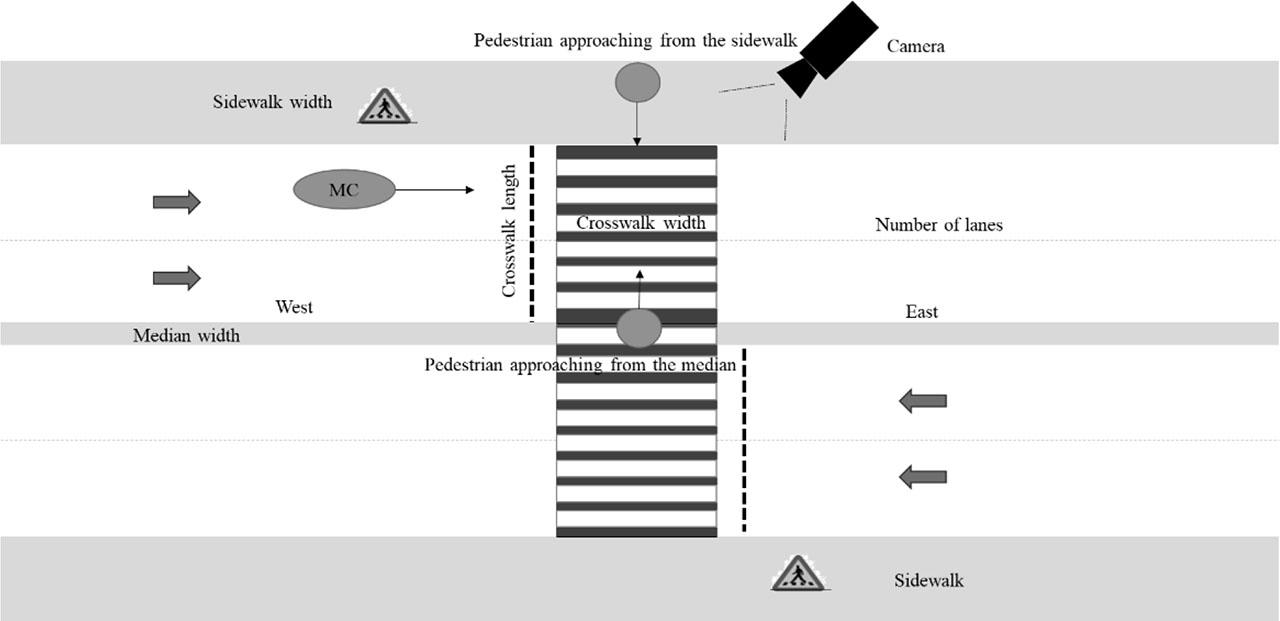
Schematic of the unsignalized midblock crosswalk and video camera set up.
Crosswalk characteristics.
| Crosswalk No. | Functional classification | Geometry | Traffic | |||||
|---|---|---|---|---|---|---|---|---|
| Crosswalk width and length [m] | No. of lanes | Median types | Crosswalk colors | MC | PC | Pedestrians | ||
| [veh/h] | [ped/h] | |||||||
| 1 | Collector Rd. | 7.00*15.00 | 4 lanes | No median | Black-white | 722 | 654 | 445 |
| 2 | Arterial Rd. | 5.00*17.00 | 6 lanes | No median | 1034 | 875 | 201 | |
| 3 | Arterial Rd. | 5.50*6.50 | 4 lanes | Raised median | 1305 | 952 | 288 | |
| 4 | Arterial Rd. | 5.40*9.00 | 6 lanes | Raised median | 779 | 889 | 1725 | |
| 5 | Arterial Rd. | 9.00*14.00 | 4 lanes | No median | Red-white | 755 | 807 | 387 |
| 6 | Collector Rd. | 9.00*18.00 | 6 lanes | No median | 1144 | 750 | 129 | |
| 7 | Arterial Rd. | 9.00*6.50 | 4 lanes | Raised median | 872 | 641 | 229 | |
| 8 | Arterial Rd. | 9.00*10.00 | 6 lanes | Raised median | 1189 | 873 | 140 | |
This study collected data through field observations and video recordings. Crosswalk geometry was assessed through on-site surveys, and a summary of these features is provided in Table 1. Fig. 3 presents the modal share of traffic at each crosswalk location, based on observed traffic volumes obtained through video footage analysis and standardized in terms of passenger car units per hour (PCU/h). The video equipment was used to capture motorcyclists’ gap acceptance times and their behavioural responses; specifically, whether they chose to stop when encountering pedestrians at unsignalized mid-block crosswalks, as illustrated in the movement diagram in Fig. 4.
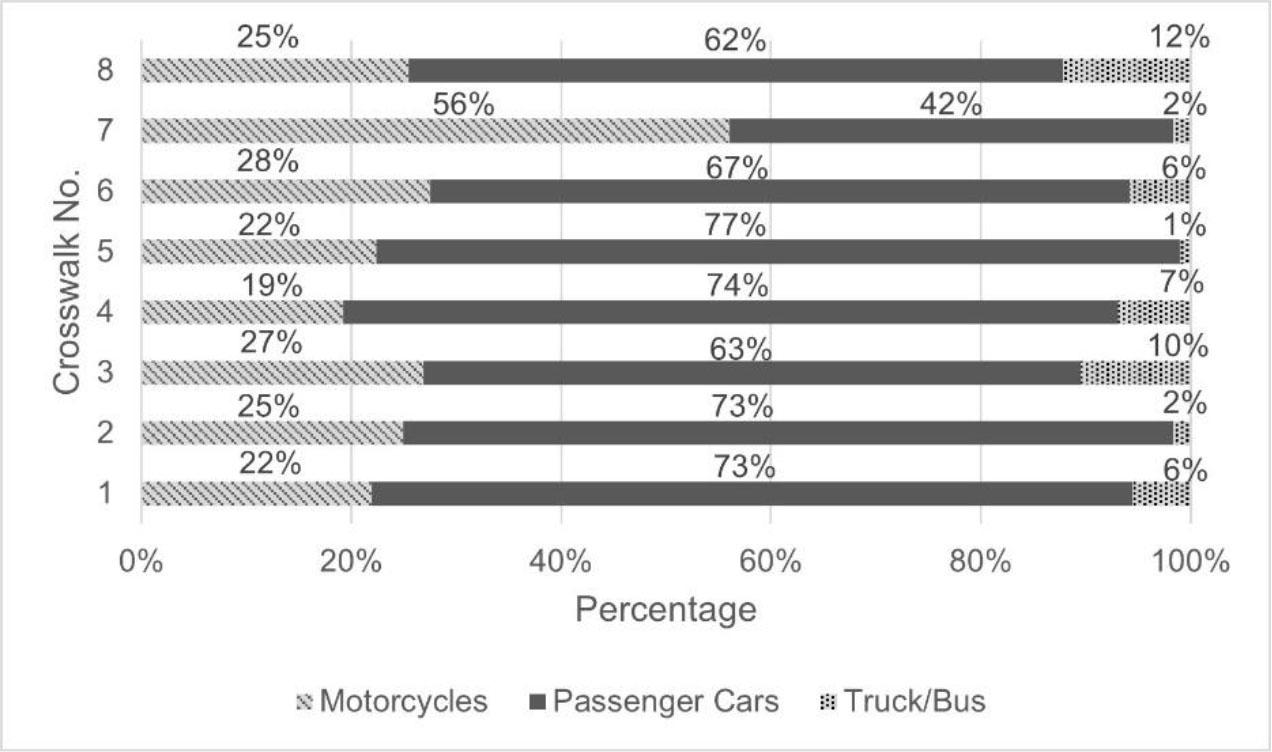
Mode share at the selected crosswalks.
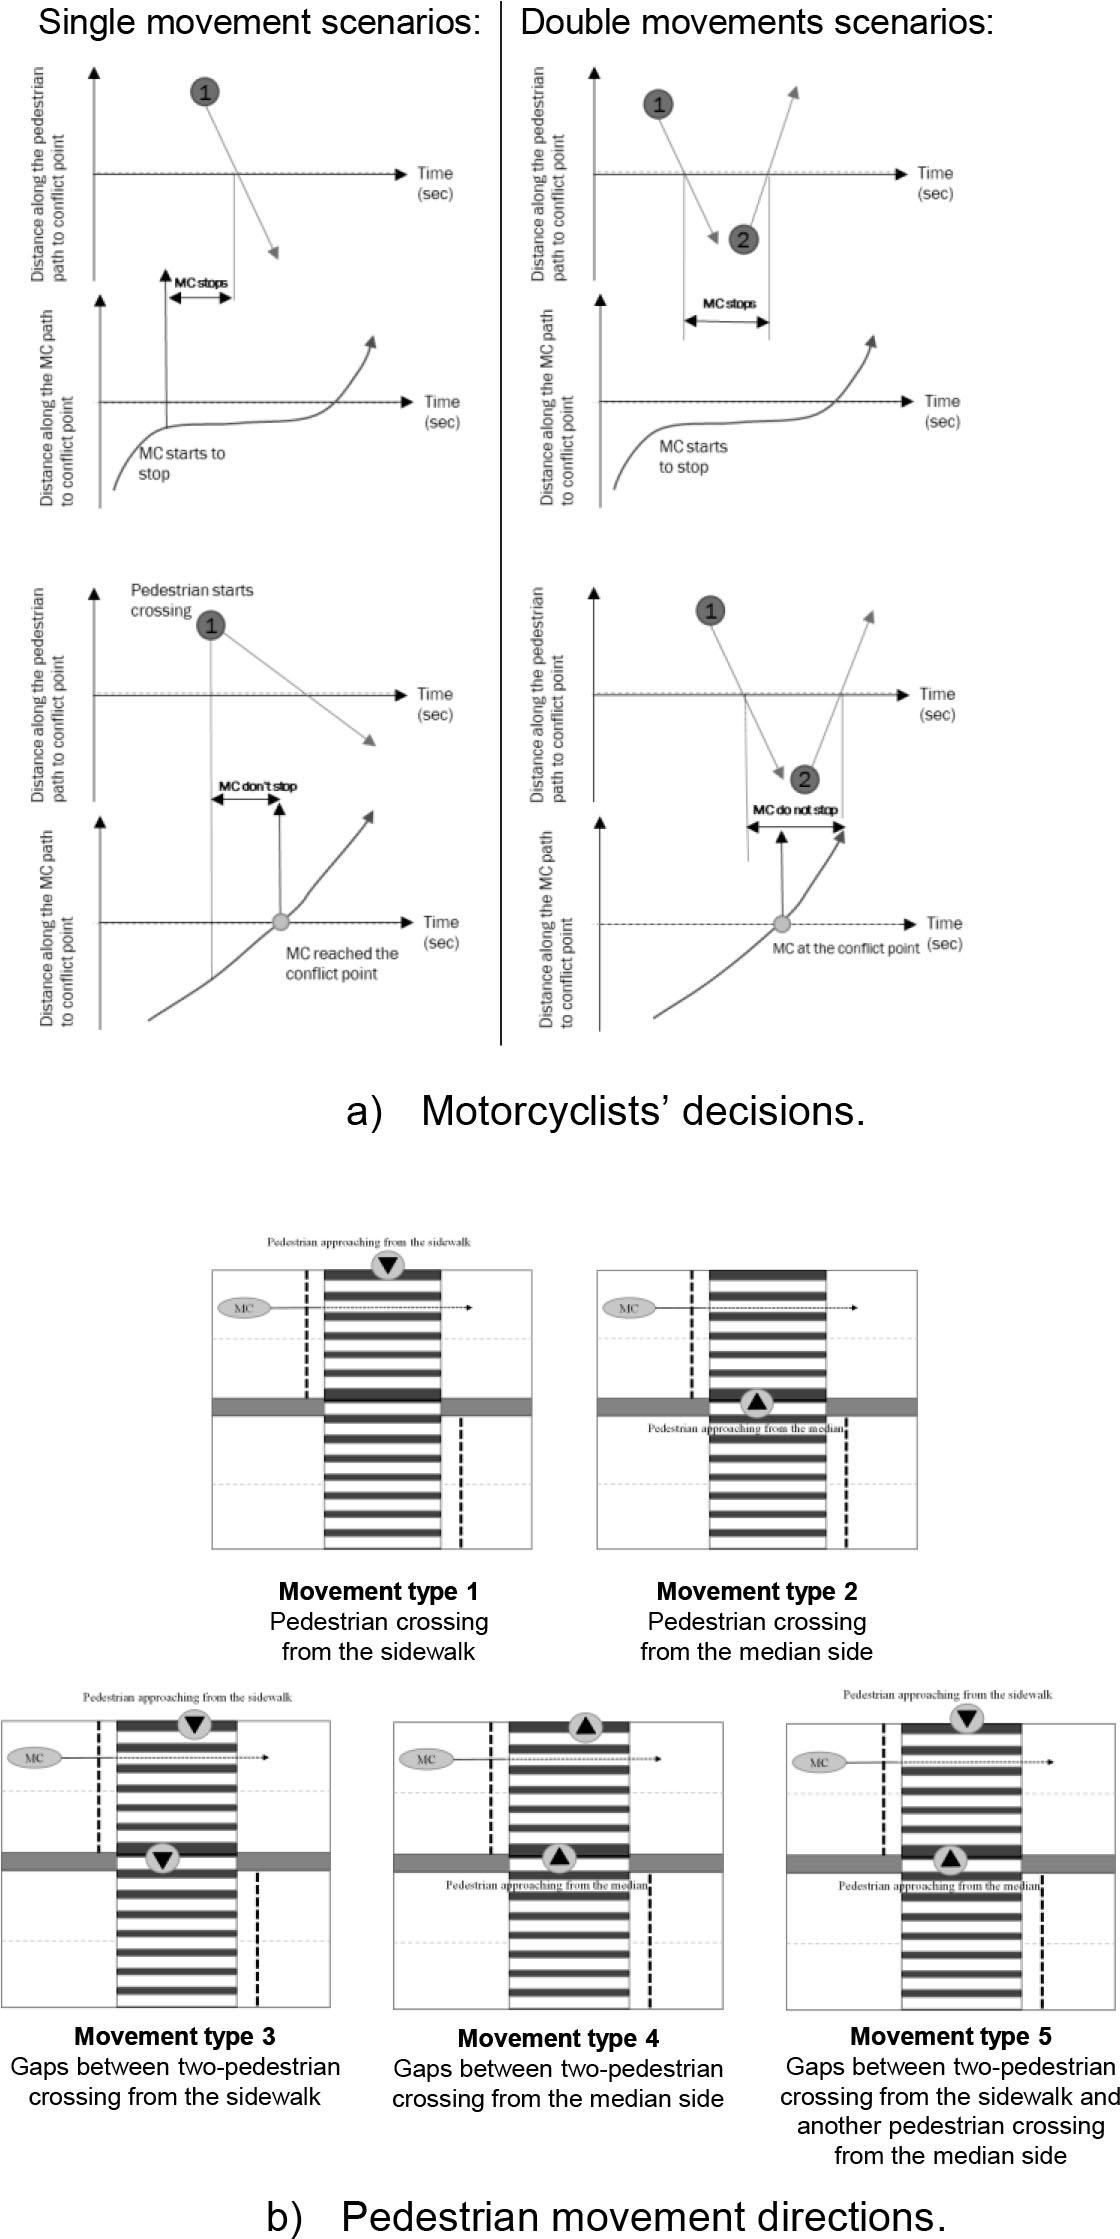
Motorcyclists’ decisions and the pedestrian movement directions.
Several contributing variables were recorded, including the headway (in seconds), the direction of pedestrian movement (categorized into five types), characteristics of motorcyclists (motorcyclist age, motorcycle types and presence of pillion passengers), surrounding traffic conditions (e.g., nearby vehicles), and the number of pedestrians crossing. Pedestrian movement directions were categorized into five types based on their point of entry. Type 1 refers to pedestrian entering the crosswalk from the sidewalk, while Type 2 involves pedestrian entering from the median side. These two are classified as single movements, representing the time a motorcycle takes to reach the conflict point when a single pedestrian enters the crosswalk. Type 3, 4, and 5 fall under the category of double movements, which involve sequential pedestrian entries. Type 3 captures the time gap between two pedestrians crossing consecutively from the sidewalk; Type 4 involves two pedestrians crossing in sequence from the median side; and Type 5 accounts for scenarios where one pedestrian enters from the sidewalk and another from the median side. In these double movement cases, the interval between the first and second pedestrian entering the crosswalk constitutes the relevant time gap used in the analysis.
Motorcyclist age was approximated through visual assessment of their physical characteristics and classified into two age groups: young and older riders. Motorcycle types were grouped into three types: standard motorcycles, delivery motorcycles, and motorcycle taxis. Motorcycle rider and passengers per motorcycle (pillion passengers) ranged from a solo rider to three or more individuals. The proximity of other vehicles nearby a motorcyclist was recorded based on their relative positioning of other vehicles nearby a motorcyclist at the time of observation. This variable was categorized into four categories based on the location of surrounding vehicles: no nearby vehicle, a vehicle to the left, a vehicle to the right, or vehicles on both sides of a motorcyclist. The number of pedestrians was categorized as either a single pedestrian or multiple pedestrians crossing simultaneously. All these variables were manually extracted from video footage. Overall, 1,957 motorcyclists were documented across the studied locations.
In this study, video evaluation was conducted using a standardized scenario observation to ensure consistency and minimize subjective interpretation. Scenario schemes were applied to identify specific behaviours of motorcyclists and pedestrians, as illustrated in Figure 4, thereby reducing ambiguity during data extraction. To minimize subjectivity, all cases were collected when pedestrians start crossing, defined as taking their first step onto the crosswalks without hesitation. In case of pedestrians are waiting on the sidewalk without attempting to cross were excluded. Additionally, data collection was carried out only during periods of flowing traffic; situations involving traffic jams with no vehicle movement were not considered. Near-miss situations, such as motorcyclists immediately changing lanes or passing behind pedestrians without stopping, were also not included from the analysis.
Fig. 4 illustrates the classification of motorcyclists’ decisions (Fig. 4a) and pedestrian movement directions (Fig. 4b). Pedestrian movement directions at crosswalks were grouped into five types. Type 1 and 2 are classified as single movements, where the analysis focuses on the time a motorcyclist needs to reach the conflict point after a pedestrian step onto the crosswalk. If the motorcyclist comes to a full stop, the time from stopping to the pedestrian’s arrival is recorded. If the motorcyclist slows down instead of stopping, the time is recorded at the point of deceleration. Type 3, 4, and 5 are categorized as double movements, the time gap is measured from when the first pedestrian leaves the conflict point to when the second enters it. In cases where the gap is insufficient, the motorcyclist is expected to slow down or stop, waiting for a safe opportunity to proceed.
The conflict area in this study refers to the path on the crosswalk traversed by motorcycles. If a motorcyclist passes through this zone without stopping when pedestrians are present, the event is recorded as “not stop”; if the motorcyclist stops, it is recorded as “stop.” These behavioural outcomes, combined with precise timing data obtained from video analysis, form the basis for evaluating motorcyclists' decision-making at mid-block crosswalks.
The contributing factors related to motorcyclists are examined using a binary logistic regression model. Motorcyclist behavior is conceptualized as a binary outcome: a decision to proceed without stopping (=0) or to stop (=1). This probability is modeled as a function of a linear combination of explanatory variables, represented within a utility function. The likelihood that motorcyclist k selects alternative i is expressed in Equation (1):
The utility associated with selecting alternative i is presented by Ui and is defined in Equation (2):
Ui is the utility associated with selecting alternative i,
i is the alternative (not stop/stop),
n is the number of independent variables,
α is a constant value,
X are the set of independent variables affecting motorcyclists’ decisions,
β are the corresponding coefficients for these variables.
A hypothesis test with a 95% confidence level was conducted to assess the statistical significance of the results across different variable combinations.
A binary logistic regression model was applied to identify the factors influencing motorcyclists’ gap acceptance when encountering pedestrians at unsignalized mid-block crosswalks. The analysis considers variables related to crosswalk geometry, motorcycle characteristics, and pedestrian movements. The motorcyclist’s decision to stop for pedestrians is the dependent variable. Definitions of all variables included in the model are provided in Table 2.
List of variables.
| Variables | Definition | Values | % Observation |
|---|---|---|---|
| Dependent variable | |||
| Motorcyclists’ decisions | Stop | 1 | 54% |
| Not stop | 0 | ||
| Independent Variables | |||
| Headway | Time in seconds | Continuous variable | |
| Pedestrian movement directions | Movement type 2 | 1 | 26.5% |
| Movement type 3 | 2 | 7.7% | |
| Movement type 4 | 3 | 14.1% | |
| Movement type 5 | 4 | 18.6% | |
| Movement type 1 | 0 | ||
| Motorcycle rider and pillion passengers | Only rider | 1 | 78.5% |
| Otherwise | 0 | ||
| Type of motorcycle | Standard motorcycles | 1 | 71.0% |
| Delivery motorcycles | 2 | 17.2% | |
| Motorcycle taxis | 0 | ||
| Motorcyclist age | Old motorcycle riders | 1 | 24.5% |
| Young motorcycle riders | 0 | 75.5% | |
| Proximity of other vehicles nearby a motorcyclist | Left | 1 | 7.6% |
| Right | 2 | 23.1% | |
| Both sides | 3 | 4.0% | |
| None | 0 | ||
| Number of crossing pedestrians | Multiple pedestrian | 1 | 69.7% |
| Single pedestrian | 0 | ||
| Median types | Raised median | 1 | 53.4% |
| No median | 0 | ||
| Crosswalk colors | Red-white crosswalk | 1 | 40.3% |
| Black-white crosswalk | 0 | ||
The distribution of headway time (in seconds) and the percentage of occurrences within each time interval represents in Fig. 5. This distribution shows that shorter time intervals are far more frequent, specifically 68% of the observations fall within the first second, followed by 20% in the second and 7% in the third. Beyond this point, the percentages drop sharply, with less than 3% occurring in each subsequent second. Such a pattern is typical in phenomena characterized by rapid initial responses, such as reaction times or vehicle headways [18]. Fig. 6 presents charts comparing motorcycle stopping rates across different pedestrian movement directions and crosswalk design features, specifically crosswalk colors (Fig. 6a) and median types (Fig. 6b). These visualizations indicate that movement type 1 and 2, red-white crosswalks and crosswalks without median are associated with higher stopping rates compared to black-white crosswalks and raised median. Conversely, movement type 3, 4, and 5 show higher stopping rates at black-white crosswalks and those with raised median.
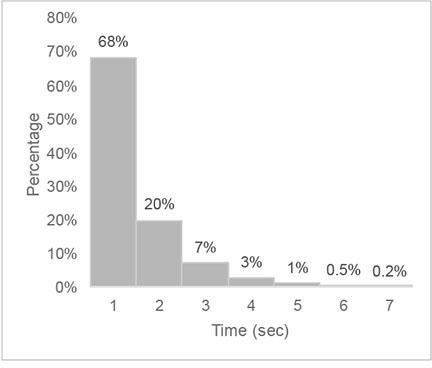
Distribution of headway time.
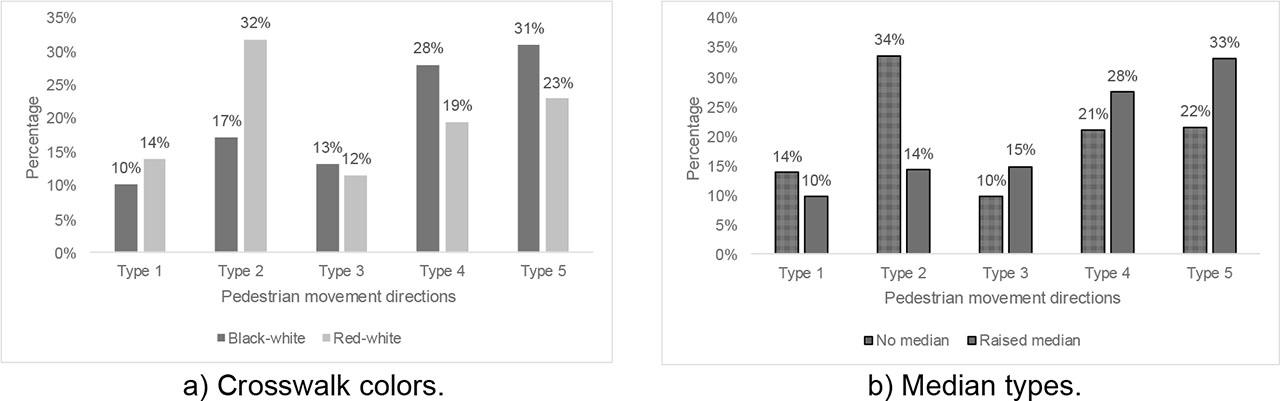
Stopping rates across different pedestrian movement types and crosswalk design features.
The binary logistic regression analysis, presented in Table 3, identifies the key factors influencing motorcyclists’ decisions to stop at unsignalized mid-block crosswalks. The model reveals that several variables significantly affect gap acceptance behavior, particularly headway time, pedestrian movement directions, proximity of other vehicles nearby a motorcyclist, number of crossing pedestrians, and crosswalk colors. Motorcyclists exhibit a higher propensity to stop when the available headway is reduced, suggesting that shorter temporal gaps between motorcyclists and approaching pedestrians significantly increase the likelihood of stopping behavior. Among the most influential variables are the pedestrian movement directions, which significantly affects whether motorcyclists stop. The study categorized pedestrian movement directions into five types, with movement type 1 (crossing from the sidewalk) used as the baseline. Motorcyclists are progressively more likely to stop in response to other movement types:
Movement type 2 (crossing from the median side) has a moderate positive effect, suggesting that motorcyclists tend to stop more frequently when pedestrians enter from the median side, possibly due to the perception that these pedestrians are clearly visible to motorcyclists.
Movement type 3 and 4, which involve gaps between two pedestrians entering from the same side (sidewalk or median), show increasingly strong effects, indicating that sequential pedestrian appearances create uncertainty and prompt more cautious behavior from motorcyclists.
Movement type 5, where pedestrians approach simultaneously from both the sidewalk and median, also yields a strong positive coefficient. This reflects a scenario in which motorcyclists perceive the crosswalk as fully occupied or highly dynamic, significantly increasing the likelihood of stopping to avoid conflict.
Binary logistic regression analysis of motorcyclist behavior.
| Independent variables | Coefficient | Std. Error | Wald | Sig. | Exp(B) | C.I. for Exp(B) | |
|---|---|---|---|---|---|---|---|
| Lower | Upper | ||||||
| Time | −1.559 | 0.111 | 196.701 | 0.000 | 0.210 | 0.169 | 0.262 |
| Pedestrian movement directions: | |||||||
| Movement type 2i | 0.830 | 0.171 | 23.491 | 0.000 | 2.294 | 1.640 | 3.209 |
| Movement type 3i | 4.880 | 0.383 | 162.406 | 0.000 | 131.607 | 62.136 | 278.752 |
| Movement type 4i | 5.454 | 0.391 | 195.027 | 0.000 | 233.645 | 108.677 | 502.313 |
| Movement type 5i | 5.026 | 0.320 | 246.347 | 0.000 | 152.357 | 81.355 | 285.394 |
| Proximity of other vehicles at leftii | 1.091 | 0.240 | 20.655 | 0.000 | 2.978 | 1.860 | 4.768 |
| Proximity of other vehicles at rightii | 1.225 | 0.179 | 46.740 | 0.000 | 3.406 | 2.397 | 4.840 |
| Proximity of other vehicles at both sidesii | 1.787 | 0.390 | 20.956 | 0.000 | 5.969 | 2.778 | 12.826 |
| Standard motorcyclesiii | 0.206 | 0.220 | 0.874 | 0.350 | 1.229 | 0.798 | 1.892 |
| Delivery motorcyclesiii | 0.038 | 0.269 | 0.020 | 0.889 | 1.038 | 0.613 | 1.760 |
| Motorcycle rider and pillion passengers: only rider | 0.058 | 0.164 | 0.124 | 0.725 | 1.059 | 0.768 | 1.461 |
| Old motorcycle riders | −0.161 | 0.161 | 0.999 | 0.318 | 0.851 | 0.621 | 1.167 |
| Multiple pedestrians crossing | 0.450 | 0.149 | 9.084 | 0.003 | 1.569 | 1.171 | 2.102 |
| Raised median | −0.011 | 0.179 | 0.004 | 0.950 | 0.989 | 0.697 | 1.404 |
| Red-white crosswalks | 1.126 | 0.197 | 32.831 | 0.000 | 3.084 | 2.098 | 4.533 |
| Red-white crosswalk * raised median | −0.895 | 0.270 | 11.038 | 0.001 | 0.408 | 0.241 | 0.693 |
| Constant | −0.605 | 0.295 | 4.207 | 0.040 | 0.546 | ||
| Related statistics | |||||||
| Number of observations | 1957 | ||||||
| −2 Log likelihood | 1478.393 | ||||||
| Cox and Snell R square | 0.465 | ||||||
| Nagelkerke R square | 0.621 | ||||||
| Chi-square | 8.284 (8)* | ||||||
compared with pedestrian movement directions type 1,
compared with no vehicles nearby,
compared with motorcycle taxis.
Chi-square’s parenthesis shows degrees of freedom.
These results align with prior research, which has also identified headway time, pedestrian movement directions [6], and number of crossing pedestrians [6, 8] as influential factors in determining motorists’ yielding behavior. Some studies have similarly reported that drivers, including motorcyclists, are more likely to yield to larger pedestrian groups. [19, 20] concluded that increased group size enhances pedestrian visibility and perceives legitimacy. The current analysis supports these findings, as evidenced by the significant effect of pedestrian group size. Similarly, the proximity of other vehicles on the left, right, or both sides of a motorcyclist is strongly associated with a higher likelihood of stopping, with the effect being most pronounced when vehicles are present on both sides. This result is consistent with earlier research, which found that drivers exhibit a greater likelihood of stopping when another vehicle is nearby [21]. Crosswalk design also plays a critical role in influencing motorcyclists’ behavior. High-visibility of red-white markings significantly increases the likelihood of stopping, which is consistent with international findings. [22, 23] reported that high-contrast crosswalks can improve yielding rates. However, the results show that raised median alone is not statistically significant. Although raised median is generally considered beneficial for providing pedestrian refuge in international contexts, their effectiveness is conditional upon unobstructed sightlines [22, 24]. Other variables including motorcycle types (standard or delivery motorcycles), motorcycle rider and pillion passengers, and motorcyclist age are found to be statistically insignificant. The result regarding motorcyclist age contrasts with previous studies, which reported that older drivers tend to be more cautious [25] and more likely to yield [16, 26, 27]. This discrepancy may be attributed to cultural and behavioral differences in age-related yielding behavior specific to the Bangkok context.
The interaction between crosswalk colors and median types reveals a significant influence on motorcyclists' stopping behavior. While red-white crosswalks alone significantly increase the likelihood of stopping due to their enhanced visibility, this effect is significantly reduced when combined with a raised median. This may be because motorcyclists navigating raised median tend to focus more on the road and surrounding traffic, which can divert their attention from pedestrians waiting to cross. Additionally, limited visibility caused by the physical structure of the raised median may make it more difficult to notice waiting pedestrians. In contrast, on roads without median, red-white crosswalks are more prominent and unobstructed, making them more effective in prompting motorcyclists to yield. Therefore, the interaction effect highlights that the efficacy of colored crosswalks is context-dependent, being more pronounced in open, unobstructed road environments.
The model demonstrates a good fit, with a Nagelkerke R2 value of 0. 21, indicating that approximately 62% of the variance in motorcyclists’ stopping behavior is explained by the model. Overall, the findings highlight the significance of pedestrian activity patterns, surrounding traffic context, and crosswalk design in influencing motorcyclists’ behavior at unsignalized mid-block crosswalks.
This study aims to investigate the factors influencing motorcyclists' behavioural responses to pedestrians at unsignalized mid-block crosswalks within the transportation context of developing countries. The logistic regression analysis reveals that motorcyclists’ stopping behaviour at these crosswalks is strongly influenced by situational and environmental factors, rather than rider-specific characteristics. Among these factors, pedestrian movement directions stand out as one of the most significant predictors. Compared to a single pedestrian crossing from the sidewalk (movement type 1), the likelihood of a motorcyclist stopping increases substantially when pedestrians enter from the median (type 2), when there are gaps between multiple pedestrians from either the sidewalk or median (type 3 and 4), and when pedestrians approach simultaneously from both directions (type 5). These findings emphasize the importance of dynamic pedestrian scenarios in shaping rider behaviour. The more complex and unpredictable the crossing patterns, the more likely motorcyclists are to yield. This is consistent with broader behavioural research indicating that drivers and riders tend to adopt more cautious behaviour when exposed to multiple simultaneous stimuli [8, 9]. Other key influencing factors include short headway time, proximity of vehicles nearby a motorcyclist, and multiple pedestrians crossing, each significantly influencing the likelihood of motorcyclists stopping at unsignalized mid-block crosswalks. Crosswalk design, especially red-white markings, also plays a critical role in enhancing compliance. However, the study found that when red-white crosswalks are paired with raised medians, their effectiveness is significantly reduced, likely due to obstructed visibility or increased cognitive load on motorcyclists. In contrast, on roads without median, red-white crosswalks are more prominent and unobstructed, thereby improving their effectiveness in prompting motorcyclists to stop.
Based on the statistically significant findings of this study, it is recommended that motorcyclists ride through crosswalks only when the available headway time is sufficiently long, thereby minimizing potential conflicts and enhancing the safety of both motorcyclists and pedestrians. Shorter headway times are associated with a heightened risk of collisions. To improve safety at unsignalized mid-block crosswalks, the study’s results are important for develop design guidelines, particularly regarding the geometric features of crosswalks. Enhancing crosswalk visibility is also critical, especially using high-contrast red-white markings, which have been shown to be most effective on roads without median, where they are more visible and thus more likely to prompt stopping behaviour. Notably, the interaction between crosswalk colours and median types emerges as a significant factor and should be systematically integrated into the planning and design of pedestrian crossing facilities. Furthermore, priority should be given to crosswalk installations in locations with high pedestrian volumes and complex movement patterns, as these locations are associated with a high likelihood of motorcyclists yielding. In conclusion, future crosswalk planning should emphasize visibility and context-sensitive design to more effectively support safe interactions in mixed-traffic environments.
This study is limited to the Bangkok metropolitan area; therefore, the observed motorcyclists’ behaviour reflects the specific characteristics of an urban environment in a developing country. As such, the findings may not be generalizable to rural settings or to urban contexts in developed countries, where riders’ behaviour may differ, potentially being less aggressive. Future research should examine motorcyclists’ behaviour across diverse traffic environments to assess the consistency or variability of riding behaviour under different contextual conditions. Nevertheless, observations from this study indicated that motorcyclists’ behaviour varied in response to pedestrians’ crossing behaviour and geometric features of crosswalks. Consequently, future research should incorporate a more detailed analysis of pedestrian behaviour and demographic characteristics to enhance the understanding of rider-pedestrian interactions.