Figure 1.
Figure 2.
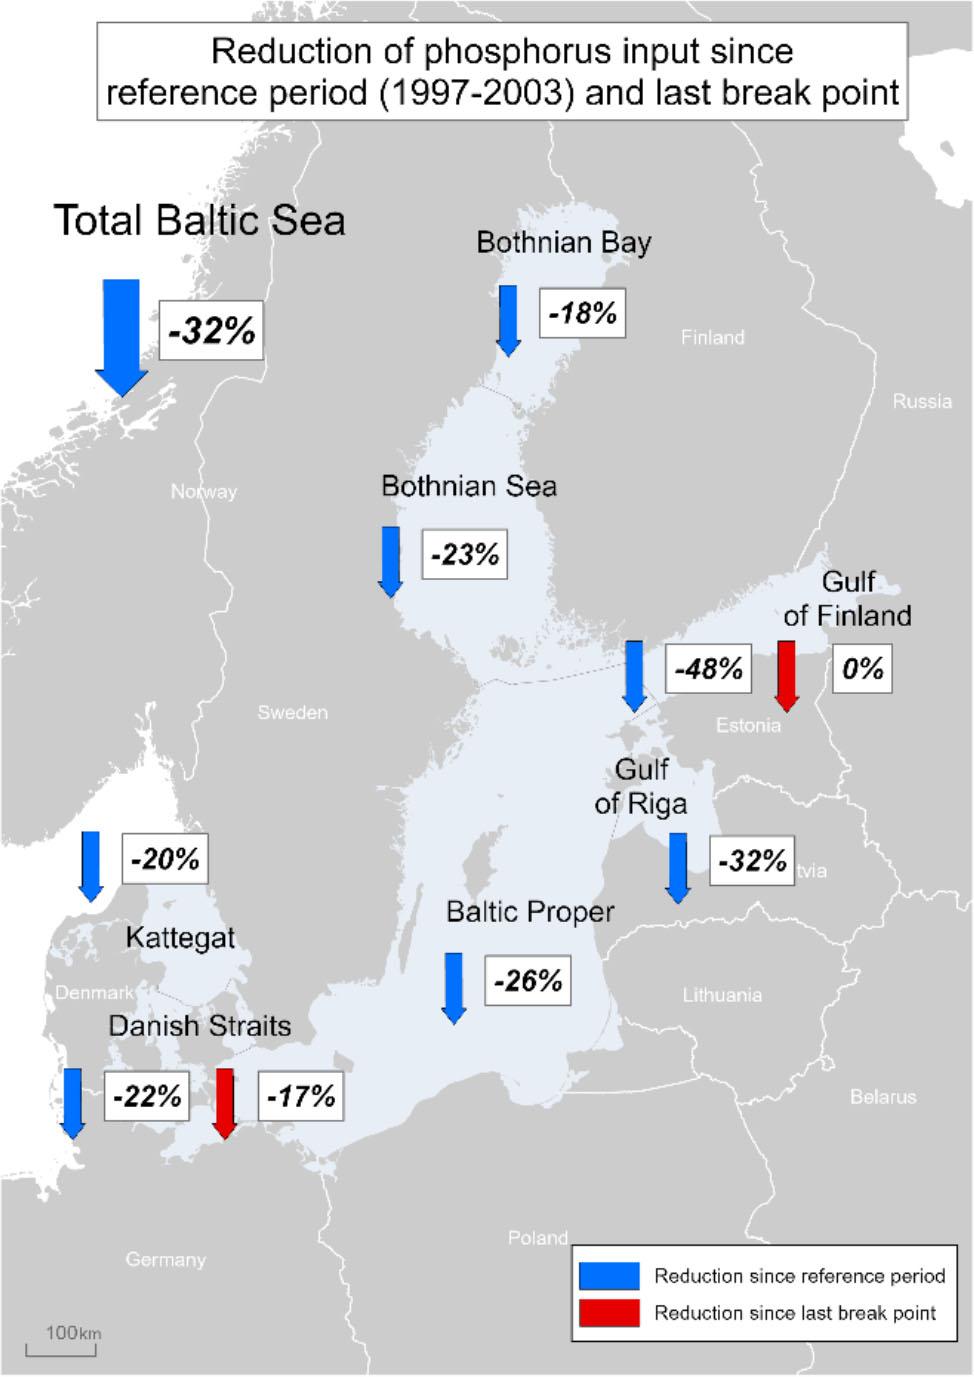
Figure 3.
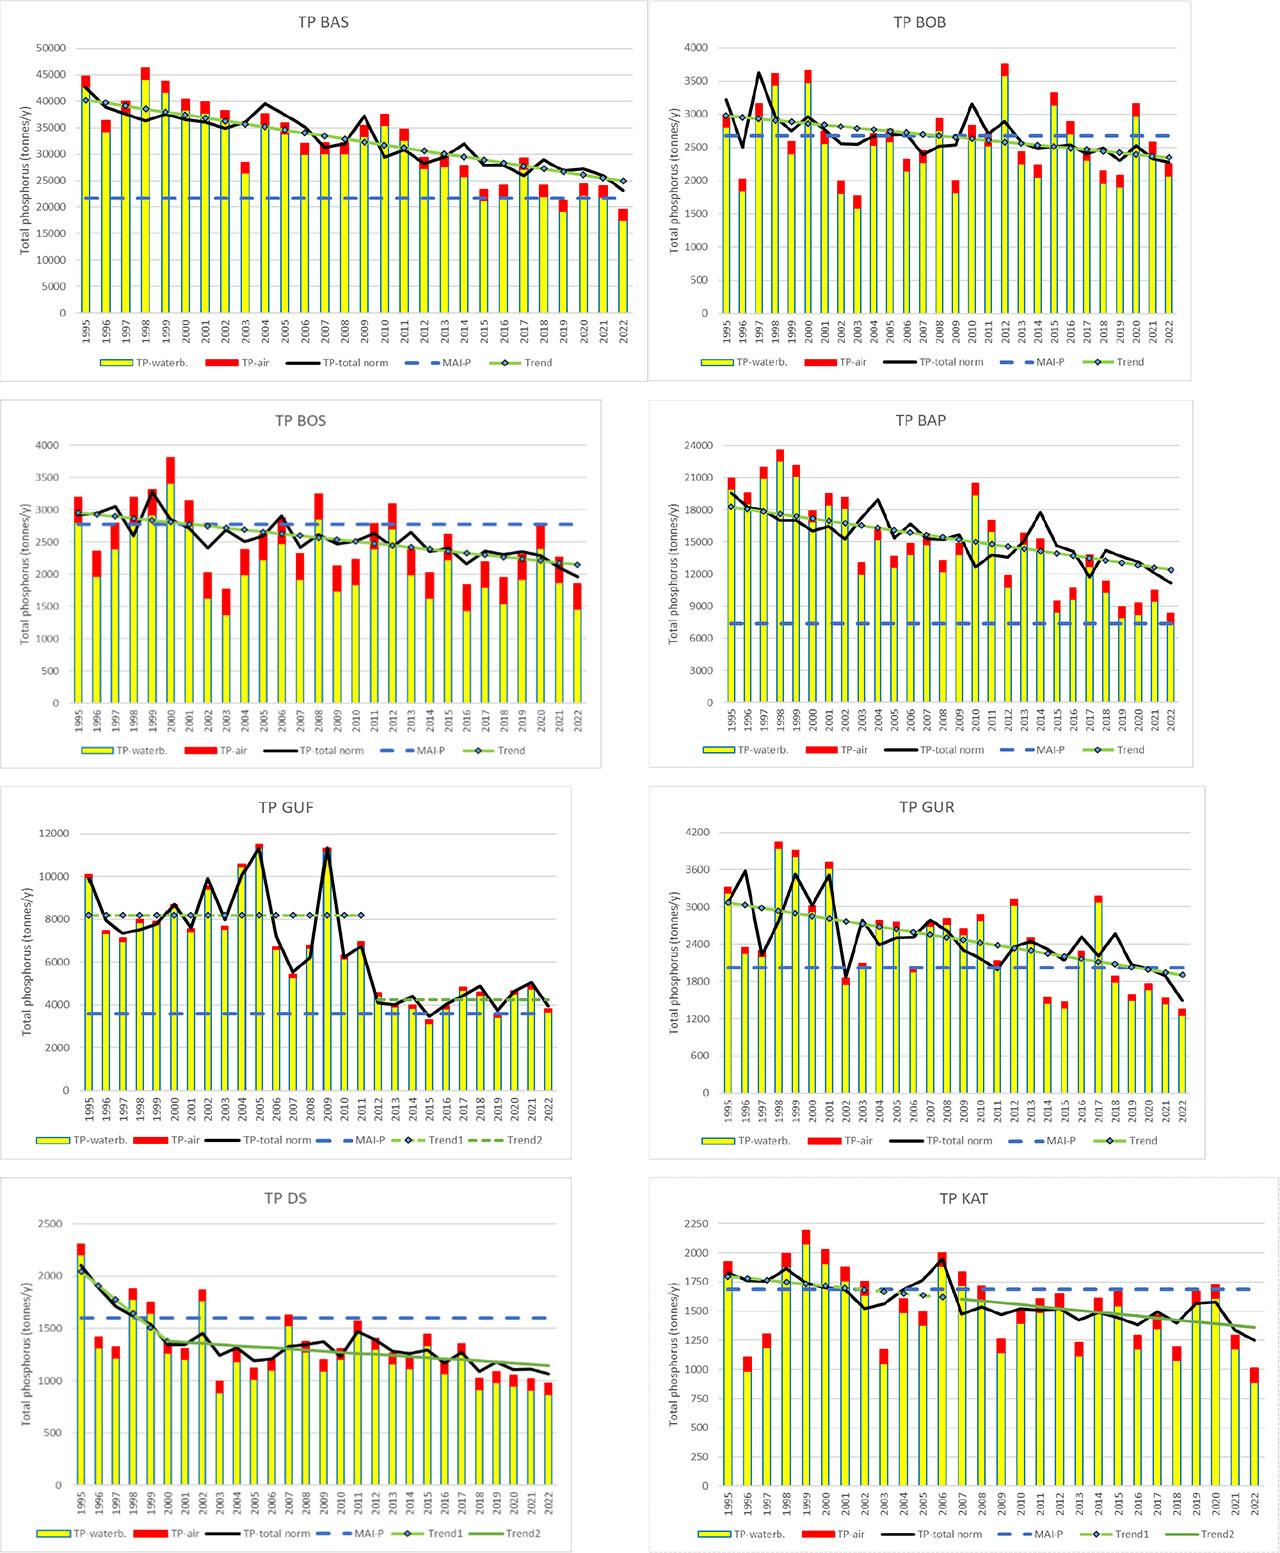
Figure 4.
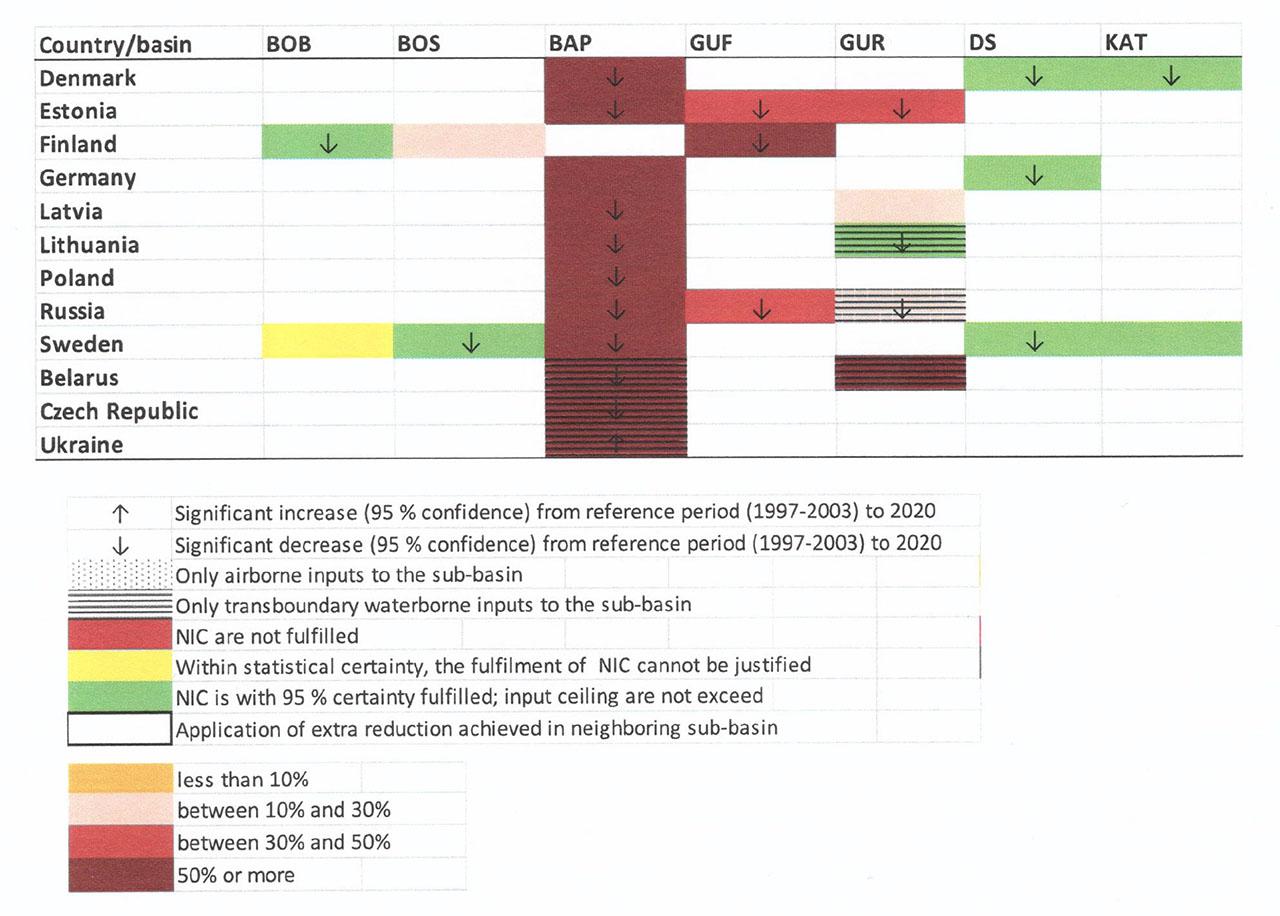
Figure 5.
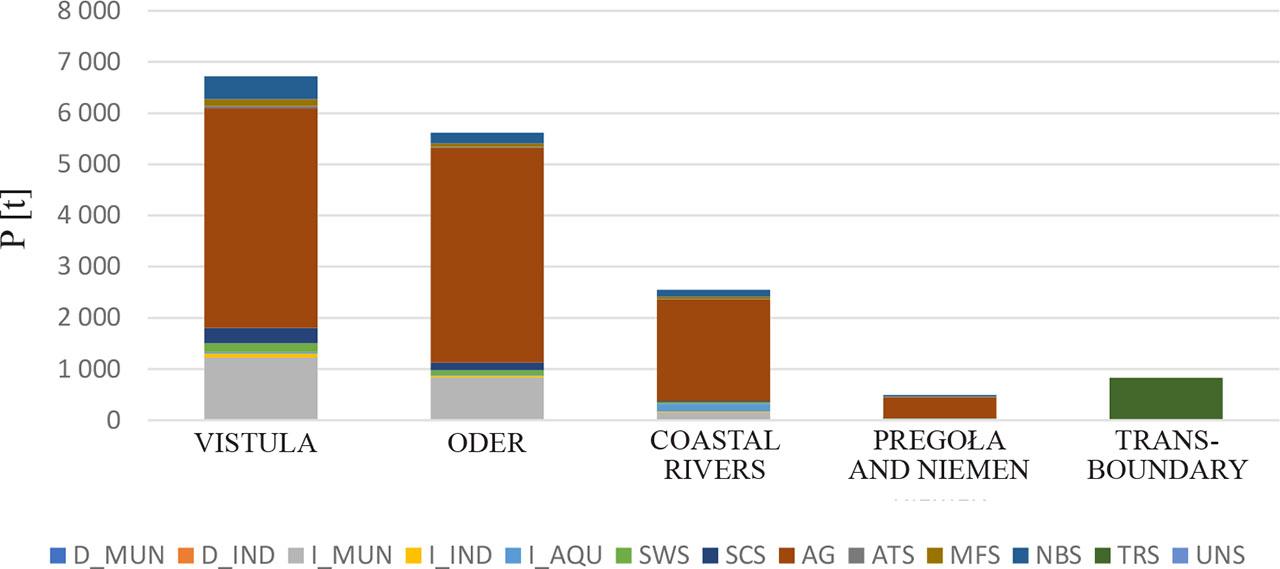
Figure 6.
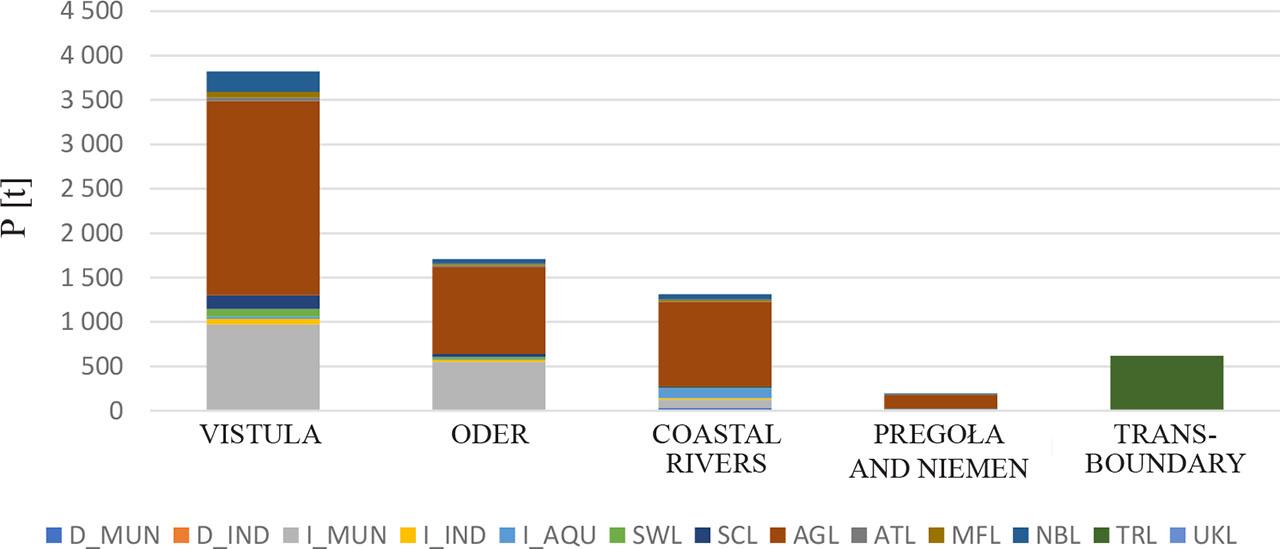
Figure 7.
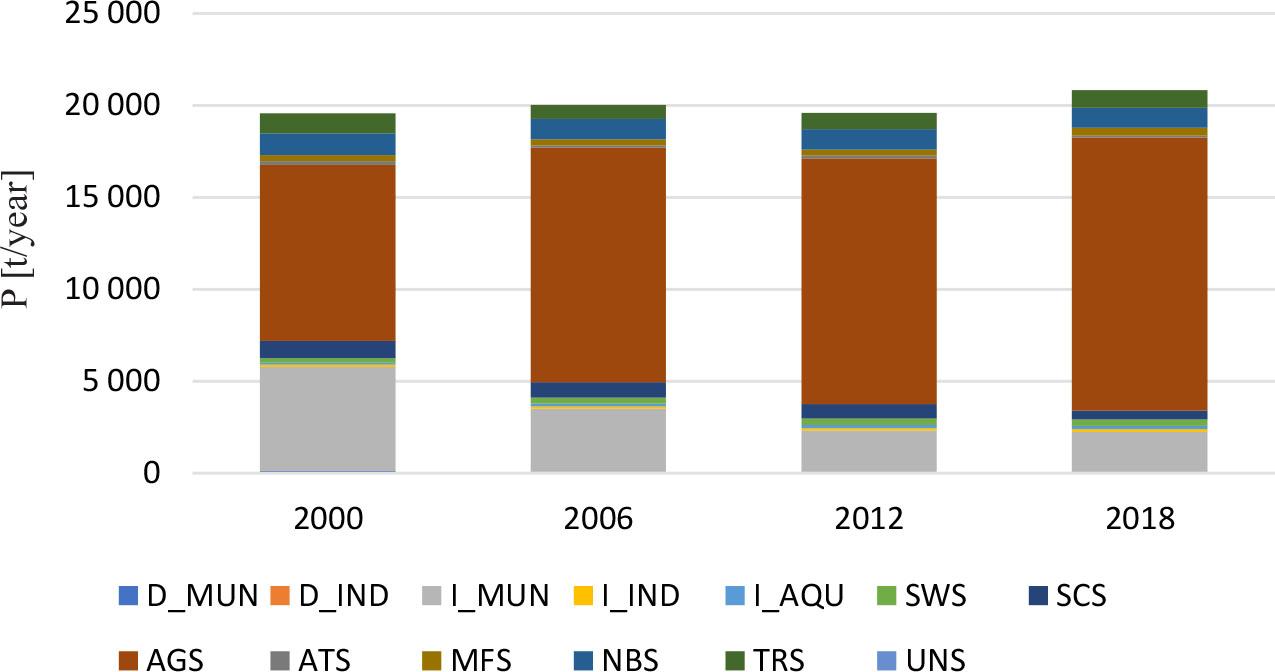
Figure 8.
The trend-based estimate for normalized annual inputs of phosphorus (TP) in 2022_
| Baltic Sea Sub-basin | MAI# | P input 2022 | Statistical uncertainty 2022 | P input including stat. uncert. 2022 | Exceedance of MAI in 2022 | Input 2022 including stat. uncertainty % MAI | Classification of achieved reduction |
|---|---|---|---|---|---|---|---|
| t year−1 | |||||||
| Bothnian Bay (BOB) | 2 675 | 2 350 | 149 | 2 499 | 93 | ||
| Bothnian Sea (BOS) | 2 773 | 2 149 | 106 | 2 255 | 81 | ||
| Baltic Proper (BAP) | 7 360 | 12 386 | 807 | 13 193 | 5 833 | 179 | |
| Gulf of Finland (GUF | 3 600 | 4 242 | 723 | 4 965 | 1 365 | 138 | |
| Gulf of Riga (GUR) | 2 020 | 1 903 | 234 | 2 138 | 118 | 106 | |
| Danish Straits (DS) | 1 601 | 1 148 | 57 | 1 205 | 75 | ||
| Kattegat (KAT) | 1 687 | 1 360 | 67 | 1 427 | 85 | ||
| Baltic Sea (BAS) | 21 716 | 24 958 | 1 259 | 26 217 | 4 501 | 121 | |
Assessment of progress towards total phosphorus NIC by 2020 for Poland by Baltic Sea basins_
| Total N (TN) | Baltic Sea basin# | ||||||
|---|---|---|---|---|---|---|---|
| BOB | BOS | BAP | GUF | GUR | DS | KAT | |
| A: Input Ceiling (NIC BSAP2021) [t] | 4198 | ||||||
| B: Estimated input 2020 [t] | 8167 | ||||||
| C: Inputs 2020 [t] incl. uncertainty (test value) | 8964 | ||||||
| Extra reduction by 2020 (A-C) [t] | |||||||
| Remaining reduction to fulfill NIC by 2020 | 4766 | ||||||
| Remaining in % ceiling | 114 | ||||||
| Significant changes [%] since reference period to 2020 | −22 | ||||||
NIC assessment results of Poland for total phosphorus (TP) from Table 7 (taking into account extra reduction in neighboring basins) combined with the results of the PLC-7 (HELCOM by Sveden and Tornbjerg, 2022) source apportionment assessment for the main sources indicated for Poland_
| Baltic Sea basin# | TP NIC assessment | Remain tons | Remain % 2020 input | TP input 2020 [t] | Main TP sources [%] | ||
|---|---|---|---|---|---|---|---|
| natural background loads | other diffuse waterborne sources | point## sources | |||||
| BOB | 0 | 0 | |||||
| BOS | 0 | 0 | |||||
| BAP | ↓ | 4766 | 58 | 8167 | 5.0 | 68 | 27 |
| GUF | 0 | 0 | |||||
| GUR | 0 | 0 | |||||
| DS | 0 | 0 | |||||
| KAT | 0 | 0 | |||||
Total phosphorus (TP) input ceilings in tons per year for total river as well as the country contribution to each of the transboundary rivers_
| River | Basin# | NIC | Country | ||||||||
|---|---|---|---|---|---|---|---|---|---|---|---|
| DE | FI | LT | LV | PL | RU | BY | CZ | UA | |||
| Nemunas | BAP | 913 | - | - | 628 | - | - | - | 285 | - | - |
| Barta | BAP | 25 | - | - | 5 | 20 | - | - | - | - | - |
| Venta | BAP | 106 | - | - | 20 | 86 | - | - | - | - | - |
| Lielupe | GUR | 302 | - | - | 135 | 167 | - | - | - | - | - |
| Daugava | GUR | 941 | - | - | 40 | 395 | - | 99 | 407 | - | - |
| Oder | BAP | 1554 | 132 | - | - | - | 1365 | - | - | 57 | - |
| Vistula | BAP | 2350 | - | - | - | - | 2240 | - | 63 | - | 47 |
| Pregolya | BAP | 147 | - | - | - | - | 51 | 96 | - | - | - |
| Neva | GUF | 1399 | - | 20 | - | - | - | 1379 | - | - | - |
Years with the statistically identified breakpoints in trend lines of total phosphorus TP) inputs to the Baltic Sea and its sub-basins during 1995–2022_
| Breakpoints | Change [%] since reference period | Change [%] after last breakpoint | |
|---|---|---|---|
| Bothnian Bay | −18 | n.r. | |
| Bothnian Sea | −23 | n.r. | |
| Baltic Proper | −26 | n.r. | |
| Gulf of Finland | 2012 | −48 | - |
| Gulf of Riga | −32 | n.r. | |
| Danish Straits | 2000 | −22 | −17 |
| Kattegat | −20 | n.r. | |
| Baltic Sea | −32 | n.r. |
Remaining phosphorus reduction country in tons by 2020_
| Country | Baltic Sea basin# | ||||||
|---|---|---|---|---|---|---|---|
| BOB | BOS | BAP | GUF | GUR | DS | KAT | |
| Denmark | n/a | n/a | 26 | n/a | n/a | - | - |
| Estonia | n/a | n/a | 11 | 88 | 67 | n/a | n/a |
| Finland | - | 100 | 338 | n/a | n/a | n/a | |
| Germany | n/a | n/a | 241 | n/a | n/a | - | n/a |
| Latvia | n/a | n/a | 111 | n/a | 255 | n/a | n/a |
| Lithuania | n/a | n/a | 388 | n/a | - | n/a | n/a |
| Poland | n/a | n/a | 4766 | n/a | n/a | n/a | n/a |
| Russia | n/a | n/a | 365 | 1010 | 25 | n/a | n/a |
| Sweden | 31 | - | 410 | n/a | n/a | - | - |
| Belarus | n/a | n/a | 518 | n/a | 248 | n/a | n/a |
| Czech Republic | n/a | n/a | 65 | n/a | n/a | n/a | n/a |
| Ukraine | n/a | n/a | 131 | n/a | n/a | n/a | n/a |
Country – Baltic Sea basin total phosphorus input ceilings in tons per year (2021)_
| Country | Baltic Sea basin# | ||||||
|---|---|---|---|---|---|---|---|
| BOB | BOS | BAP | GUF | GUR | DS | KAT | |
| Germany (DE) | - | - | 203 | - | - | 401 | |
| Denmark (DK) | - | - | 21 | - | - | 979 | 815 |
| Estonia (EE) | - | - | 9 | 22 | 185 | - | - |
| Finland (FI) | 1683 | 1246 | 315 | - | - | - | |
| Lithuania (LT) | - | - | 703 | - | 175 | - | - |
| Latvia (LV) | - | - | 167 | - | 1061 | - | - |
| Poland (PL) | - | - | 4198 | - | - | - | - |
| (Russia (RU) | - | - | 242 | 2909 | 99 | - | - |
| Sweden (SE) | 811 | 1133 | 318 | - | - | 116 | 753 |
| Atmospheric deposition | 181 | 394 | 1046 | 150 | 93 | 105 | 118 |
| Belarus (BY) | - | - | 349 | - | 407 | - | - |
| Czech Republic (CZ) | - | - | 57 | - | - | - | - |
| Ukraine (UA) | - | - | 47 | - | - | - | - |
| MAI | 2675 | 2773 | 7360 | 3600 | 2020 | 1601 | 1687 |
Total phosphorus (TP) inputs to the Baltic Sea basins compared with detailed source apportionment_ As in Table 8, but with a more detailed breakdown of sources_
| Baltic Sea basin# | Discharging into inland waters TP [%] | Discharging directly into the sea TP [%] | ||||||||||
|---|---|---|---|---|---|---|---|---|---|---|---|---|
| AGL | ATL | MFL | NBL | SCL | SWL | AQL | INL | MWL | AQL | INL | MWL | |
| BOB | ||||||||||||
| BOS | ||||||||||||
| BAP | 60 | 1.0 | 1.5 | 5.09 | 2.8 | 1.8 | 2.0 | 1.5 | 23 | 0 | 0.28 | 0.45 |
| GUF | ||||||||||||
| GUR | ||||||||||||
| DS | ||||||||||||
| KAT | ||||||||||||
Remaining phosphorus reduction country by basin in percentages of NIC by 2020_
| Country | Baltic Sea basin# | ||||||
|---|---|---|---|---|---|---|---|
| BOB | BOS | BAP | GUF | GUR | DS | KAT | |
| Denmark | n/a | n/a | 125 | n/a | n/a | - | - |
| Estonia | n/a | n/a | 117 | 39 | 36 | n/a | n/a |
| Finland | - | 8.0 | 107 | n/a | n/a | n/a | |
| Germany | n/a | n/a | 119 | n/a | n/a | - | n/a |
| Latvia | n/a | n/a | 66 | n/a | 24 | n/a | n/a |
| Lithuania | n/a | n/a | 55 | n/a | - | n/a | n/a |
| Poland | n/a | n/a | 114 | n/a | n/a | n/a | n/a |
| Russia | n/a | n/a | 151 | 35 | 26 | n/a | n/a |
| Sweden | 3.8 | - | 129 | n/a | n/a | - | - |
| Belarus | n/a | n/a | 148 | n/a | 61 | n/a | n/a |
| Czech Republic | n/a | n/a | 114 | n/a | n/a | n/a | n/a |
| Ukraine | n/a | n/a | 279 | n/a | n/a | n/a | n/a |