Phosphorus is a key nutrient for all forms of life and occurs in natural aquatic and soil ecosystems. It’s concentration is one of the most important parameters describing the fertility (trophy) of aquatic ecosystems, as it limits biomass production. In natural conditions, the concentration of phosphorus compounds dissolved in river water generally does not exceed 0.02–0.03 g P/l (Jarvie et al., 2006). To assess the ecological status (or ecological potential) of water bodies within the meaning of the Water Framework Directive (Directive 2000/60/EC), deviations from the natural status – morphological, physicochemical, trophic and biological, assigned to a given type of water (e.g. rivers) are taken into account. Phosphorus concentration is one of the key assessment parameters, also because the excess of phosphorus causes far-reaching changes in both physicochemical parameters and in the living part of the ecosystem, referred to as eutrophication or anthropogenic eutrophication (to distinguish it from natural limnological processes).
Eutrophication is a condition of the water network with high levels of nutrient concentrations, which include nitrogen and phosphorus, which causes algal blooms, thereby worsening the water quality in aquatic ecosystems (Bali, Gueddari, 2019; Sonarghare et al., 2020). Eutrophication is a process of both natural and anthropogenic origin that has been defined in many ways. It occurs over a long geological time period until the rapid increase in the trophic position of a water body as a result of anthropogenic activities, and is called cultural eutrophication (Sonarghare et al., 2020). Eutrophication is classified as the excessive growth of plants and algae resulting from the increased availability of limiting growth factors (e.g., sunlight, carbon dioxide, and nutrient fertilizers) required for photosynthesis (Sonarghare et al., 2020; Zhang et al., 2023).
The consequences of eutrophication have been found to range from increased growth of aquatic vegetation (phytoplankton such as green algae, diatoms, and cyanobacteria, also known as blue-green algae), resulting in algal blooms, to the contamination of water bodies, making them unfit for drinking, recreation, and supporting aquatic life (Costa et al., 2018; The Federal…2001; Zheng, Paul, 2009). The state of eutrophication causes the water to become turbid and green in color, which limits the penetration of sunlight and thus reduces the photosynthetic rate of submerged aquatic plants. In addition, the death and decomposition of algae causes low levels of dissolved oxygen, which is necessary to sustain aquatic life, leading to the death of aquatic species living below the surface of water bodies (Sonarghare et al., 2020; Rathore et al., 2016; Kim et al., 2020; Hwang, 2020). To simplify slightly, it can be assumed that exceeding the concentration of phosphorus by an order of magnitude compared to the natural background prevents achieving a very good or good ecological status (or ecological potential) of surface waters within the meaning of the Water Framework Directive (Directive 2000/60/EC).
Naturally, eutrophication occurs over the centuries as the lake ages and sediment fills the aquatic system. However, point source discharges as well as non-point loads of phosphorus-containing nutrients to aquatic ecosystems due to human activities have accelerated the rate and scale of eutrophication, with devastating consequences for drinking water sources, aquatic life, and recreational water bodies (Zhang et al., 2023; Knight, 2021). The deterioration of water quality and adverse changes in the microflora and fauna of the Baltic Sea have been a major concern in recent years (Igras, Pastuszak, 2009). The results of the HELCOM thematic assessment for the period 2016–2021 demonstrate that eutrophication is still a major problem in the Baltic Sea (HELCOM Thematic assessment, 2023). At least 93.8 % of the region was assessed to be below good environmental status for eutrophication, including all of the open sea areas and 82.8% of the coastal waters. Nutrient inputs to the Baltic Sea have further decreased, but this has resulted in improvements in eutrophication indicator status and the overall assessment status in only a few areas, while signs of deterioration are also apparent in other areas. Deterioration is mainly driven by nutrient leakage from the sediment so that these legacy nutrients now influence the overall status.
Phosphorus, along with nitrogen, is a major cause of eutrophication. According to Svendsen and Gustafsson (2024), the annual waterborne total phosphorus inputs (TP) in 2022 amounted to approximately 17,500 t, which is about 21% lower than the average of 2012–2021, and about 4,400 t (or 20%) lower than in 2021. Inputs of phosphorus from direct point sources have decreased with approximately 84% since 1995. In 2022, inputs from direct point sources constituted 5.8% total phosphorus (TP) of the corresponding total waterborne input to the Baltic Sea. In 1995, the proportion of the direct inputs was 15% for TP. Annual flow weighted riverine TP concentration decreased significantly (95% confidence) to all basins since 1995. TP concentrations decreased significantly for the total riverine inputs to the Baltic Sea since 1995 by 48%.
Phosphorus enters water bodies via sewage and agricultural runoff (Solovey, 2008). The hydrological pathways for phosphorus movement from cropland to water bodies are often complex, with multiple surface and subsurface transfers (Sharpley et al., 2015). Surface runoff plays a dominant role in P loss, particularly in upland and floodplain areas, but soil phosphorus penetration is also a potential source of water pollution (Hua et al., 2017). Phosphorus from surface water erosion and human sewage into the Earth’s rivers and oceans has increased from about three times historical levels of about 8 million metric tons per year to current loads of about 22 million metric tons per year (Rathore et al., 2016). The increasingly frequent occurrence of heavy rains intensifies these phenomena.
The role of phosphorus in eutrophication has increased significantly over the past half-century due to the widespread use of phosphates in detergents and mineral fertilizers. It is currently assumed that agriculture is the largest source of phosphorus causing eutrophication of water bodies (Dubrovsky et al., 2010; Sharpley et al., 2015). The excessive dependence of the human population on phosphate fertilizers for agricultural production has led to the enrichment of water bodies through farm runoff (Knight, 2021; Zhang, 2022; Yang, 2022). Excessive use of fertilizers containing phosphorus, that is highly soluble in water, can exceed the sorption capacity of soils for this element, and consequently its losses and the release of phosphate ions into waters (Sapek, 2014). Thus, mans are the most significant cause of eutrophication as a result of phosphate accumulation from agricultural-related activities carried out just by humans. The accumulation of phosphate fertilizers in agricultural runoff has reportedly led to the dense growth of aquatic plants (such as hyacinths) and algal blooms (Knight, 2021; Qi et al., 2022). The transportation of animal feeds and animal dung via runoff from farmland coupled with phosphorus mining, as well as industrial production of nitrate fertilizer, has been attributed to the increase in the level nutrients in water bodies, thus resulting in eutrophication (Sonarghare et al., 2020).
Also, wastewater from aquaculture and other concentrated animal feeding operations contribute to the occurrence of phosphates in wastewater discharged to the environment. Phosphate content in aquaculture wastewater, concentrated animal feed and animal excrements used as organic fertilizer is considered to be the main source of nutrients that are washed into water bodies through floods during rainfall (Knight, 2021). Direct discharge of wastewater from industrial production of concentrated animal feed cannot be ignored in the role they play in contributing to the eutrophication of water bodies and the resulting consequences (Knight, 2021; Yang, 2022).
Rational management of phosphorus fertilizers is an extremely difficult task. The main problem is the discrepancy between the amount of phosphorus that guarantees high yields, profitability of crop production and food security and the amount required to limit the transfer of phosphorus from soil to water (Kleinman et al., 2011). It has also been found that there is a strong relationship between the nutrient ratio of nitrates to phosphates and algal blooms. It has also been described that the nutrient ratio can be used to control the occurrence of algal blooms in the aquatic ecosystem (Sidabutar et al., 2020).
Solving the problem of eutrophication is one of the challenges of modern agriculture. It is therefore necessary to conduct research on minimizing the transfer of phosphorus from agricultural areas to waters, taking into account both natural and mineral fertilizers (Bindraban et al., 2020; Liu et al., 2020). Given the current deficit of manure in Poland, phosphorus fertilization is mainly carried out using multi-component fertilizers and superphosphates containing phosphorus in a form that is easily soluble in water (Pakuła et al., 2018). Multi-component fertilizers most often contain fully soluble phosphorus in the form of ammonium phosphate or ortho- and polyphosphates. Currently produced, partially decomposed, enriched superphosphate contains phosphorus in the form of soluble monocalcium phosphate and insoluble tricalcium phosphate (Hoffmann et al., 2011). Less frequently used phosphate rock flour contains calcium phosphates that are insoluble in water and are much less absorbable for plants, but at the same time pose a lower threat to the aquatic environment (Stanisławska-Glubiak et al., 2012).
According to the regulation in force in Poland defining the method of classifying uniform parts of surface waters, the limit value for the first class of purity in terms of total phosphorus concentration (TP) is 0.2 mg P/l, while for the second class it is 0.4 mg P/l (Regulation, 2008). In European countries, the European Environmental Agency (2002) applies six concentration ranges of orthophosphate phosphorus: below 0.02 mg P/l, from 0.02 to < 0.05 mg P/l, from 0.05 to < 0.1 mg P/l, from 0.1 to < 0.2 mg P/l, from 0.2 to < 0.4 mg P/l, from 0.4 mg P/l. In comparison to the values above, the concentrations of total phosphorus defining classes I and II of surface water quality in Poland according to the Water Framework Directive (Directive 2000/60/EC), i.e., meeting the conditions for very good (class I) and good (class II) ecological status: do not align with contemporary knowledge about the impact of phosphorus concentration on the ecological status of rivers, do not align with solutions in other countries with similar natural conditions, including solutions related to the implementation of the Water Framework Directive (Directive 2000/60/EC) and do not align with the recommendations of the Habitats Directive (Council Directive 92/43/EEC).
Land-based pollution remains the major source of environmental pressure on the Baltic Sea ecosystem. This pressure includes among others eutrophication, caused by excess supply of nutrients (nitrogen and phosphorus) to the marine environment. One of the largest Baltic Marine Environment Protection Commission or HELCOM projects, Pollution Load Compilation (PLC), is intended to supply the most up-to-date information on land-based input of nutrients to the marine environment, their sources and pathways. It includes annual and periodic reporting of national data and subsequent release of related assessment products. The assessment creates scientific background for the Contracting Parties to follow up progress towards regional and national environmental targets, undertake measures to prevent pollution of the Baltic marine environment (Article 16 of the Helsinki Convention) (Convention, 1974) and evaluate their effectiveness. The purpose of this study was to analyze the results of the join work with particular attention to Poland’s share in the phosphorus pollution of the Baltic Sea waters in the light of current research in the HELCOM PLC-7 project.
The paper presents the second study in the cycle of Polish contribution in Baltic Sea waters pollution. The previous one related to contamination by nitrates (Pecio, 2024). Both manuscripts are based on the results of the HELCOM PLC experts’ work, presented systematically in many publications. The data used in this study, coming from the latest HELCOM publications: Inputs of nutrients to the sub-basins 1995–2022 (HELCOM core indicator report, 2024), Nutrient Input Ceiling assessment 1995–2020 (Technical report 2023), National (Polish) report on the work within the PLC-7 balance sheet (Development of the balance, 2020).
The analysis considers the following elements:
Fulfilment of maximum allowable nutrient loads MAI in 2022 and progress since the reference period 1997–2003 for phosphorus,
Assessment of progress in achieving national nutrient input limits (NIC assessment), covering data for the years 1995–2020,
Assessment of sources and pathways of nutrients to the Baltic Sea environment by 2020.
The Baltic Marine Environment Protection Commission – also known as the Helsinki Commission (HELCOM) – is an intergovernmental organization (IGO) in the Baltic Sea area, consisting of ten Contracting Parties: the nine Baltic Sea countries Denmark, Estonia, Finland, Germany, Latvia, Lithuania, Poland, Russia and Sweden, plus the European Union.
The HELCOM PLC project is based on national data on the loads of all water-soluble substances from the Member States, obtained mainly through programmed national monitoring.
Nutrient input data are compiled in accordance with PLC-water guidelines for the following nine sub-basins: Bothnian Bay, Bothnian Sea, Archipelago Sea, Gulf of Finland, Gulf of Riga, Baltic Proper, Western Baltic, The Sound and Kattegat. The boundaries of the sub-basins coincide ith the main terrestrial river basin catchments. The BALTSEM model has divided the Baltic Sea into seven sub-basins in accordance with natural marine boundaries and hence the MAIs have been calculated for the following seven sub-basins: Kattegat, Danish Straits, Baltic Proper, Bothnian Sea, Bothnian Bay, Gulf of Riga and Gulf of Finland. In the BALTSEM sub-division, the Bothnian Sea includes the Archipelago Sea and the Danish Straits combine Western Baltic and The Sound. The entire Baltic Sea is covered by the assessment. The monitored areas cover about 90% of the Baltic Sea catchment area (Fig. 1). The nutrient load from non-monitored areas (10% of the Baltic Sea catchment area) is estimated by countries using appropriate national calculation methods.
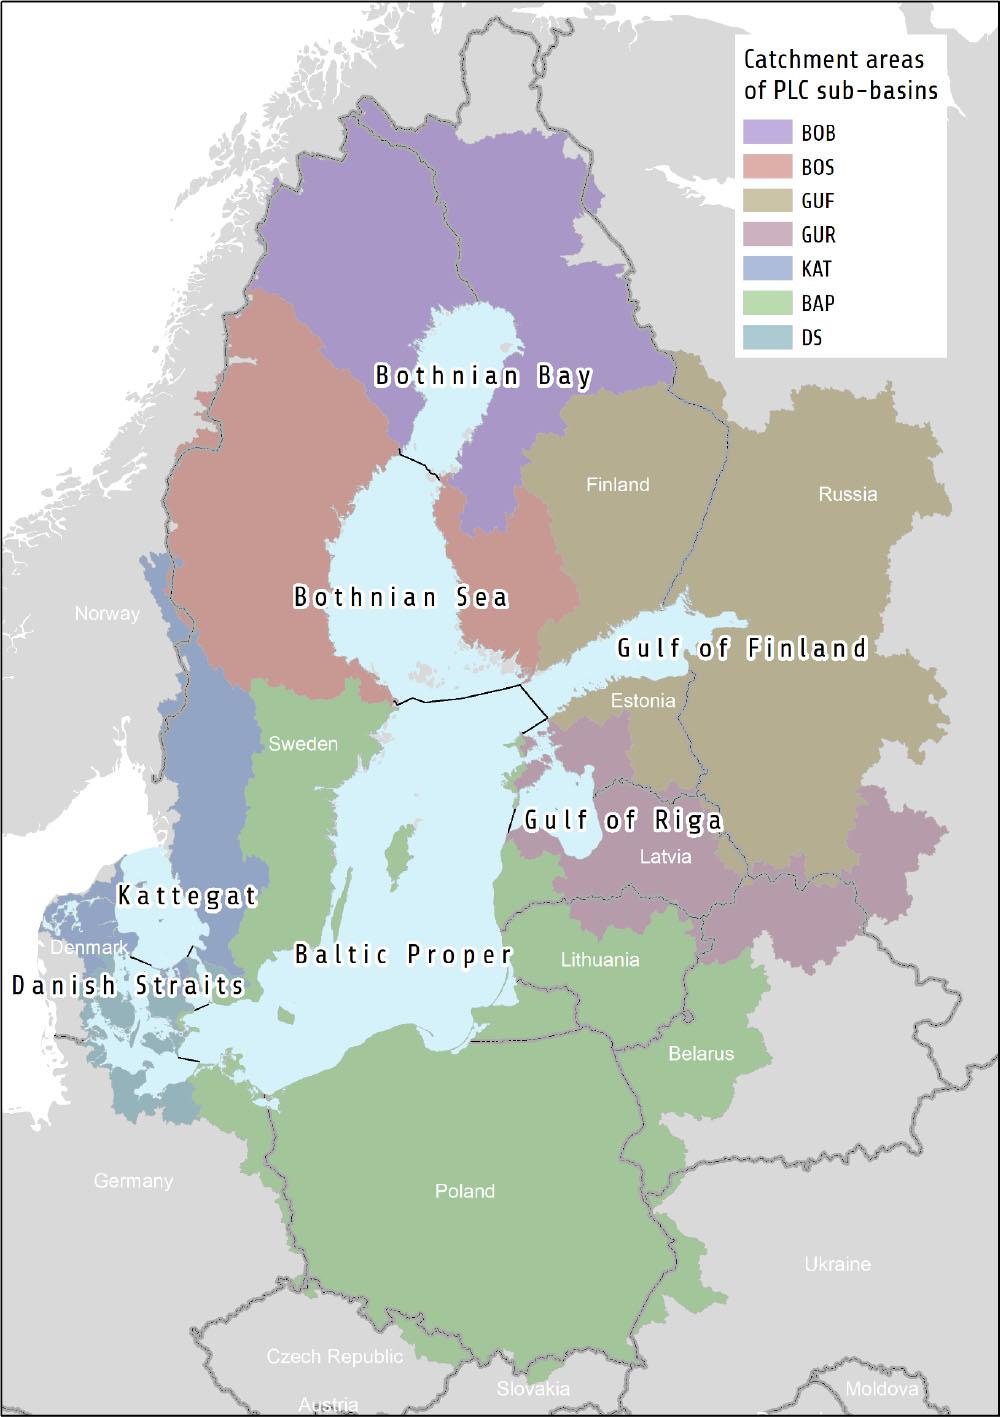
The catchment area and basins of the Baltic Sea covered by PLC monitoring.
BOB – Bothnian Bay, BOS – Bothnian Sea, GUF – Gulf of Finland, GUR – Gulf of Riga, BAP – Baltic Proper, DS – Danish Straits, KAT – Kattegat
Source: Svendsen, Gustafsson, 2024
The HELCOM Contracting Parties annually report waterborne inputs of phosphorus (and nitrogen) from rivers and direct point sources to Baltic Sea sub-basins. Data on atmospheric emissions and monitored deposition are submitted by countries to the Co-operative programme for monitoring and evaluation of the long-range transmission of air pollutants in Europe (EMEP), which subsequently compiles and reports this information to HELCOM. In accordance with Recommendation 37-38-1 Rev1 “Waterborne pollution input assessment (PLC-Water)’ (HELCOM, 2022), sources of nutrient inputs are assessed every six years.
Nutrient data are reported in a standardized form using the online reporting tools of the HELCOM PLC-water database. These tools provide also an initial verification of the data quality based on technical protocols and statistical analysis. Annually reported data on riverine and direct inputs are quality assured and approved by national data reporters and data assurers. Riverine data are flow normalized for individual rivers. HELCOM experts also fill in the gaps in the remaining data using statistical tools and expert assessment. Final approval of all data is done by the national representatives in the PLC project. Input from unmonitored areas is aggregated and normalized for sub-basins.
The environmental targets for nutrient inputs are the maximum allowable inputs (MAI) of the HELCOM nutrient reduction scheme, as confirmed in the BSAP 2021. The MAI indicate the maximal level of annual inputs of water – and airborne phosphorus (and nitrogen) to Baltic Sea sub-basins that can be allowed while still achieving good status in terms of eutrophication.
According to the revised HELCOM nutrient reduction scheme adopted in the 2013 HELCOM Ministerial Declaration (HELCOM, 2013) reduction requirements were set for phosphorus inputs to Baltic Proper, Gulf of Finland and Gulf of Riga. None of the 3 sub-basins fulfilled the requirements in 2022 (Tab. 1).
The trend-based estimate for normalized annual inputs of phosphorus (TP) in 2022.
| Baltic Sea Sub-basin | MAI# | P input 2022 | Statistical uncertainty 2022 | P input including stat. uncert. 2022 | Exceedance of MAI in 2022 | Input 2022 including stat. uncertainty % MAI | Classification of achieved reduction |
|---|---|---|---|---|---|---|---|
| t year−1 | |||||||
| Bothnian Bay (BOB) | 2 675 | 2 350 | 149 | 2 499 | 93 | ||
| Bothnian Sea (BOS) | 2 773 | 2 149 | 106 | 2 255 | 81 | ||
| Baltic Proper (BAP) | 7 360 | 12 386 | 807 | 13 193 | 5 833 | 179 | |
| Gulf of Finland (GUF | 3 600 | 4 242 | 723 | 4 965 | 1 365 | 138 | |
| Gulf of Riga (GUR) | 2 020 | 1 903 | 234 | 2 138 | 118 | 106 | |
| Danish Straits (DS) | 1 601 | 1 148 | 57 | 1 205 | 75 | ||
| Kattegat (KAT) | 1 687 | 1 360 | 67 | 1 427 | 85 | ||
| Baltic Sea (BAS) | 21 716 | 24 958 | 1 259 | 26 217 | 4 501 | 121 | |
As adopted by the 2013 HELCOM Copenhagen Ministerial Meeting (HELCOM, 2013) and in BSAP update 2021 (HELCOM 2021). The table also contains data on statistical uncertainty, the remaining reduction needed to reach MAI and inputs in 2022, including statistical uncertainty in percentages of MAI. Classification of achieving MAI is given in colours: green = MAI fulfilled, yellow = fulfilment is not determined due to statistical uncertainty, and red = MAI not fulfilled. NOTE: For consistency with MAI no rounding (to tenth, hundreds or thousands) has been performed in the indicator.
Source: Inputs of nutrients … 1995–2022
However, statistically significant reductions have been achieved in all sub-basins since the reference period (1997–2003). The highest input reductions were achieved in the Gulf of Finland (48%), Gulf of Riga (32%) and Baltic Proper (26%) (Fig. 2). Phosphorus inputs to the entire Baltic Sea have been reduced by 32%, and about 65% of this reduction was due to reduced phosphorus inputs to the Gulf of Finland and Baltic Proper.
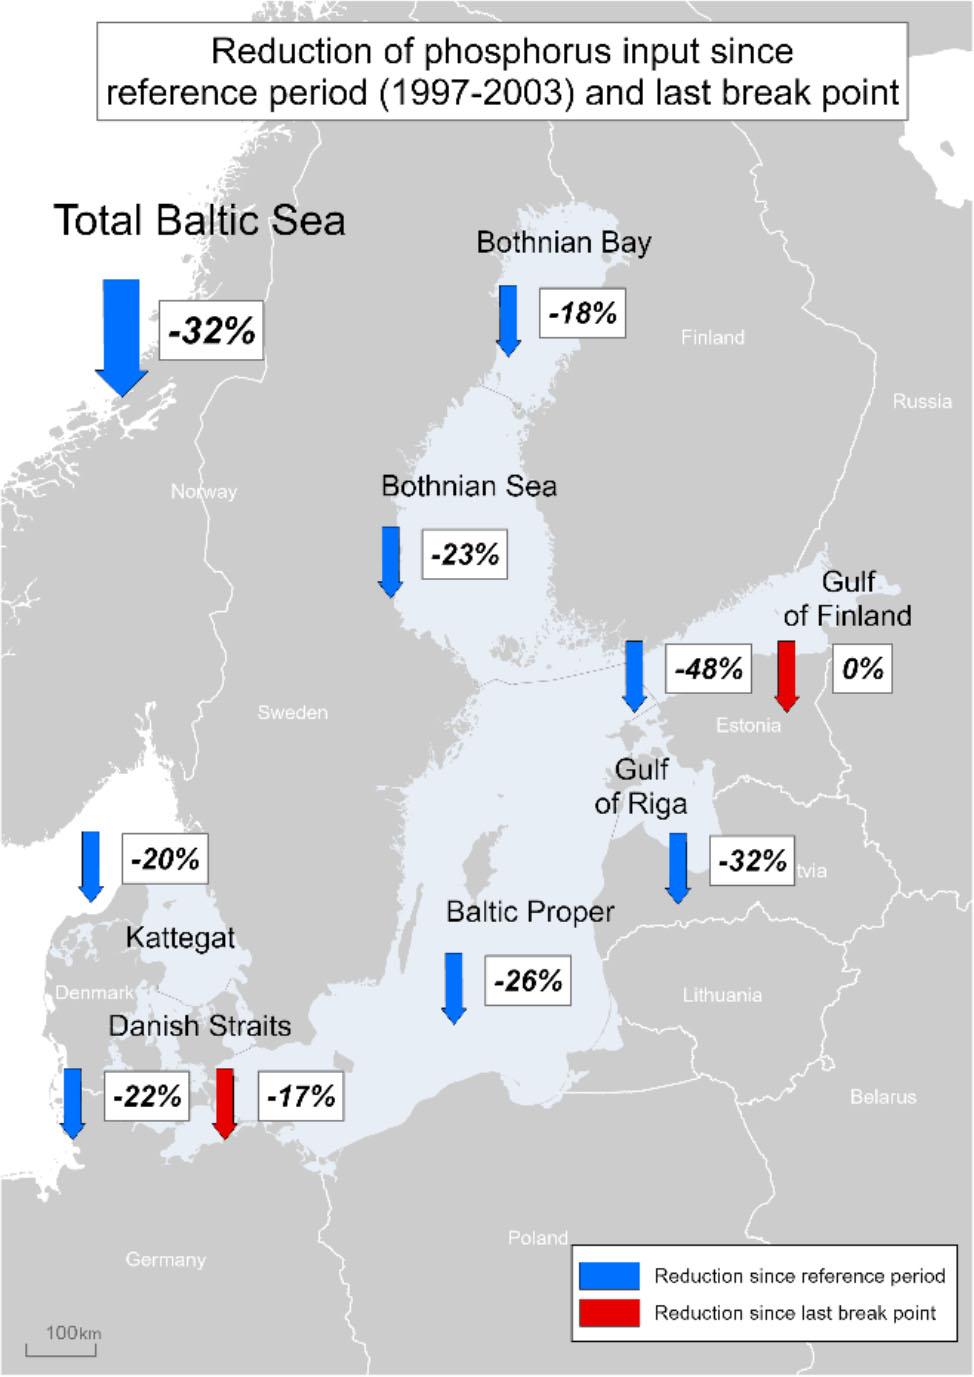
Significant reductions of total annual inputs of phosphorus achieved in 2022 (in %) since the reference period 1997–2003 (blue arrow) and recent changes (red arrow)
where: recent changes are significant changes since last breakpoint of the timeseries. The arrows indicate decreasing (↓) inputs, and only significant changes are shown.
Source: Svendsen et al., 2024
For total phosphorus inputs to the Baltic Sea the trends revealed a steady statistically significant reduction since 1995 to the Baltic Sea and all sub-basins besides Danish Straits and Gulf of Finland (Fig. 3, Tab. 2). Break points were detected for two sub-basins Danish Straits and Gulf of Finland. For Danish Straits total phosphorus inputs decreased with 17% after the break points in 2000. For Gulf of Finland total inputs of phosphorus on average were 48 % lower after the break point in 2012, but with no trend in inputs before and after the breakpoint. The marked abrupt reduction in total phosphorus inputs after 2011 for Gulf of Finland was probably connected to rapid changes of inputs due to measures on point sources in the Russian catchment. There was a marked reduction, despite large interannual variation preventing efficient flow normalization. This resulted in a high uncertainty in the total inputs of phosphorus to the Gulf of Finland (17% according to table 1). In addition, Gulf of Riga had a rather high uncertainty on estimated phosphorus inputs in 2022 (12 %) compared with the remaining five sub-basins (5–7%).
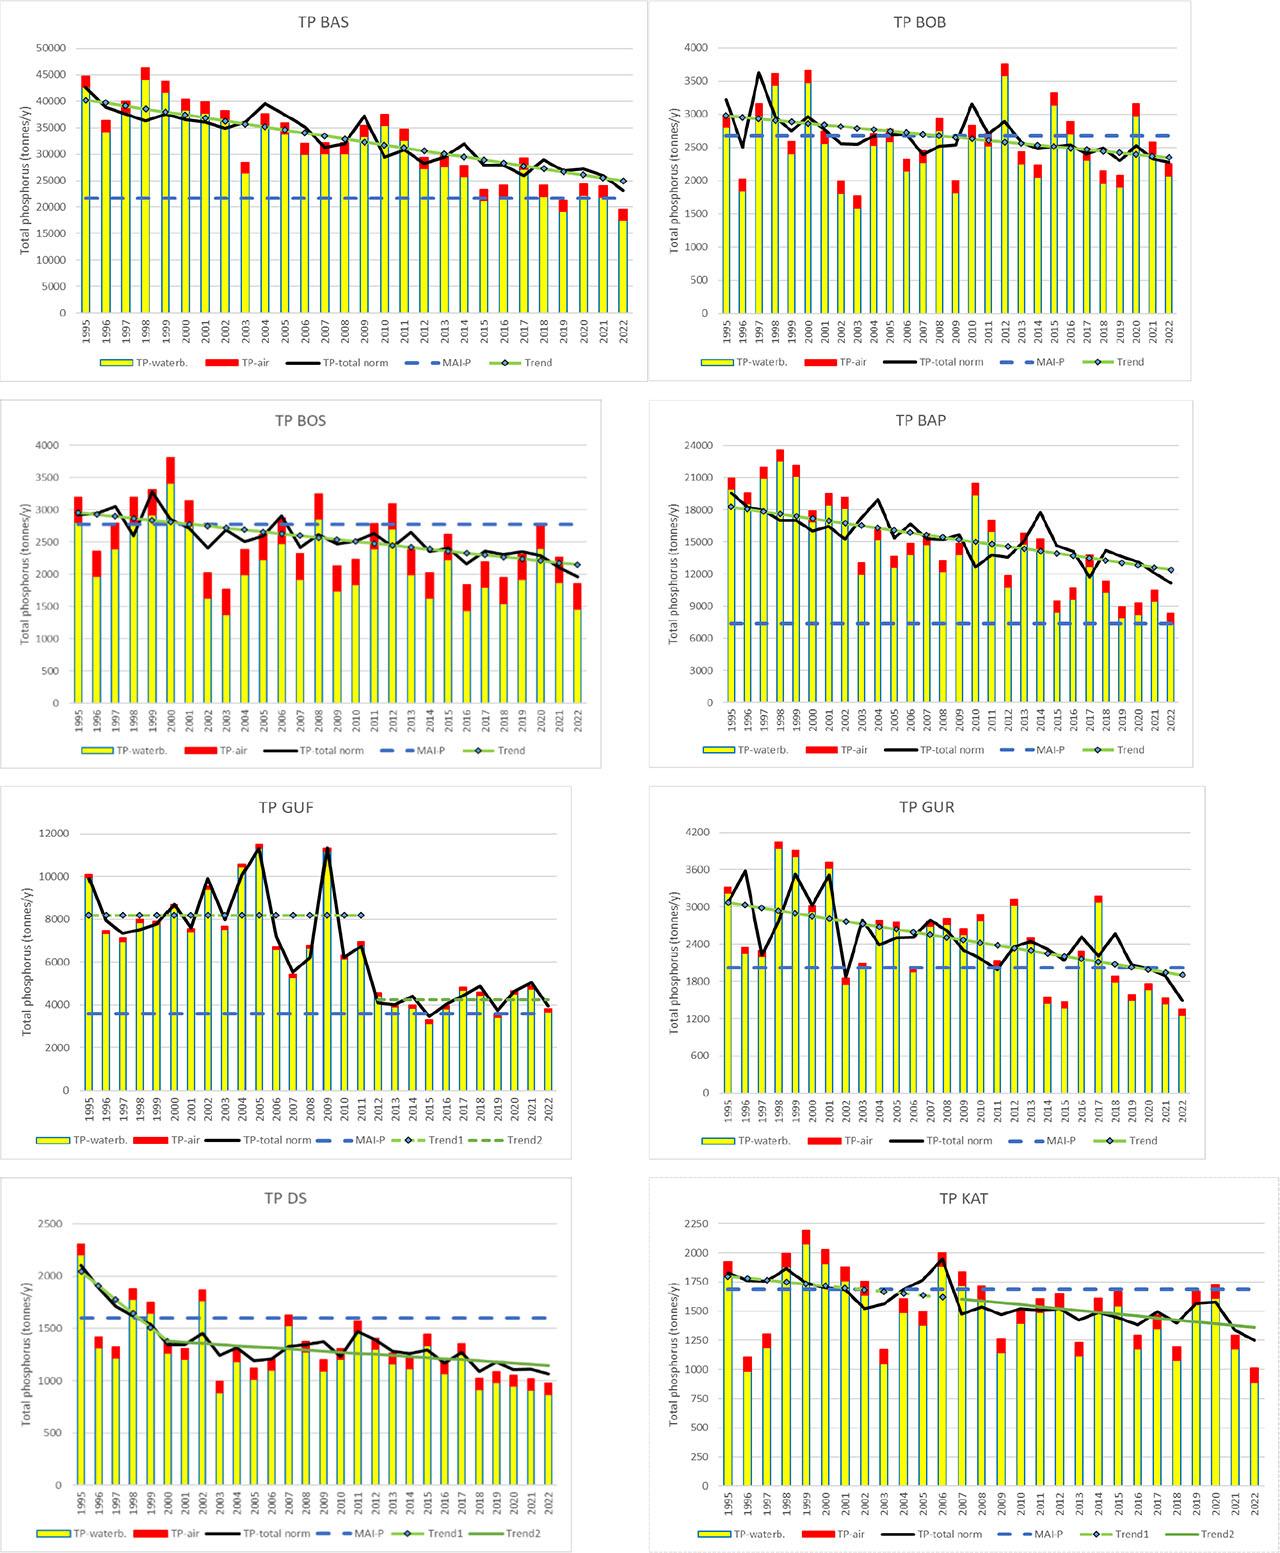
Actual total waterborne annual input of phosphorus (TP) to the Baltic Sea and sub-basins from 1995 to 2022 (tons per year).
BAS – Baltic Sea, BOB – Bothnian Bay, BOS – Bothnian Sea, BAP – Baltic Proper, GUF – Gulf of Finland, GUR – Gulf of Riga, DS – Danish Straits, KAT – Kattegat. The normalized total annual inputs of phosphorus are given as a black line. The trend line for normalized total phosphorus is given as a green line with markers. In cases when a break point divides the trend into two parts, the second part (called trend 2) is shown by a green line without marker. In cases with two breaks points the third part (called trend 3) is indicated as a purple line. (Solid trend line shows statistically significant trend and dotted line no statistically significant trend). The MAI as adopted by the 2013 HELCOM Copenhagen Ministerial Meeting (HELCOM 2013) is shown as the bold dotted blue line.
Source: Svendsen et al., 2024
Years with the statistically identified breakpoints in trend lines of total phosphorus TP) inputs to the Baltic Sea and its sub-basins during 1995–2022.
| Breakpoints | Change [%] since reference period | Change [%] after last breakpoint | |
|---|---|---|---|
| Bothnian Bay | −18 | n.r. | |
| Bothnian Sea | −23 | n.r. | |
| Baltic Proper | −26 | n.r. | |
| Gulf of Finland | 2012 | −48 | - |
| Gulf of Riga | −32 | n.r. | |
| Danish Straits | 2000 | −22 | −17 |
| Kattegat | −20 | n.r. | |
| Baltic Sea | −32 | n.r. |
“-” no significant trend; n.r. – not relevant as there is no break point
Source: Svendsen et al., 2024
Table 2 includes an overview of the identified breakpoints in the 1995–2022 timeseries of phosphorus inputs. Further, the table includes statistically significant changes since the reference period (1997–2003) and after the last breakpoint (if break points are identified), which is an indication of recent changes. As atmospheric deposition of phosphorus was set as an annual fixed rate of 5 kg per km2 the waterborne inputs determine changes in total phosphorus inputs to the Baltic Sea.
Net input of nutrients is an estimation of the amount of nutrients which ends up in the Baltic Sea sub-basins integrating waterborne (direct coastal point sources and discharges from rivers), airborne (atmospheric deposition from a particular country or a group of countries) and transboundary inputs (input via rivers through another country).
National ceilings for net input of nutrient input define maximum inputs via water and air released from a country to achieve good status with respect to eutrophication for Baltic Sea sub-basins. The sum of input ceilings set for all countries to a specific sub-basin is equal to the MAI for that sub-basin.
The NIC values for individual HELCOM countries and Baltic Sea basins are presented in the updated BSAP (BSAP, 2021) and the methods for their calculation are described in the information report (HELCOM upd., 2021). National phosphorus load targets are expressed as nutrient input limits (Tab. 3). Further limits have been agreed for 9 transboundary rivers (Tab. 4). The assessment is based on annual nutrient input data from air and water for the years 1995–2020 in each country by basin and comparing the estimated total phosphorus inputs in 2020 with the NIC values from BSAP2021.
Country – Baltic Sea basin total phosphorus input ceilings in tons per year (2021).
| Country | Baltic Sea basin# | ||||||
|---|---|---|---|---|---|---|---|
| BOB | BOS | BAP | GUF | GUR | DS | KAT | |
| Germany (DE) | - | - | 203 | - | - | 401 | |
| Denmark (DK) | - | - | 21 | - | - | 979 | 815 |
| Estonia (EE) | - | - | 9 | 22 | 185 | - | - |
| Finland (FI) | 1683 | 1246 | 315 | - | - | - | |
| Lithuania (LT) | - | - | 703 | - | 175 | - | - |
| Latvia (LV) | - | - | 167 | - | 1061 | - | - |
| Poland (PL) | - | - | 4198 | - | - | - | - |
| (Russia (RU) | - | - | 242 | 2909 | 99 | - | - |
| Sweden (SE) | 811 | 1133 | 318 | - | - | 116 | 753 |
| Atmospheric deposition | 181 | 394 | 1046 | 150 | 93 | 105 | 118 |
| Belarus (BY) | - | - | 349 | - | 407 | - | - |
| Czech Republic (CZ) | - | - | 57 | - | - | - | - |
| Ukraine (UA) | - | - | 47 | - | - | - | - |
| MAI | 2675 | 2773 | 7360 | 3600 | 2020 | 1601 | 1687 |
The procedure for assessing the achievement of the NIC is described in detail in the works of Larsen & Svendsen (2021) and HELCOM Guidelines (HELCOM, 2022). The basis for determining the NIC is the MAI for the Baltic Sea basin, and the achievement of the NIC ensures the achievement of the MAI. A prerequisite for calculating the MAI was that the average nutrient input was equal to the MAI. The target eutrophication state of the sea will eventually be achieved (as an average value) in the long term. In the adopted methodology, the MAI (or NIC) is considered to be achieved only if it can be shown that the amount of nutrients is below the MAI (or NIC, depending on which indicator is being analyzed).
Figure 4 provides an overview of the progress towards achieving the total phosphorus input limits by 2020 estimated for the Baltic Sea basin countries. Green indicates the achievement of the NIC, as is the case of Finland for BOB, Sweden for BOS, DS and KAT and Denmark for DS and KAT and Germany for DS. The graduated red indicates how far from the NIC (in percentage) the 2020 inputs are (see legend below Fig. 4). For Sweden in BOB catchment it is not possible to assess whether the NIC will be realized by 2020 (marked in yellow) because although the estimated load is lower than the NIC.
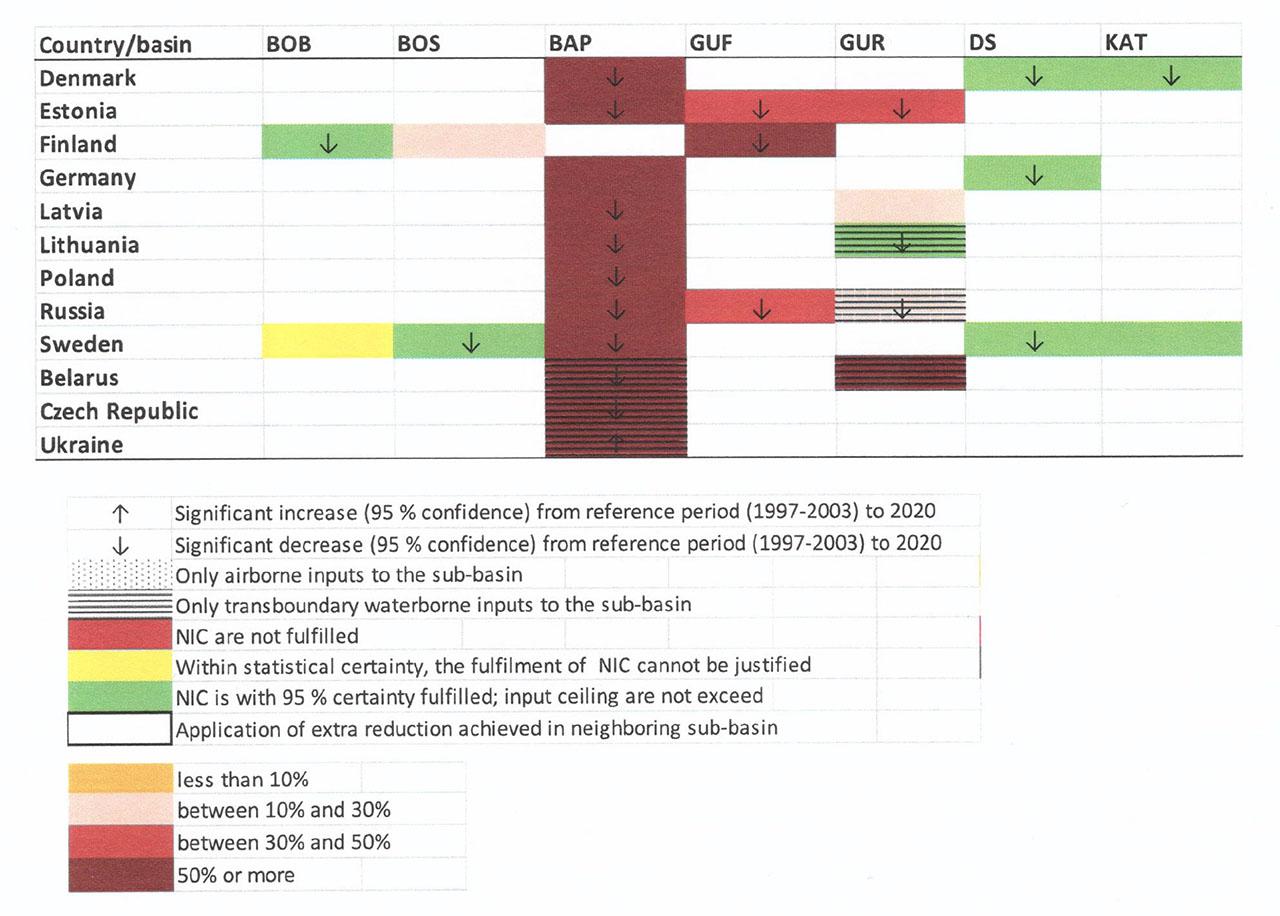
Overall progress results towards NIC implementation by 2020 in terms of total phosphorus (TP) input.
Source: NIC, 2023
The overall results of progress towards phosphorus NICs by 2020 show that without taking into account extra reduction in neighboring basin NICs are not fulfilled for Baltic Proper and only fulfilled for Kattegat (Fig. 4).
None of the HELCOM countries fulfilled the input ceiling for phosphorus to all HELCOM subbasins. In percentages of NIC the needed reduction is more than 100% for several countries to Baltic proper (Table 5), but in tones Poland with nearly 4800 t needs to reduce more than double of the sum of required reduction by all other countries having phosphorus input to Baltic Proper (Table 6).
Total phosphorus (TP) input ceilings in tons per year for total river as well as the country contribution to each of the transboundary rivers.
| River | Basin# | NIC | Country | ||||||||
|---|---|---|---|---|---|---|---|---|---|---|---|
| DE | FI | LT | LV | PL | RU | BY | CZ | UA | |||
| Nemunas | BAP | 913 | - | - | 628 | - | - | - | 285 | - | - |
| Barta | BAP | 25 | - | - | 5 | 20 | - | - | - | - | - |
| Venta | BAP | 106 | - | - | 20 | 86 | - | - | - | - | - |
| Lielupe | GUR | 302 | - | - | 135 | 167 | - | - | - | - | - |
| Daugava | GUR | 941 | - | - | 40 | 395 | - | 99 | 407 | - | - |
| Oder | BAP | 1554 | 132 | - | - | - | 1365 | - | - | 57 | - |
| Vistula | BAP | 2350 | - | - | - | - | 2240 | - | 63 | - | 47 |
| Pregolya | BAP | 147 | - | - | - | - | 51 | 96 | - | - | - |
| Neva | GUF | 1399 | - | 20 | - | - | - | 1379 | - | - | - |
Remaining phosphorus reduction country by basin in percentages of NIC by 2020.
| Country | Baltic Sea basin# | ||||||
|---|---|---|---|---|---|---|---|
| BOB | BOS | BAP | GUF | GUR | DS | KAT | |
| Denmark | n/a | n/a | 125 | n/a | n/a | - | - |
| Estonia | n/a | n/a | 117 | 39 | 36 | n/a | n/a |
| Finland | - | 8.0 | 107 | n/a | n/a | n/a | |
| Germany | n/a | n/a | 119 | n/a | n/a | - | n/a |
| Latvia | n/a | n/a | 66 | n/a | 24 | n/a | n/a |
| Lithuania | n/a | n/a | 55 | n/a | - | n/a | n/a |
| Poland | n/a | n/a | 114 | n/a | n/a | n/a | n/a |
| Russia | n/a | n/a | 151 | 35 | 26 | n/a | n/a |
| Sweden | 3.8 | - | 129 | n/a | n/a | - | - |
| Belarus | n/a | n/a | 148 | n/a | 61 | n/a | n/a |
| Czech Republic | n/a | n/a | 114 | n/a | n/a | n/a | n/a |
| Ukraine | n/a | n/a | 279 | n/a | n/a | n/a | n/a |
Remaining phosphorus reduction country in tons by 2020.
| Country | Baltic Sea basin# | ||||||
|---|---|---|---|---|---|---|---|
| BOB | BOS | BAP | GUF | GUR | DS | KAT | |
| Denmark | n/a | n/a | 26 | n/a | n/a | - | - |
| Estonia | n/a | n/a | 11 | 88 | 67 | n/a | n/a |
| Finland | - | 100 | 338 | n/a | n/a | n/a | |
| Germany | n/a | n/a | 241 | n/a | n/a | - | n/a |
| Latvia | n/a | n/a | 111 | n/a | 255 | n/a | n/a |
| Lithuania | n/a | n/a | 388 | n/a | - | n/a | n/a |
| Poland | n/a | n/a | 4766 | n/a | n/a | n/a | n/a |
| Russia | n/a | n/a | 365 | 1010 | 25 | n/a | n/a |
| Sweden | 31 | - | 410 | n/a | n/a | - | - |
| Belarus | n/a | n/a | 518 | n/a | 248 | n/a | n/a |
| Czech Republic | n/a | n/a | 65 | n/a | n/a | n/a | n/a |
| Ukraine | n/a | n/a | 131 | n/a | n/a | n/a | n/a |
More detailed results of the assessment of progress towards the NIC by 2020 for total phosphorus for each country separately is presented in the NIC Report (NIC, 2023). In the case of Poland ( Tab. 7), the reduction remaining to be achieved before 2020 was 4,766 t, i.e. 114% of the NIC. The changes presented were statistically significant, therefore the last row of the table presents further percentage changes in loads from the reference period to 2020. They equaled to −22% in the Baltic Proper (BAP) basin.
Assessment of progress towards total phosphorus NIC by 2020 for Poland by Baltic Sea basins.
| Total N (TN) | Baltic Sea basin# | ||||||
|---|---|---|---|---|---|---|---|
| BOB | BOS | BAP | GUF | GUR | DS | KAT | |
| A: Input Ceiling (NIC BSAP2021) [t] | 4198 | ||||||
| B: Estimated input 2020 [t] | 8167 | ||||||
| C: Inputs 2020 [t] incl. uncertainty (test value) | 8964 | ||||||
| Extra reduction by 2020 (A-C) [t] | |||||||
| Remaining reduction to fulfill NIC by 2020 | 4766 | ||||||
| Remaining in % ceiling | 114 | ||||||
| Significant changes [%] since reference period to 2020 | −22 | ||||||
To facilitate monitoring of progress towards the NIC in 2020 and responses to remaining reduction requirements, in order to identify the main sources of phosphorus for each Baltic Sea basin and country, the status of the NIC implementation was compared with the results from the latest source apportionment estimate from the PLC-7 project (HELCOM by Sveden and Tornbjerg, 2022).
The NIC Report showed that all countries provided sources of waterborne TP at a rather aggregated level. Five countries, including Poland, provided more detailed sources of these loads. The remaining percentage reduction to be achieved was calculated as the remaining reduction (in tons) divided by the value of the load in 2020.
In the case of Poland, 4,766 t of TP loads remain to be reduced in the Baltic Proper Basin (BAP), which is 58% of the estimated loads in 2020 (Table 8). More than half (68%), i.e. almost 5554 t of loads, are other dispersed water sources. Point sources (from sewage treatment plants, industrial plants with separate discharges and aquaculture plants) discharging loads to inland fresh waters and directly to the sea, and atmospheric sediments at sea, account for 27% each, i.e. approx. 2205 t each.
NIC assessment results of Poland for total phosphorus (TP) from Table 7 (taking into account extra reduction in neighboring basins) combined with the results of the PLC-7 (HELCOM by Sveden and Tornbjerg, 2022) source apportionment assessment for the main sources indicated for Poland.
| Baltic Sea basin# | TP NIC assessment | Remain tons | Remain % 2020 input | TP input 2020 [t] | Main TP sources [%] | ||
|---|---|---|---|---|---|---|---|
| natural background loads | other diffuse waterborne sources | point## sources | |||||
| BOB | 0 | 0 | |||||
| BOS | 0 | 0 | |||||
| BAP | ↓ | 4766 | 58 | 8167 | 5.0 | 68 | 27 |
| GUF | 0 | 0 | |||||
| GUR | 0 | 0 | |||||
| DS | 0 | 0 | |||||
| KAT | 0 | 0 | |||||
A more detailed breakdown of sources in Table 9 shows that the main loads of total phosphorus from Poland to the Baltic Sea are delivered via inland waters (indirect sources) and come from agriculture (60%), municipal sewage (23%) and natural background (5.1%).
Total phosphorus (TP) inputs to the Baltic Sea basins compared with detailed source apportionment. As in Table 8, but with a more detailed breakdown of sources.
| Baltic Sea basin# | Discharging into inland waters TP [%] | Discharging directly into the sea TP [%] | ||||||||||
|---|---|---|---|---|---|---|---|---|---|---|---|---|
| AGL | ATL | MFL | NBL | SCL | SWL | AQL | INL | MWL | AQL | INL | MWL | |
| BOB | ||||||||||||
| BOS | ||||||||||||
| BAP | 60 | 1.0 | 1.5 | 5.09 | 2.8 | 1.8 | 2.0 | 1.5 | 23 | 0 | 0.28 | 0.45 |
| GUF | ||||||||||||
| GUR | ||||||||||||
| DS | ||||||||||||
| KAT | ||||||||||||
Combining the remaining reduction for phosphorus country by basin with the input sources reveals that even reduction more or less all inputs from waste water sources (loads from municipal waste water treatment plants, industrial plants, aquaculture plants, scattered dwellings and storm waters) will not be sufficient to fulfil the NIC. There is a need also to reduce inputs from diffuse sources such as agricultural sector and forestry.
The Pollution Load Compilation (PLC) balances are studies prepared by HELCOM member states in a six-year cycle, the purpose of which is to present the size and origin of phosphorus (and nitrogen) loads generated in the Baltic Sea catchment area within the borders of these states (loads “at source”), the size and structure (by source) of river loads reaching the Baltic Sea and the retention of nutrients in the inland waters of the states. The PLC balance also includes cross-border loads (in the case of Poland, originating from Germany, the Czech Republic, Ukraine, Belarus and Russia).
The balance is prepared in the system of so-called sub-catchments, covering both areas for which monitored flows and loads are monitored and unmonitored areas along the coast. The Polish part of the Baltic Sea catchment area includes 30 sub-catchments, including the Polish monitored parts of the Vistula and Odra river basins, monitored parts of 10 coastal river basins, Polish parts of the Pregoła and Niemen river basins and unmonitored coastal areas.
River loads were calculated based on data from gauges and measurement and control points located in the mouth sections. The PLC7 balance methodology is in accordance with HELCOM guidelines. It is a simple, static mass balance method, based as far as possible on measurement data to estimate loads „at sources”, river loads and retention.
Both the source and river load balance showed, as expected, an absolutely dominant share of agriculture in the total phosphorus load, which is divided into five regions in Figure 5 and Figure 6.
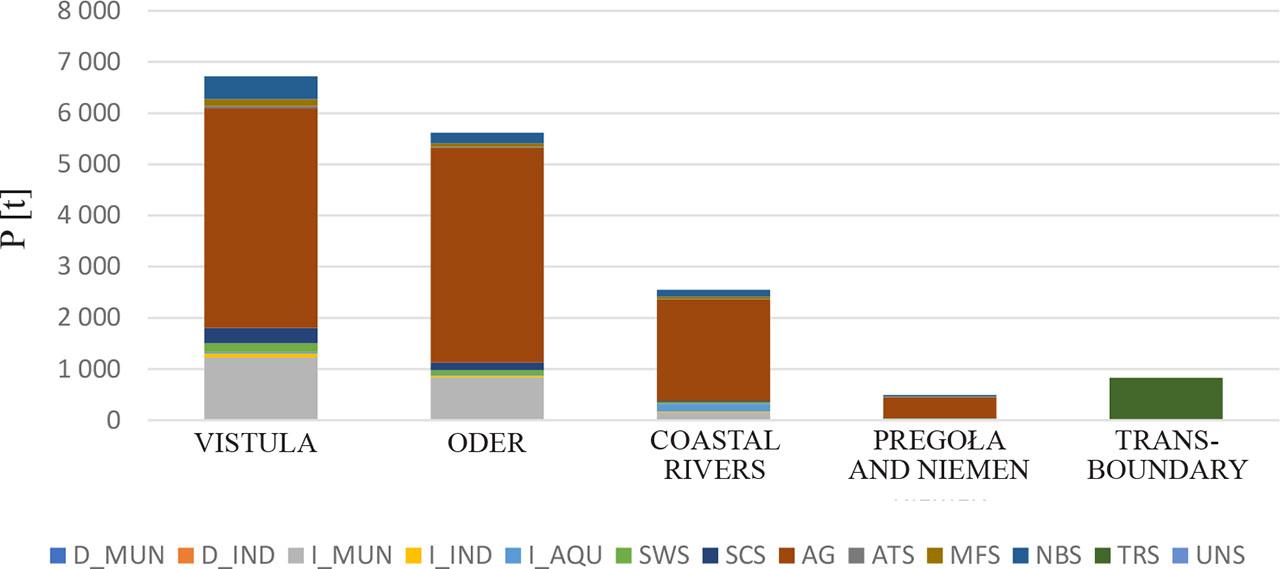
Structure of phosphorus loads at sources in five regions – absolute values.
MUN–municipal point sources, IND – industrial point sources, AQU – aquaculture, ATS – atmospheric deposition, TRS – transgenic cargo, SWS – overflows and surface runoff from urbanized areas, SCS – sewage from unsewered areas, AG – agriculture, ATS – direct atmospheric deposition MFS – commercial forests and wastelands, NBS – natural background TRS – cross-border cargo
Source: National Report, 2020
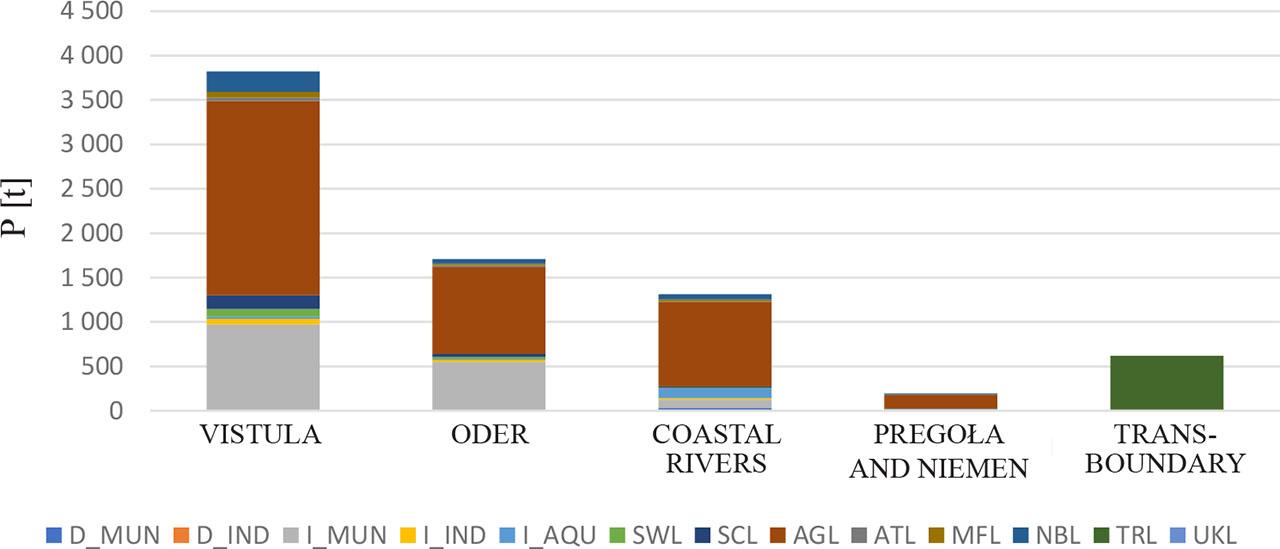
The structure of river phosphorus loads in five regions – absolute values.
River loads from: MUN – municipal point sources, IND – industrial point sources, AQU – aquaculture, SWL – sewage from storm overflows of combined sewers and surface, subsurface and ground runoff from undeveloped areas (excluding loads from sanitary sewage from unsewered areas and from the natural background), SCL – sanitary sewage from non – sewered areas, ATS – atmospheric deposition, AGL – agriculture, ATL – atmospheric precipitation on the surface of inland waters, MFL forests and wastelands, NBL – natural background, TRL – transboundary sub – catchments outside Poland, UKL – unknown sources
Source: National Report, 2020
Of the estimated load of 16.2 thousand tons of phosphorus originating from sources within Poland, 7.7 thousand tons is retained in Polish inland waters, which, with a river load of 8.6 thousand tons, corresponds to a retention coefficient of 0.53 (National Report, 2020). The allocation results of river loads are shown in the figure below (Fig.6). If to assume that loads of unknown origin are in fact loads originating from agriculture, then the basic features of the results for phosphorus are: a clear dominance of agriculture, especially in loads at sources, but also in river loads a significant share of sewage from municipal treatment plants, a gradual decrease in the share of municipal sewage and a synchronized increase in the share of agriculture. The actions taken so far have resulted in reductions of phosphorus from municipal sewage, which have a clear impact on the structure of loads.
The analysis was carried out on the basis of the database of standardized phosphorus loads maintained by HELCOM (Igras, Jadczyszyn, 2008). The so-called standardized loads were loads corrected to correspond approximately to the loads that would be expected in a given year with river flows corresponding to the averages for the period covered by the data series.
Such normalization is extremely helpful in data analysis because it allows to largely eliminate the influence of variable hydrometeorological conditions on the observed river loads. It should be emphasized that this influence can be very strong. First of all, the rate of transport of nutrients from the landscape, primarily through surface and intra-cover runoff, depends on the intensity of rainfall and river feeding. Secondly, the volume of flows in rivers has a large impact on the processes that result in the retention of nutrients in rivers, such as sedimentation, denitrification, and sediment re-suspension.
The results for the whole of Poland in the Baltic Sea catchment area in 2000–2018 are presented in Figures 7 and 8.
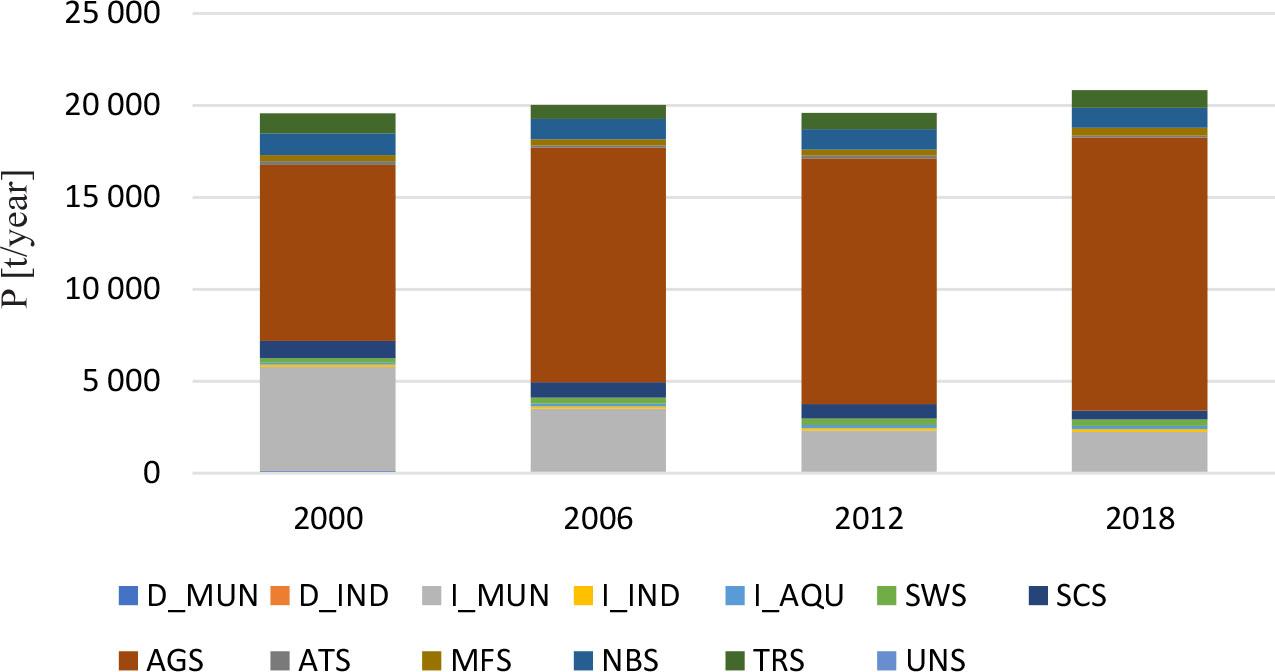
Normalized phosphorus loads at sources from Polish part of the Baltic Sea catchment area in 2000, 2006, 2012, 2018
MUN – municipal point sources, IND – industrial point sources, AQU – aquaculture, SWS – overflows and surface runoff from urbanized areas, SCS – sewage from unsewered areas, AGS – agriculture, ATS – direct atmospheric deposition, MFS – commercial forests and wastelands, NBS – natural background, TRS – transgenic cargo, UNS – loads of unknown origin, D – direct, I – indirect
Source: National Report, 2020
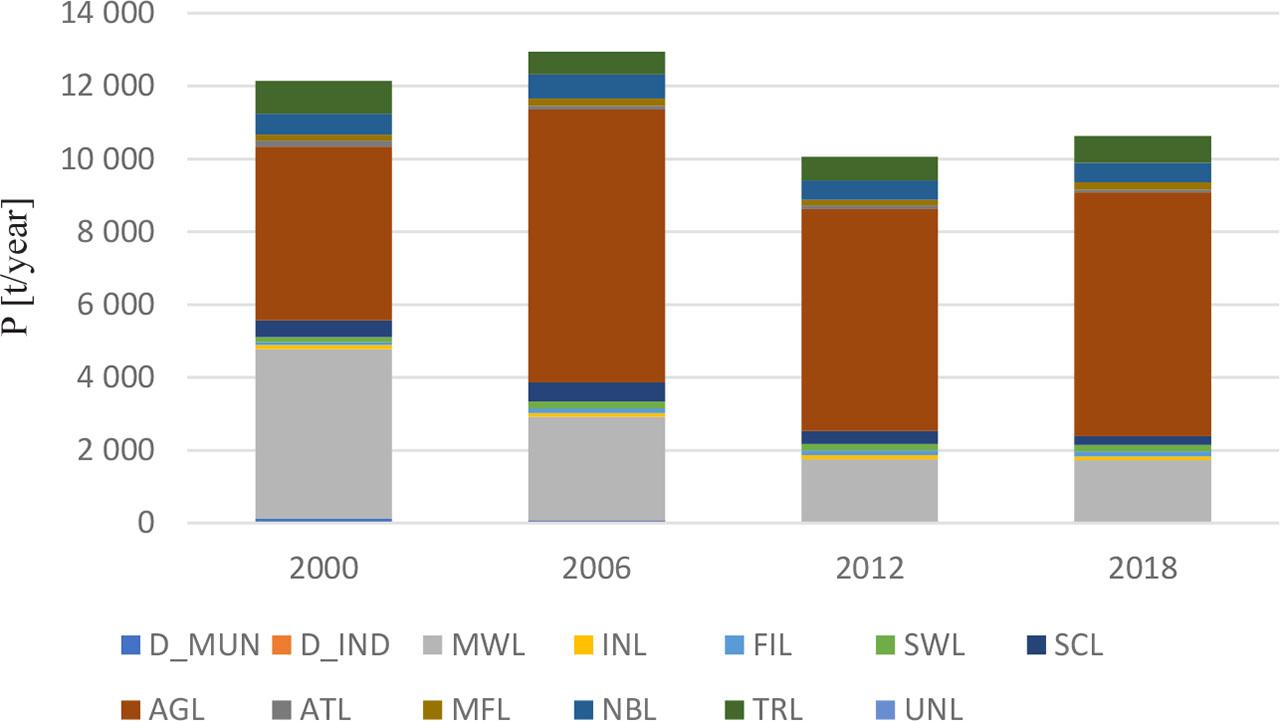
Normalized river loads of phosphorus from Polish part of the Baltic Sea catchment area in in 2000, 2006, 2012, 2018
River loads from: MUN – municipal point sources, IND – industrial point sources, MWL – municipal sewage treatment plants, INL – industrial sewage treatment plants, INL – industrial sewage treatment plants, FIL – aquaculture (salmon farming), SWL – sewage from storm overflows of combined sewers and surface, subsurface and ground runoff from undeveloped areas (sanitary sewage from unsewered areas and from the natural background), SCL – sanitary sewage from non-sewered areas, AGL – agriculture, ATL – atmospheric precipitation on the surface of inland waters, MFL – municipal sewage treatment plants, NBL – natural background, TRL – transgenic sub-catchments outside Poland, UNL – unknown sources, D – direct, I – indirect
Source: National Report, 2020
The conclusions resulting from the analysis of changes in the structure of phosphorus loads confirm the conclusions resulting from the analysis of the other data:
- –
agriculture is definitely the dominant and increasingly important source of nutrients discharged from Poland to the Baltic Sea,
- –
the possibilities of achieving further progress through actions in sewage management are shrinking,
- –
there is no possibility of significantly reducing nutrients loads and approaching the thresholds resulting from the HELCOM Baltic Sea Action Plan without broad-based actions limiting pollution loads from agriculture.
It should be emphasized that these conclusions apply equally to inland waters covered by the Water Framework Directive. Problems with achieving the WFD objectives in terms of eutrophication indicators cannot be solved without reducing pollution from agriculture.
Total phosphorus TP inputs to the entire Baltic Sea in 2022 have been reduced by 32% since the reference period 1997–2003, and about 65% of this reduction was due to reduced phosphorus inputs to the Gulf of Finland and Baltic Proper. Statistically significant reductions have been achieved in all sub-basins of Baltic Sea. The highest input reductions were achieved in the Gulf of Finland (48%), Gulf of Riga (32%) and Baltic Proper (26%).
The Polish 4,766 t of TP loads to be reduced makes 58% of the estimated loads in 2020. More than half (68%), i.e. almost 5554 t of the loads, come from other dispersed water sources. Point sources (from sewage treatment plants, industrial plants with separate discharges and aquaculture plants) discharging loads to inland fresh waters and directly to the sea, and atmospheric sediments at sea, account for 27% each, i.e. approx. 2205 t each. Main loads of total phosphorus from Poland to the Baltic Sea are delivered via inland waters (indirect sources) and come from agriculture (60%), municipal sewage (23%) and natural background (5.1%).
Combining the remaining reduction for phosphorus country by basin with the input sources reveals that even reduction more or less all inputs from waste water sources (loads from municipal waste water treatment plants, industrial plants, aquaculture plants, scattered dwellings and storm waters) will not be sufficient to fulfil the NIC. There is a need also to reduce inputs from diffuse sources such as agricultural sector and forestry.
An absolutely dominant share of agriculture in the total phosphorus load was showed also by both the source and river pollutant load balance PLC-7. The load comes from five regions of the Polish part of the Baltic Sea catchment area. It includes the Polish monitored parts of the Vistula and Odra river basins, monitored parts of 10 coastal river basins, Polish parts of the Pregoła and Niemen river basins and unmonitored coastal areas.
If to assume that loads of unknown origin are in fact loads originating from agriculture, then the basic features of the results for phosphorus are: a clear dominance of agriculture, especially in loads at sources, but also in river loads, a significant share of sewage from municipal treatment plants, a gradual decrease in the share of municipal sewage and a synchronized increase in the share of agriculture.
The actions taken so far have resulted in reductions of phosphorus from municipal sewage, which have a clear impact on the structure of loads. It should be emphasized that these conclusions apply equally to inland waters covered by the Water Framework Directive. Problems with achieving the WFD objectives in terms of eutrophication indicators cannot be solved without reducing pollution from agriculture.