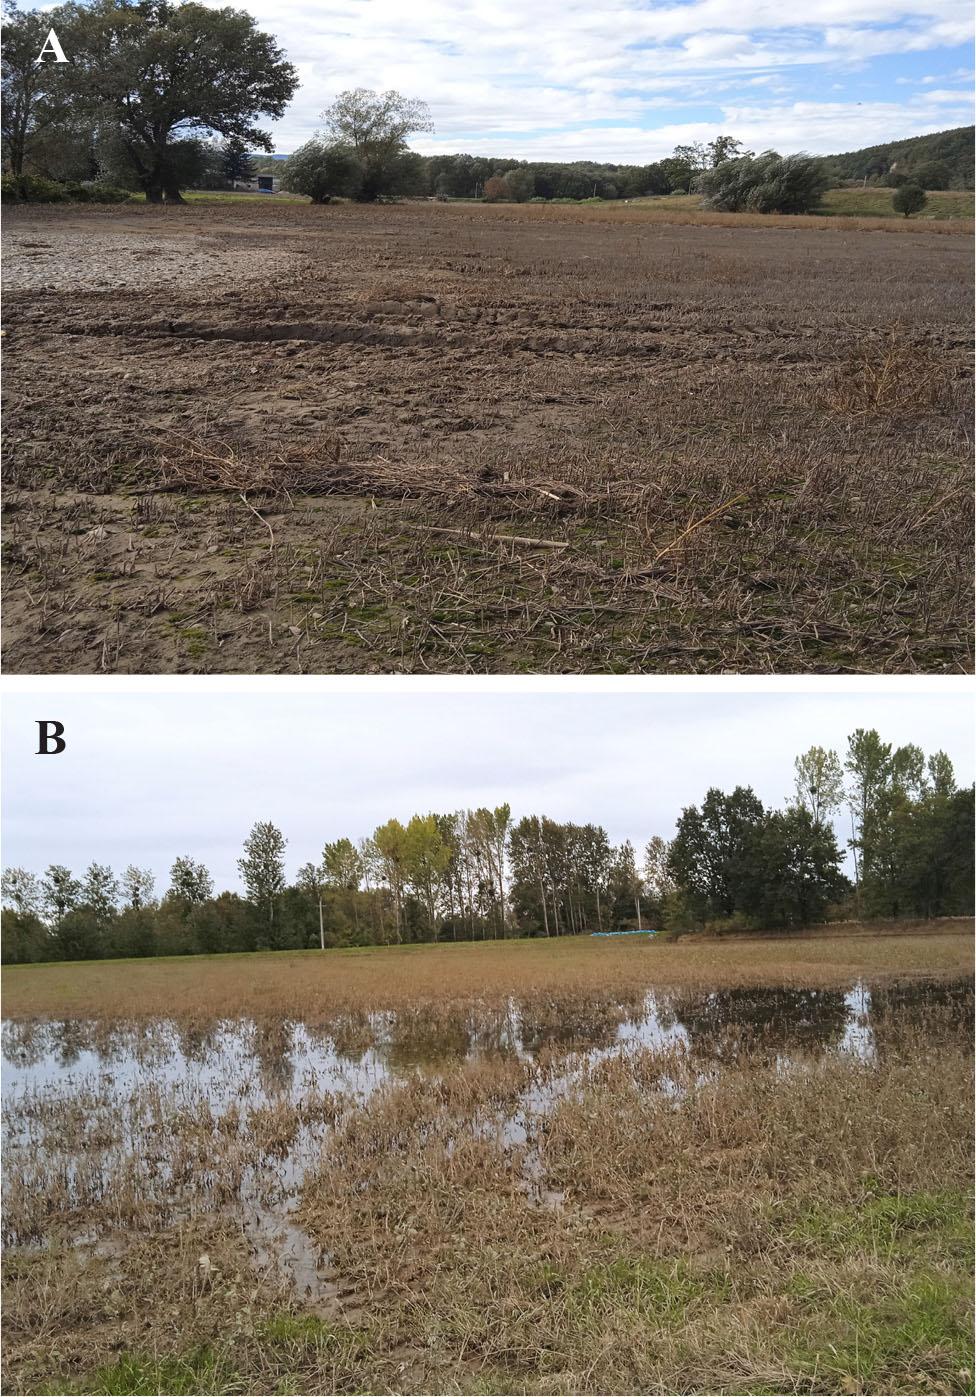
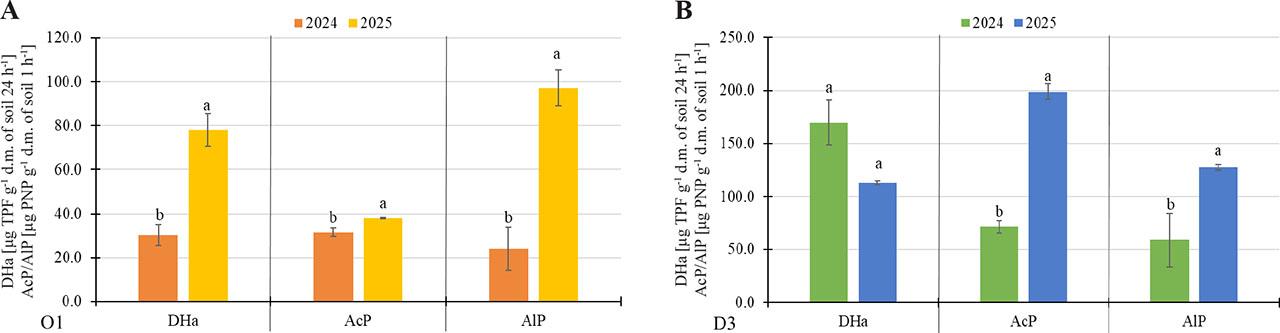
Have a personal or library account? Click to login
Enzymatic activity and metabolic potential of microorganisms in flood-affected soils analysed in the short and long term after flooding – preliminary studies Cover

Enzymatic activity and metabolic potential of microorganisms in flood-affected soils analysed in the short and long term after flooding – preliminary studies

Open Access
|Dec 2025

Figures & Tables

Figure 1.

Photographs from fields selected to research: A) field O1, year 2024 ; B) field D3, year 2024 (auhor’s photographs, K.F.).

Figure 2.

Enzymatic activity in selected soils at two sampling dates – September 2024, and April 2025. (A) Field O1 from the Opole voivodeship; (B) Field D3 from the Lower Silesia voivodeship. DHa – dehydrogenases activity [μg TPF g−1 d.m. of soil 24 h−1]; AcP – acid phosphatase activity [μg PNP g−1 d.m. of soil 1 h−1]; AlP – alkaline phosphatase activity [μg PNP g−1 d.m. of soil 1 h−1]. The values show the mean of n = 3 ± SD. Different letters (a-b) indicate statistically significant differences at P ≤ 0.05 for a given enzyme (One Way ANOVA, Tukey’s HSD test).

Figure 3.

Comparison of metabolic activity (AWCD) and diversity (H’) of soil microorganisms at two sampling dates – September 2024, and April 2025. (A) Field O1 in the Opole voivodeship; (B) Field D3 in the Lower Silesia voivodeship. AWCD – index of metabolic activity; H’ – metabolic diversity index. Values show the mean of n = 3 ± SD. Different letters (a-b) indicate statistically significant differences at P ≤ 0.05 for a given index (One Way ANOVA, Tukey’s HSD test).

Soil samples using in research_

SampleLocalisationBefore flood#After flood#
O1Kantarowice (50°44′41.4″N, 17°35′32.1″E), municipality Lewin Brzeski, Opole voivodeship; floodwater from Nysa Kłodzkawinter wheat conventional cultivation2024: Ploughing; microbiological preparation;
2025: nitrogen fertiliser, chicken manure, disc harrowing, maize sowing

D3Krosnowice (50°24′04.5″N, 16°38′10.4″E), municipality Kłodzko, Lower Silesia voivodeship; floodwater from Nysa Kłodzkawinter wheat conventional cultivation2024: Ploughing;
2025: NPK+S+Mg fertiliser, soybean sowing
DOI: https://doi.org/10.2478/cag-2025-0014 | Journal eISSN: 3071-740X | Journal ISSN: 2081-2787
Language: English
Page range: 161 - 168
Submitted on: Oct 29, 2025
|
Accepted on: Dec 17, 2025
|
Published on: Dec 30, 2025
In partnership with: Paradigm Publishing Services
Publication frequency: 1 issue per year

© 2025 Karolina Furtak, Karolina Gawryjołek, Małgorzata Woźniak, Emilia Grzęda, published by Institute of Soil Science and Plant Cultivation
This work is licensed under the Creative Commons Attribution 4.0 License.