

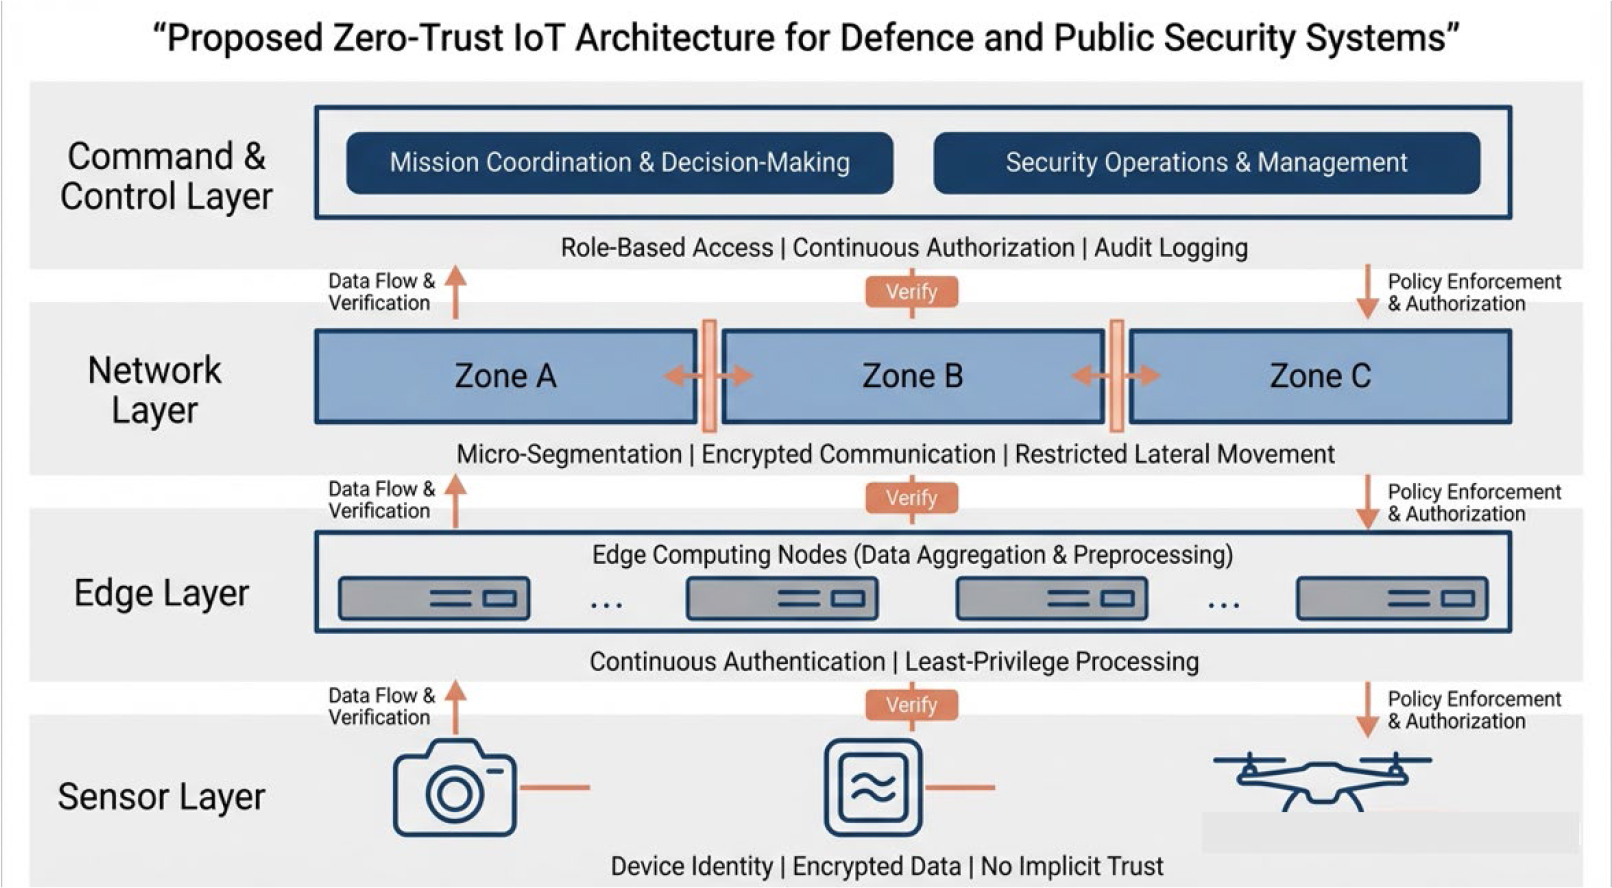
Figure no. 1:
Proposed Zero-Trust IoT Architecture for Defence and Public Security Systems
(Source: Author’s conceptual architectural mode)
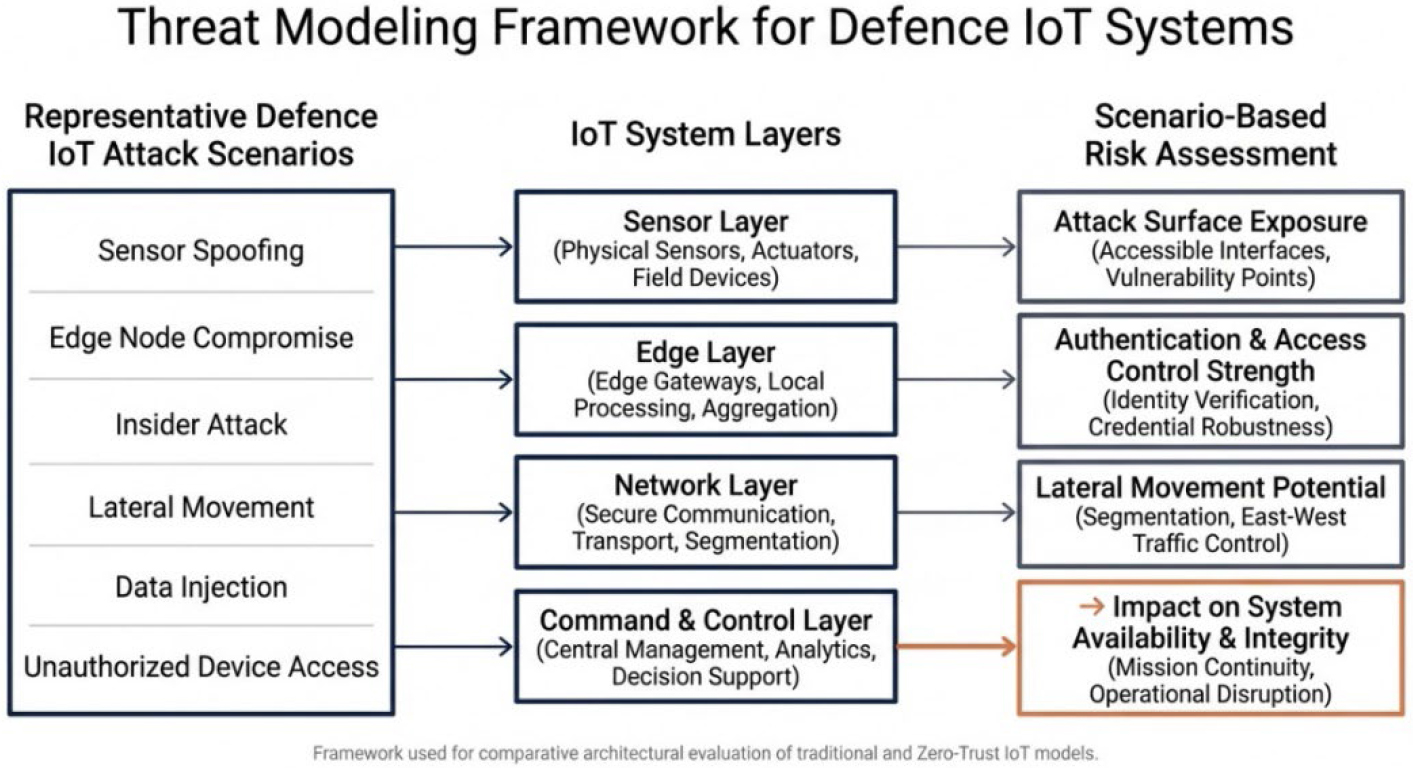
Figure no. 2:
Threat modelling framework for defence IoT systems, illustrating the mapping of representative cyber-physical attack scenarios to IoT system layers and their evaluation using a scenario-based security risk assessment approach
(Source: Author’s conceptual architectural mode)
Table no. 1
Alternative Weighting Verification (AS=0.4, AC=0.3, LM=0.3)
| Attack Scenario | Traditional IoT | Zero-Trust IoT | Comparative Ordering |
|---|---|---|---|
| Sensor Spoofing | 7.9 | 2.8 | Unchanged |
| Edge Node Compromise | 8.7 | 3.7 | Unchanged |
| Insider Attack | 7.3 | 2.8 | Unchanged |
| Lateral Movement | 8.9 | 2.0 | Unchanged |
| Data Injection | 7.9 | 3.0 | Unchanged |
| Unauthorized Device Access | 8.9 | 2.0 | Unchanged |
Table no. 2
Scenario-Level Scoring Justification Matrix (Architecture-Level Assessment)
| Attack Scenario | Architecture | AS | AC | LM | Architectural Justification |
|---|---|---|---|---|---|
| Sensor Spoofing | Traditional IoT | 8 | 7 | 8 | Broad internal reachability following initial access corresponds to the 6-8 AS anchor band defined in Section 5; primarily static device authentication with implicit post-entry trust corresponds to the 6-8 AC anchor band; weak internal containment and multi-component exposure correspond to the 6-8 LM anchor band. |
| Zero-Trust IoT | 3 | 2 | 3 | Logical segmentation limiting cross-layer exposure corresponds to the 3-5 AS anchor band; continuous device identity verification and least-privilege enforcement correspond to the 0-2 AC anchor band; restricted traversal enforced by repeated authorization checks corresponds to the 0-2 LM anchor band. | |
| Edge Node Compromise | Traditional IoT | 9 | 8 | 8 | Elevated privilege potential combined with weak segmentation corresponds to the 9-10 AS anchor band; coarse-grained access control and static authentication correspond to the 6-8 AC anchor band; limited containment once compromise occurs corresponds to the 6-8 LM anchor band. |
| Zero-Trust IoT | 4 | 3 | 4 | Controlled segmentation boundaries and policy-enforced isolation correspond to the 3-5 AS anchor band; context-aware authorization corresponds to the 3-5 AC anchor band; limited cross-segment propagation under enforced policies corresponds to the 3-5 LM anchor band. | |
| Insider Attack | Traditional IoT | 7 | 7 | 8 | Implicit internal trust relationships correspond to the 6-8 AS anchor band; primarily static authentication with broad internal privileges corresponds to the 6-8 AC anchor band; extensive internal traversal capability corresponds to the 6-8 LM anchor band. |
| Zero-Trust IoT | 3 | 2 | 3 | Segmentation that restricts domain-level exposure corresponds to the 3-5 AS anchor band; continuous verification of user and device identity corresponds to the 0-2 AC anchor band; constrained lateral movement enforced through micro-segmentation corresponds to the 0-2 LM anchor band. | |
| Lateral Movement | Traditional IoT | 9 | 8 | 9 | Flat or weakly segmented topology corresponds to the 9-10 AS anchor band; static trust after entry corresponds to the 6-8 AC anchor band; unrestricted internal propagation pathways correspond to the 9-10 LM anchor band. |
| Zero-Trust IoT | 2 | 2 | 2 | Micro-segmentation restricting reachable components corresponds to the 0-2 AS anchor band; continuous authentication and least-privilege enforcement correspond to the 0-2 AC anchor band; repeated authorization checks that prevent cross-domain traversal correspond to the 0-2 LM anchor band. | |
| Data Injection | Traditional IoT | 8 | 7 | 8 | Limited validation controls and broad system connectivity correspond to the 6-8 AS anchor band; primarily static access enforcement corresponds to the 6-8 AC anchor band; weak containment once malicious data is introduced corresponds to the 6-8 LM anchor band. |
| Zero-Trust IoT | 3 | 3 | 3 | Segmented communication pathways correspond to the 3-5 AS anchor band; identity-bound communication policies correspond to the 3-5 AC anchor band; restricted cross-segment propagation corresponds to the 3-5 LM anchor band. | |
| Unauthorized Device Access | Traditional IoT | 9 | 8 | 9 | Weak device identity validation and broad internal exposure correspond to the 9-10 AS anchor band; static authentication mechanisms correspond to the 6-8 AC anchor band; extensive internal traversal capability corresponds to the 9-10 LM anchor band. |
| Zero-Trust IoT | 2 | 2 | 2 | Strong device identity enforcement limiting reachable components corresponds to the 0-2 AS anchor band; continuous authentication and strict least-privilege access correspond to the 0-2 AC anchor band; segmentation-enforced traversal constraints correspond to the 0-2 LM anchor band. |
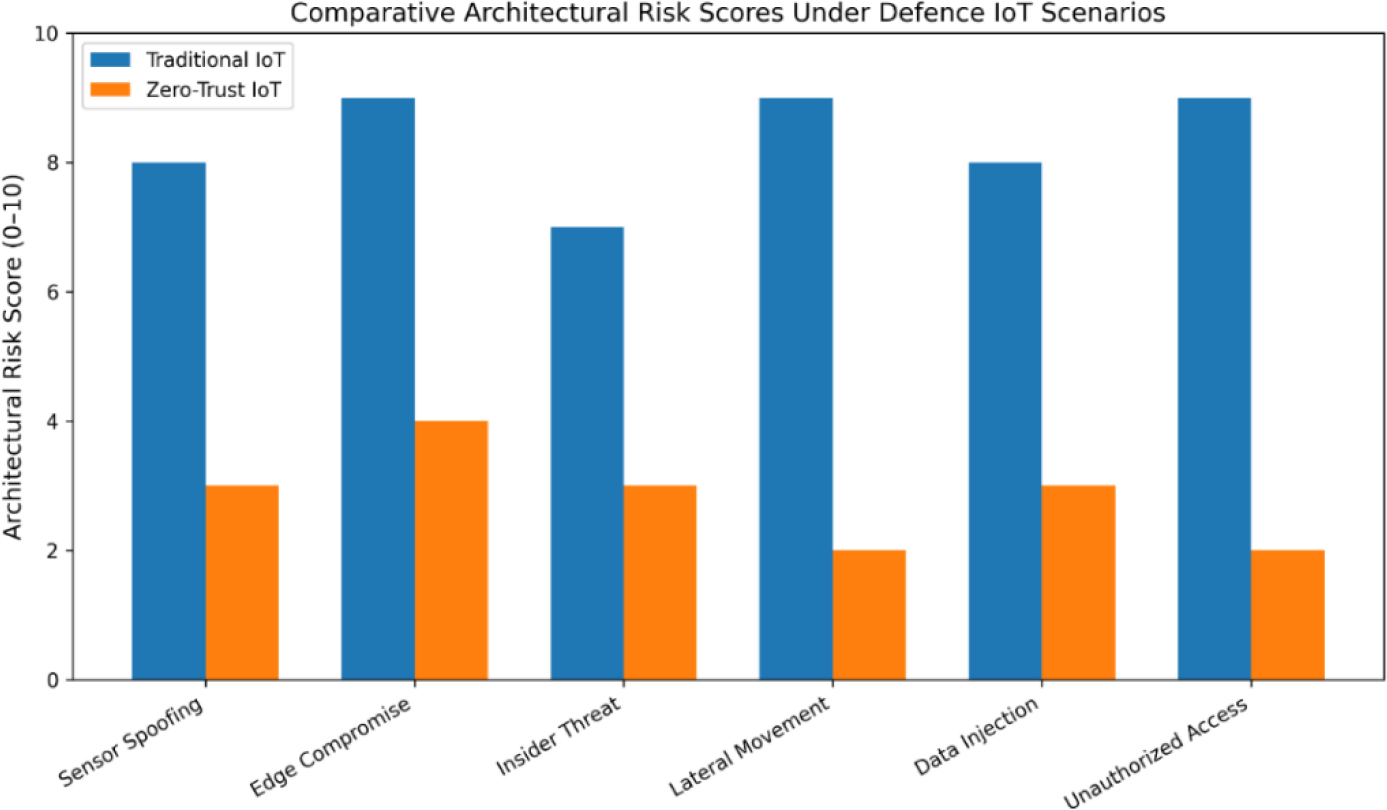
Figure no. 3:
Security Risk Comparison between Traditional IoT and Zero-Trust IoT Architectures
(Source: Author’s model-derived illustration based on the rubric defined in Section 5)
Table no. 3
Security Risk Evaluation Across Defence IoT Attack Scenarios
| Attack Scenario | Traditional IoT Risk Score | Zero-Trust IoT Risk Score | Risk Reduction (%) |
|---|---|---|---|
| Sensor Spoofing | 8 | 3 | 62.50 |
| Edge Node Compromise | 9 | 4 | 55.56 |
| Insider Attack | 7 | 3 | 57.14 |
| Lateral Movement | 9 | 2 | 77.78 |
| Data Injection | 8 | 3 | 62.50 |
| Unauthorized Device Access | 9 | 2 | 77.78 |
1 Note: Risk scores are derived from the structured scenario-based architectural scoring model described in Section 5. Scores are assigned on a normalized ordinal scale from 0 (low relative exposure) to 10 (high relative exposure) based on attack surface exposure, authentication and access control strength, and lateral movement potential. Percentage reductions are computed using Equation (A1) and represent comparative model-derived differences rather than empirical measurements.
1 Table no. 3 presents the scenario-level risk scores assigned to both architectural models using the defined scoring rubric. Across all evaluated attack scenarios, the Zero-Trust IoT architecture receives lower relative exposure scores than the traditional perimeter-based model. These differences reflect the structural characteristics embedded in the Zero-Trust design, including continuous authentication, identity-aware access control, and micro-segmentation. The calculated percentage reductions represent relative improvements in architectural containment capability within the defined evaluation framework. The largest comparative differences are observed in scenarios involving lateral movement and unauthorized device access, where segmentation and continuous authorization mechanisms most directly influence risk exposure.
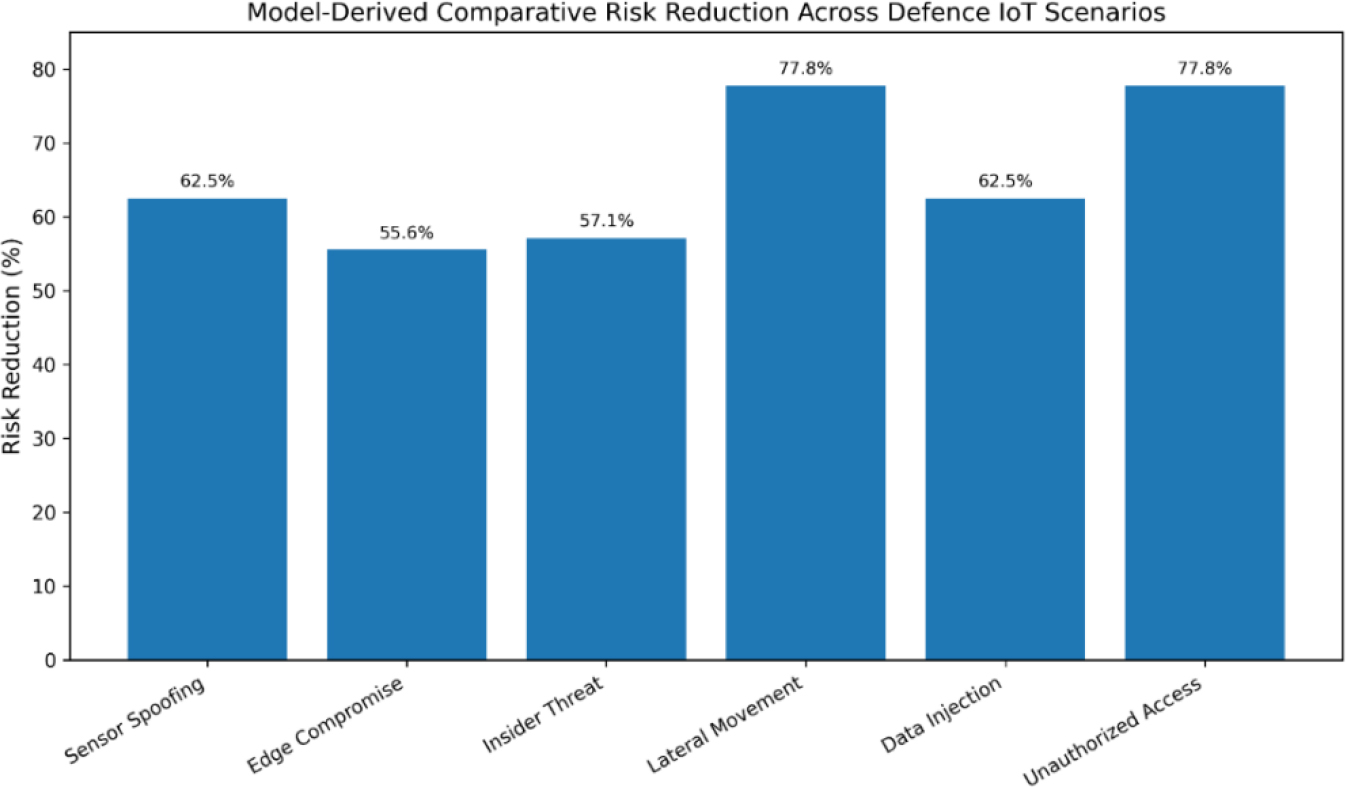
Figure no. 4:
Risk Reduction Achieved by the Zero-Trust IoT Architecture
(Source: Author’s model-derived illustration based on the rubric defined in Section 5)
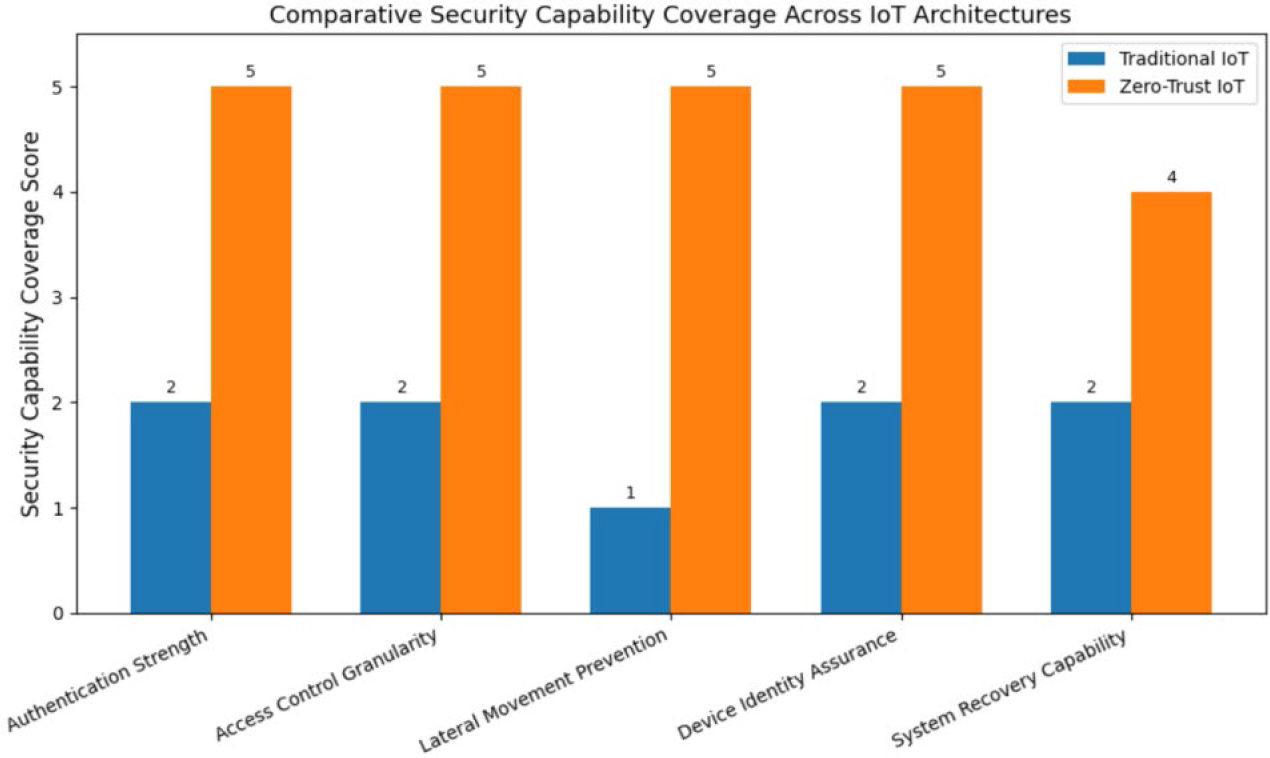
Figure no. 5:
Architecture-Level Security Capability Coverage Comparison
(Source: Author’s model-derived illustration based on the rubric defined in Section 5)
Table no. 4
Architectural Attack Surface Comparison Between Traditional and Zero-Trust IoT Models
| Architecture | Exposed Nodes* | Authentication Model | Lateral Movement Possible | Estimated Recovery Interval (hrs)** |
|---|---|---|---|---|
| Traditional IoT | 120 | Static / Perimeter-Based | Yes | 10-15 |
| Zero-Trust IoT | 45 | Continuous / Identity-Based | No (restricted by segmentation) | 2-5 |
1* Exposed nodes are derived from a reference architectural scenario assuming an illustrative defence IoT deployment consisting of approximately 120 interconnected components (sensors, edge nodes, and command elements). The values represent model-based comparative estimates of reachable components under each architectural paradigm rather than empirical deployment counts.
1** Estimated recovery interval reflects structured architectural assumptions regarding containment visibility and segmentation-based isolation capabilities. These values represent comparative model-derived interval estimates within the defined evaluation framework and do not correspond to measured operational recovery durations.