

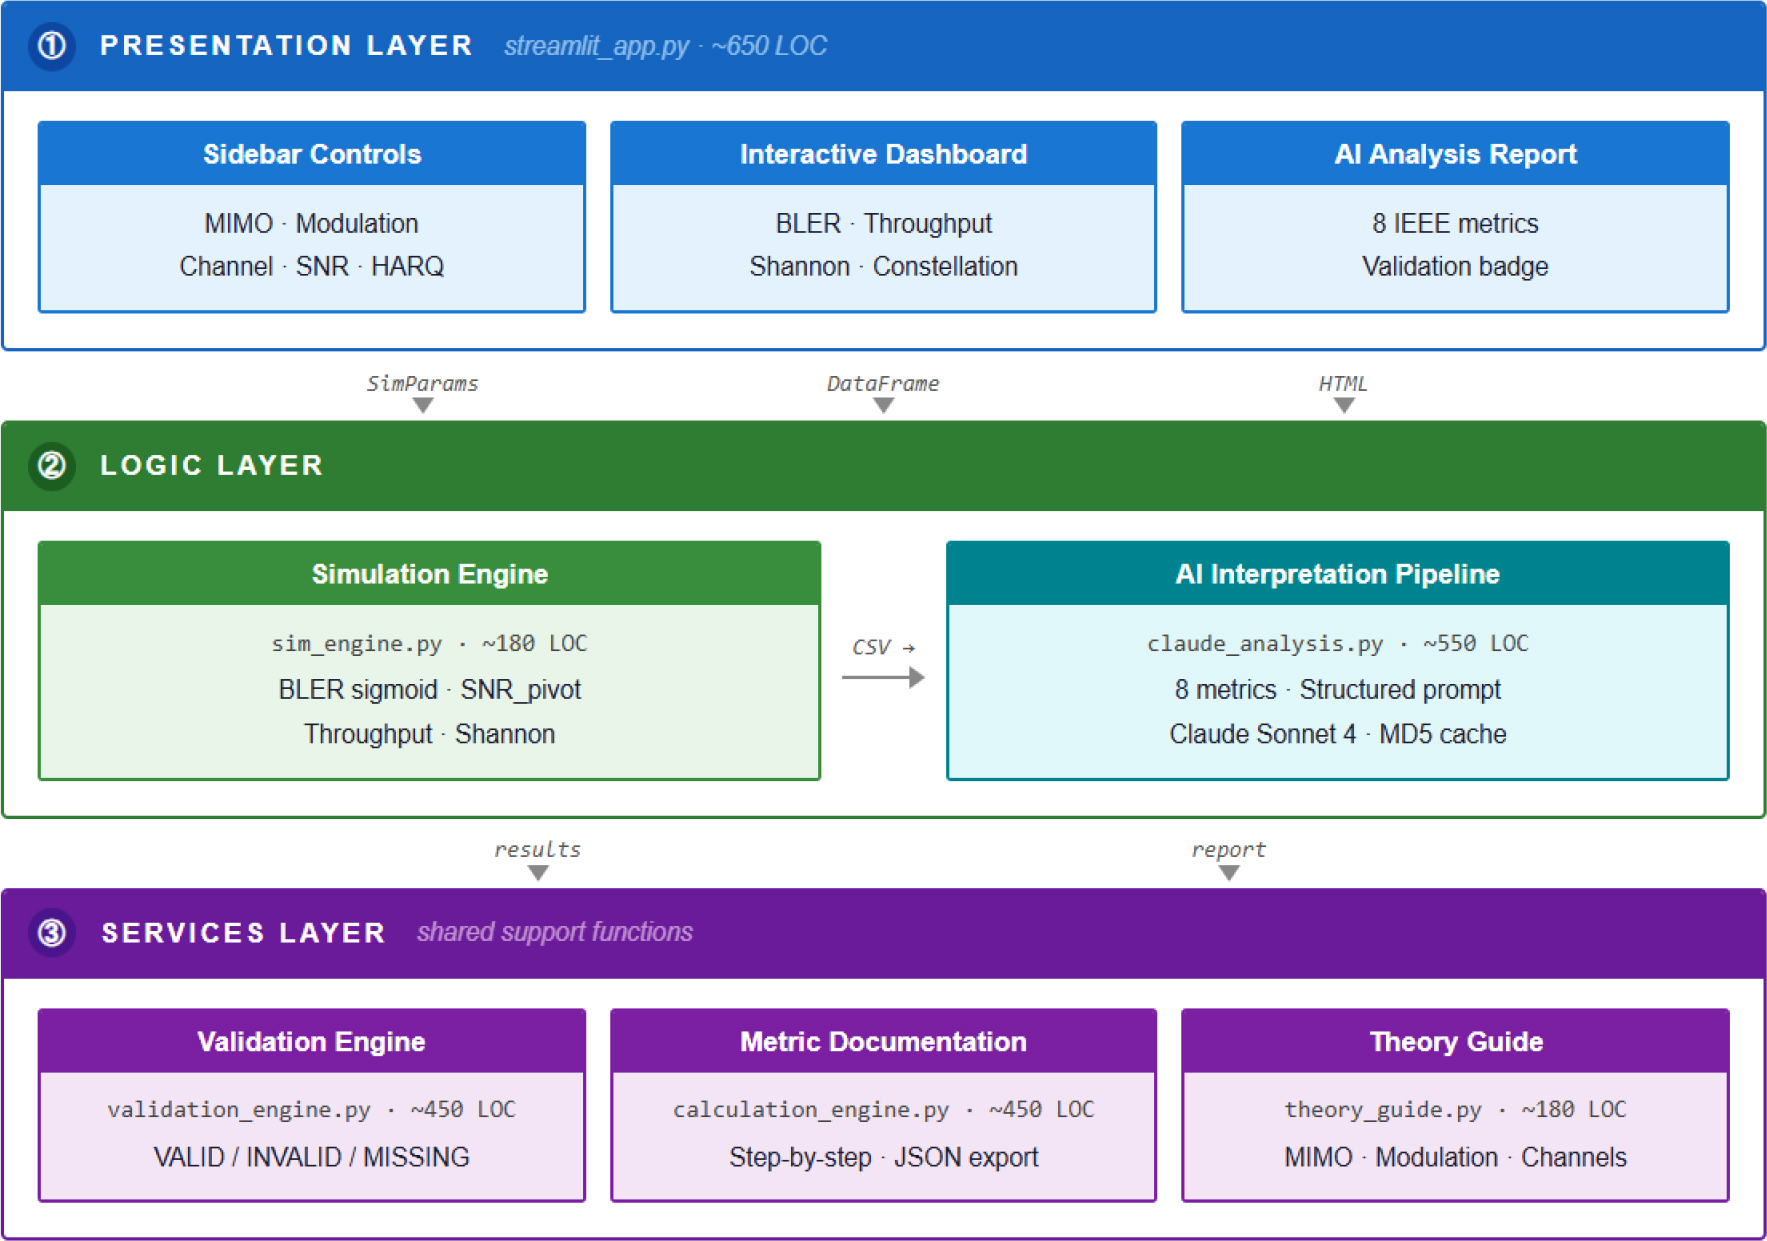
Figure no. 1:
Three-layer MVC-inspired architecture of the proposed LTE simulalion platform. Solid arrows indicate primary data flow between layers
(Source: Author’s own conception)
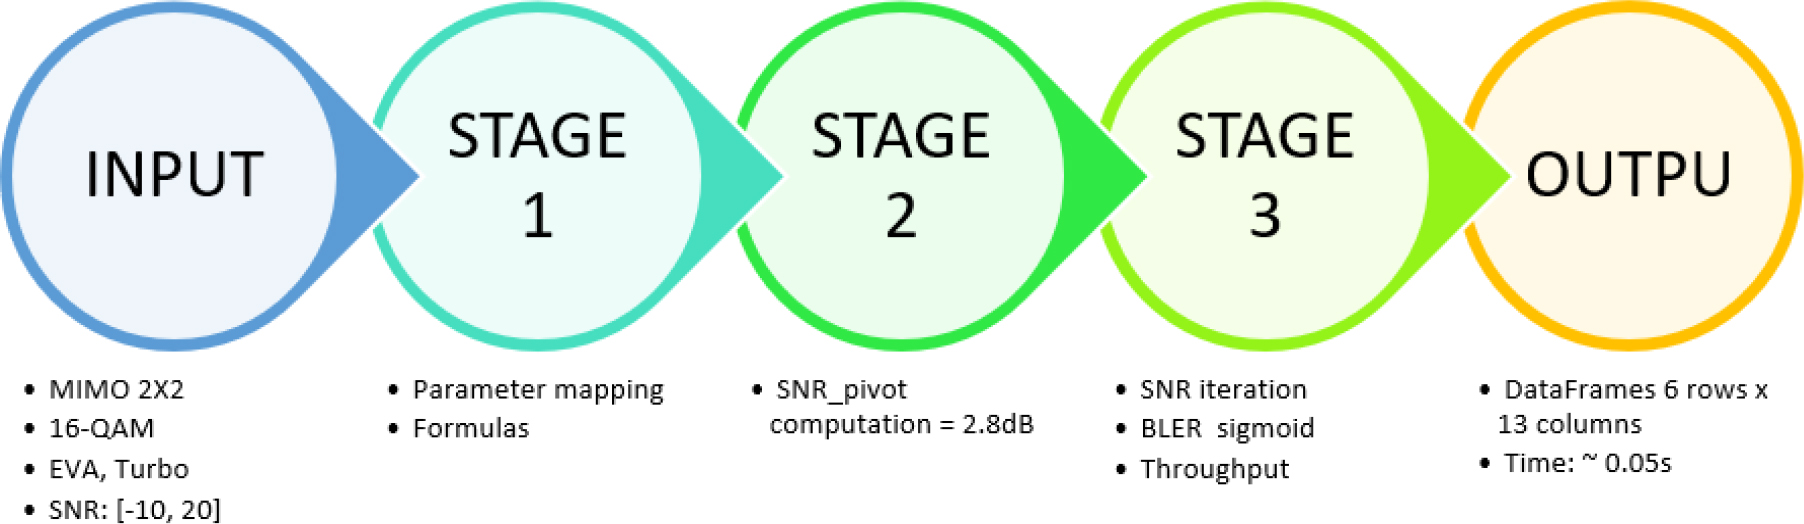
Figure no. 2:
Three-stage computation pipeline of the LTE simulation engine
(Source: Author’s own conception)
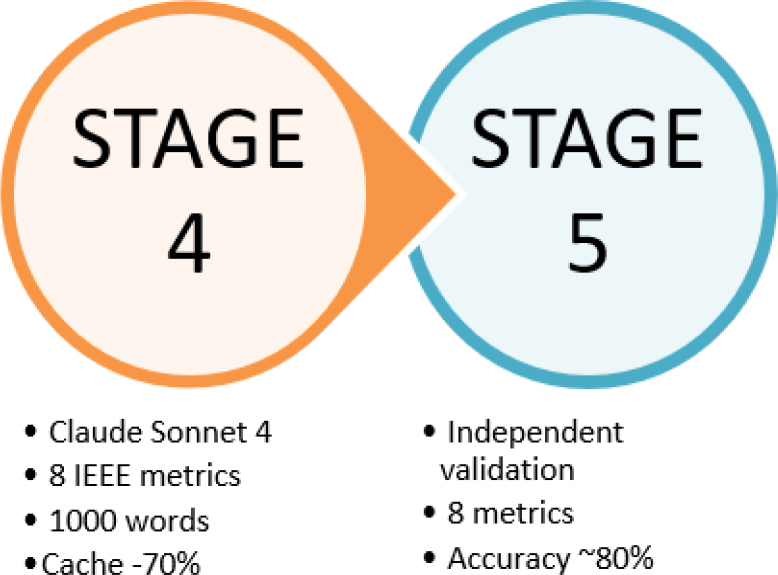
Figure no. 3:
Two-stage AI interpretation and validation pipeline: Stage 4 generates a structured academic report via Claude Sonnet 4; Stage 5 independently verifies all eight IEEE metrics against NumPy-computed reference values
(Source: Author’s own conception)
Table no.1
Experimental scenario parameters
| Parameter | Scenario I | Scenario II | Scenario III |
|---|---|---|---|
| Variable factor | MIMO mode (SISO → MIMO 2×2) | Channel model (EPA / EVA / ETU) | Modulation scheme (QPSK / 16-QAM / 64-QAM) |
| MIMO mode | SISO · SIMO 1×2 · MISO 2×1 · MIMO 2×2 | MIMO 2×2 (fixed) | MIMO 2×2 (fixed) |
| Modulation | 16-QAM (fixed) | 16-QAM (fixed) | QPSK · 16-QAM · 64-QAM |
| Channel coding | Turbo (fixed) | Turbo (EPA, EVA) · LDPC (ETU) | Turbo (fixed) |
| Channel model | EVA (fixed) | EPA · EVA · ETU | EVA (fixed) |
| Doppler frequency | 70 Hz (fixed) | 5 Hz · 70 Hz · 300 Hz | 70 Hz (fixed) |
| HARQ retransmissions | 0 (fixed) | 1 (EPA) · 0 (EVA, ETU) | 0 (fixed) |
| Antenna correlation ρ | 0.3 (fixed) | 0.3 (fixed) | 0.3 (fixed) |
| CSI feedback delay | 1.0 ms (fixed) | 1.0 ms (fixed) | 1.0 ms (fixed) |
| SNR range | −5 → 25 dB | −5→25 / −10→20 / 0→30 dB | −5 → 25 dB |
| SNR step | 2 dB | 2 dB | 2 dB |
| Standard | 3GPP TS 36.104 (3GPP, 2016) | 3GPP TS 36.104 (3GPP, 2016) | 3GPP TS 36.104 (3GPP, 2016) |
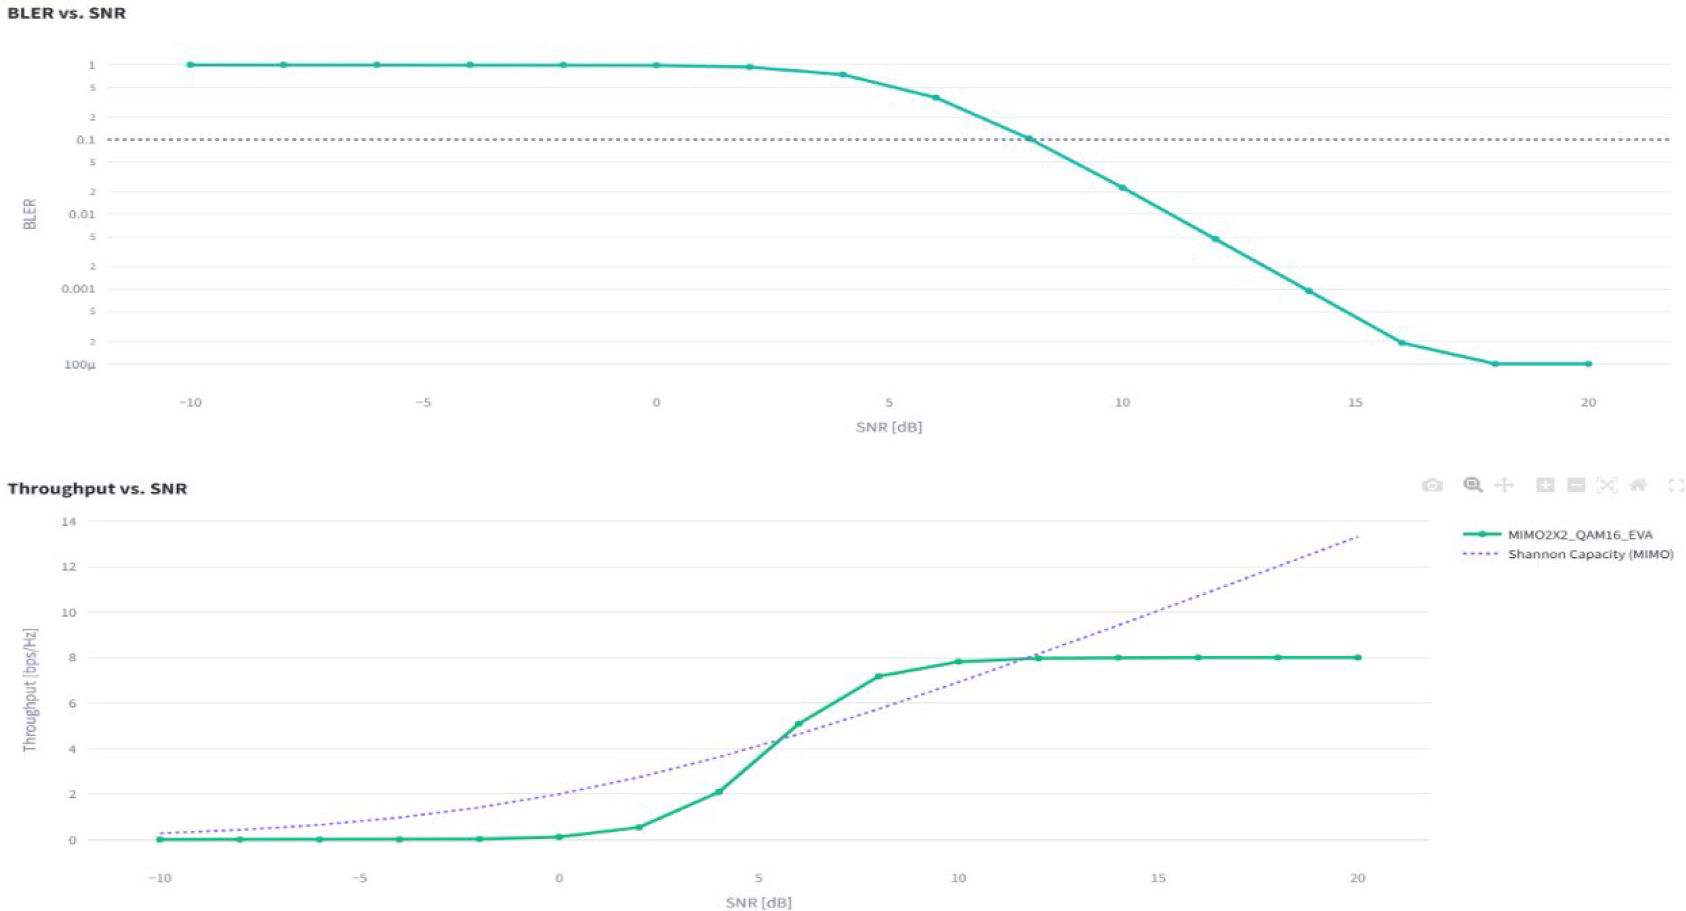
Figure no.4:
Simulated BLER vs. SNR (up) and spectral efficiency vs. SNR (down) for the MIMO 2×2, 16-QAM, EVA reference configuration. Dashed horizontal line at BLER = 10% indicates the 3GPP operational threshold. Dashed blue curve represents the Shannon capacity bound
(Source: LTE Simulator)
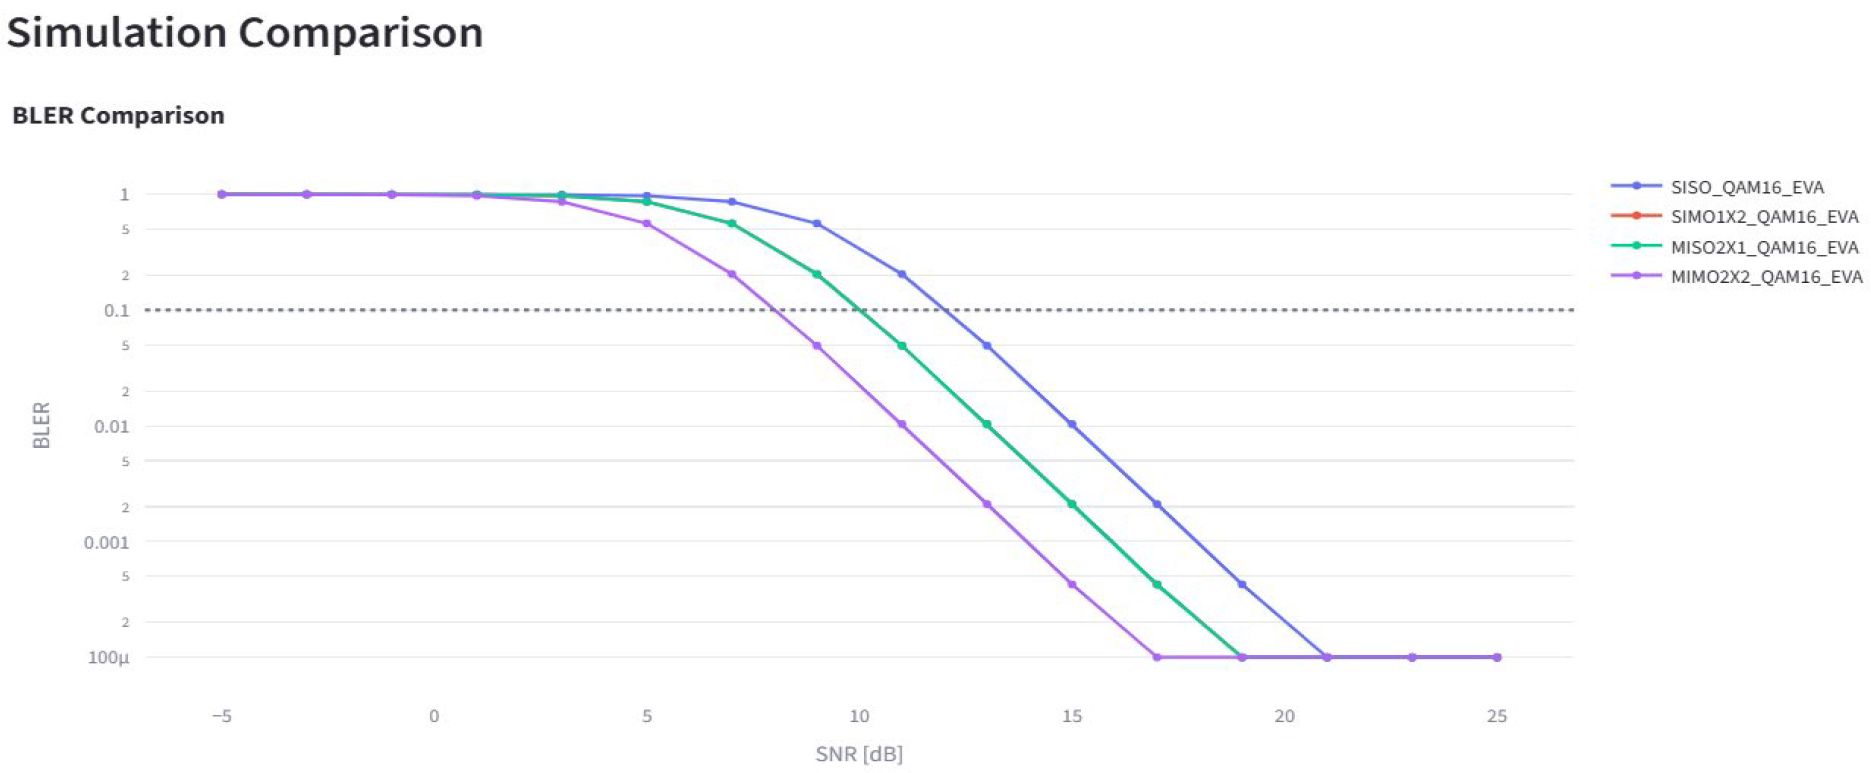
Figure no. 5:
BLER vs. SNR comparison for SISO, SIMO 1×2, MISO 2×1, and MIMO 2×2 under fixed 16-QAM, EVA, 70 Hz Doppler conditions
(Source: LTE Simulator)
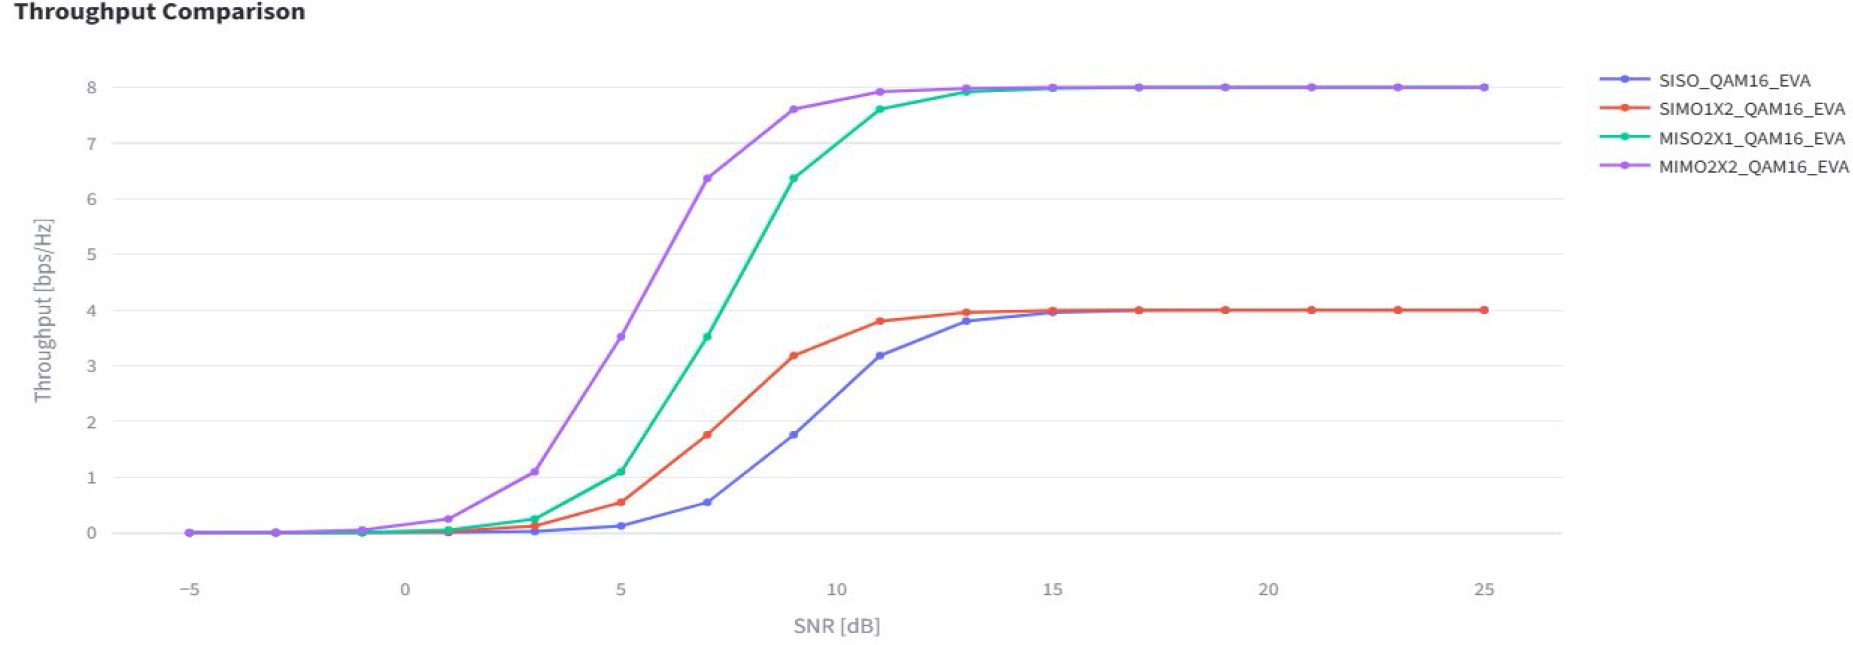
Figure no. 6:
Spectral efficiency vs. SNR for the four antenna configurations. MISO and MIMO 2×2 achieve 8.0 bps/Hz peak through simultaneous two-stream spatial multiplexing
(Source: LTE Simulator)
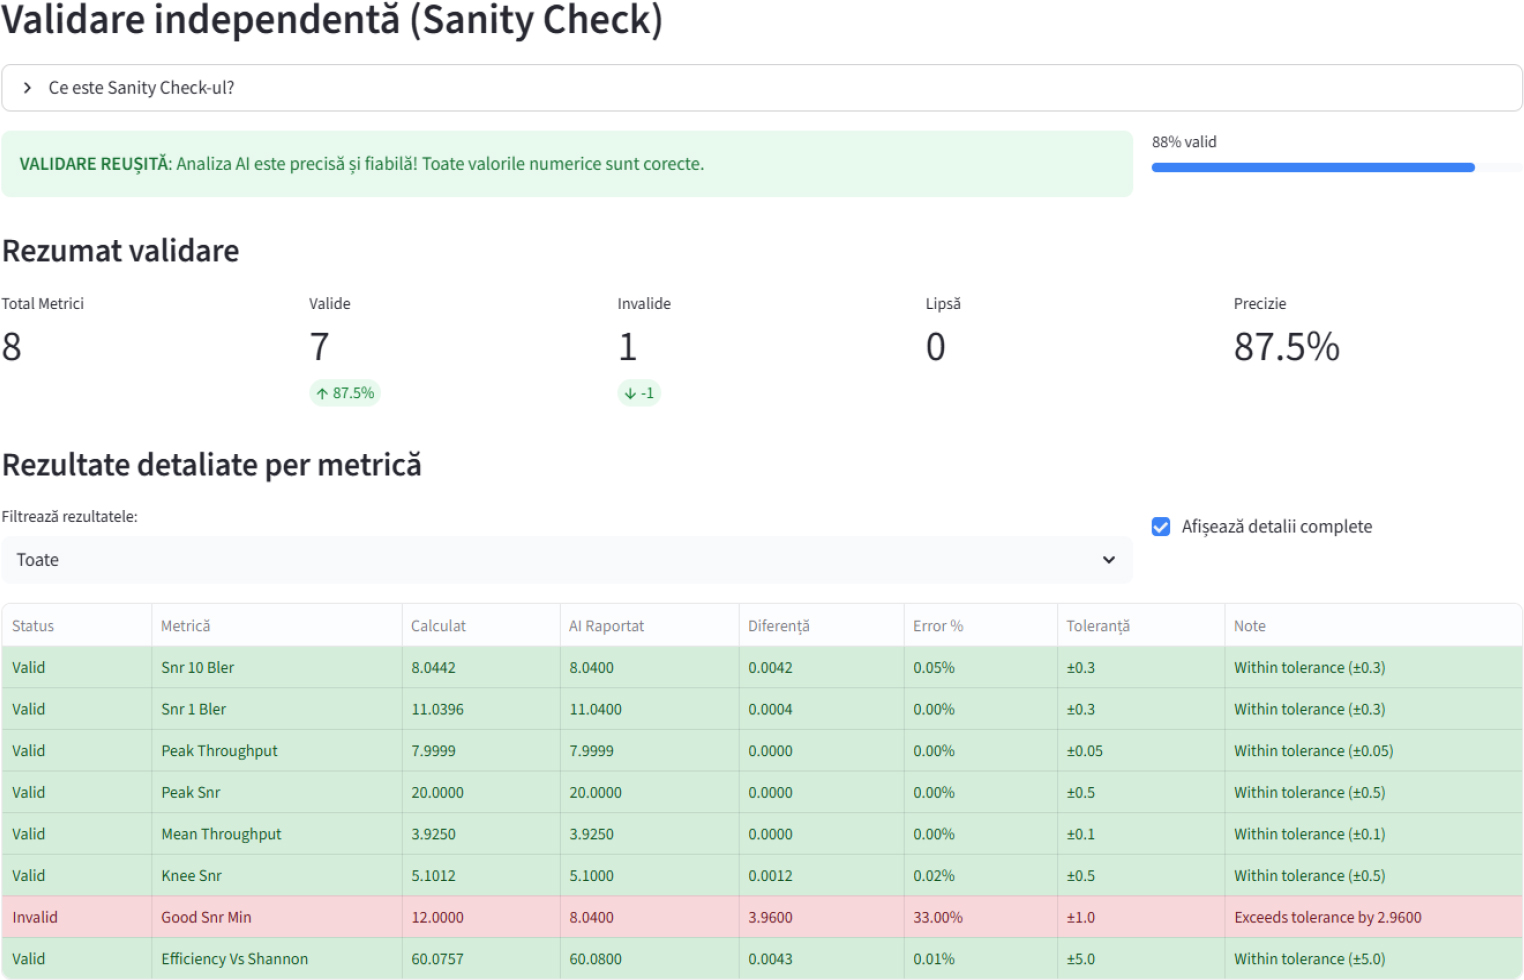
Figure no. 7:
Independent validation dashboard for the MIMO 2×2, 16-QAM, EVA reference configuration, showing per-metric VALID/INVALID status, absolute deviations, and overall accuracy score
(Source: LTE Simulator)
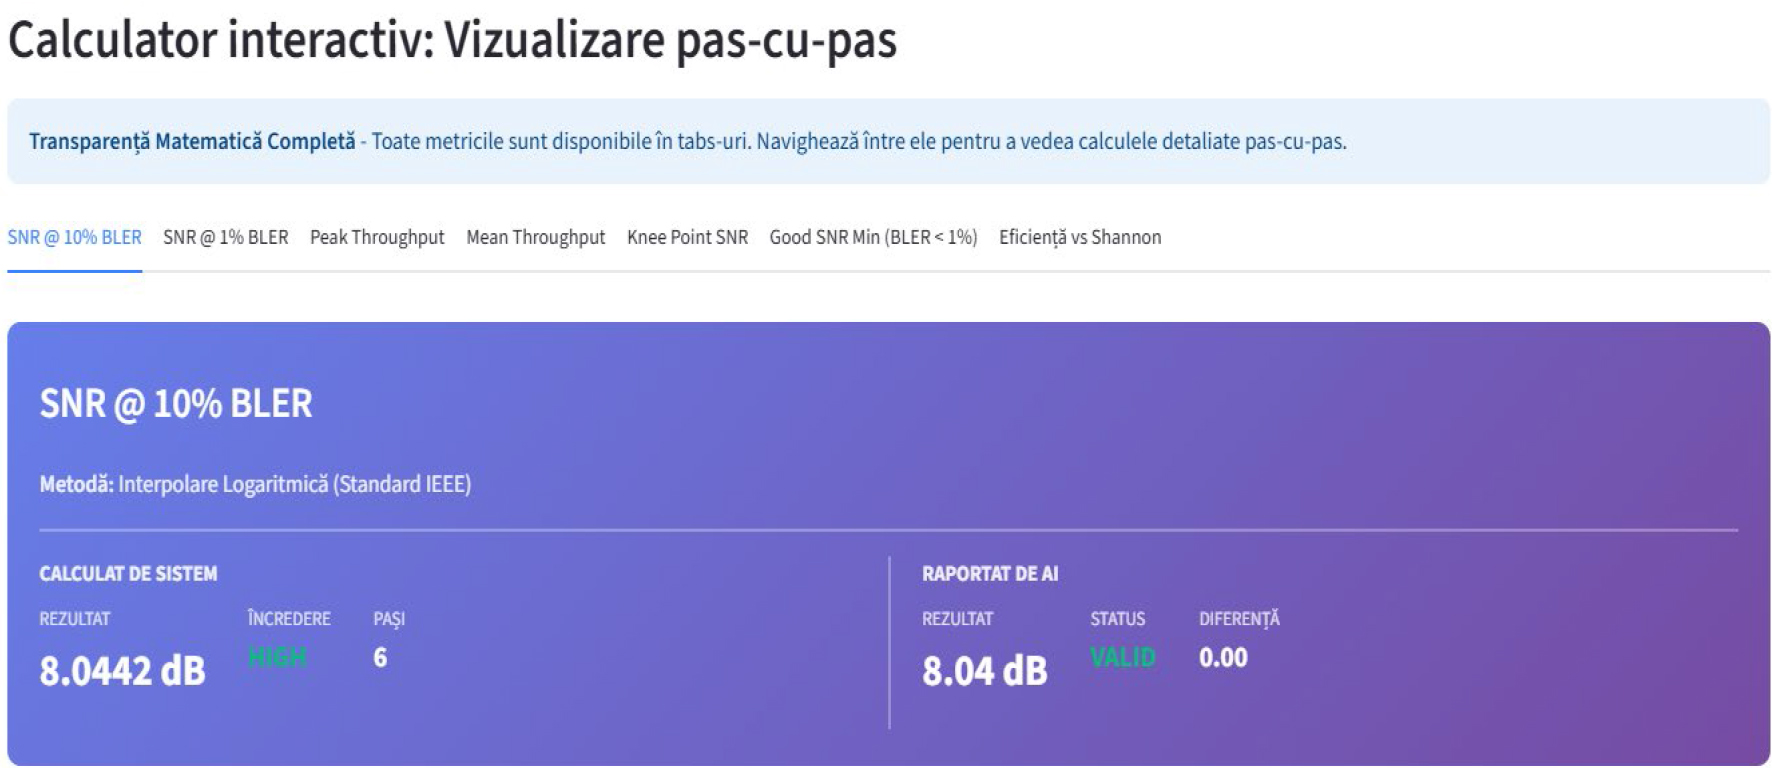
Figure no. 8:
Side-by-side comparison of independently computed metric values (left column) versus AI-reported values extracted via regular expression pattern matching (right column), for the SNR @ 10% BLER metric
(Source: LTE Simulator)
Table no. 2
AI validation results for MIMO 2x2, 16-QAM, EVA reference configuration
| Metric | AI Reported | NumPy Computed | Deviation | Status |
|---|---|---|---|---|
| SNR @ 10% BLER | 8.04 dB | 8.0442 dB | 0.05% | VALID |
| SNR @ 1% BLER | 12.00 dB | 12.00 dB | 0.00% | VALID |
| Peak Throughput | 7.9999 bps/Hz | 7.9999 bps/Hz | 0.00% | VALID |
| Mean Throughput | 4.55 bps/Hz | 4.5485 bps/Hz | 0.00% | VALID |
| Knee SNR | 5.94 dB | 5.94 dB | 0.02% | VALID |
| Good SNR Min | 8.04 dB | 12.00 dB | 33.0% | INVALID |
| Peak SNR | 14.00 dB | 14.00 dB | 0.00% | VALID |
| Shannon Efficiency | 60.08% | 60.08% | <0.01% | VALID |