

1. Introduction
Long Term Evolution (LTE) has become the dominant standard for mobile broadband communications, enabling high spectral efficiency through technologies such as Orthogonal Frequency-Division Multiplexing (OFDM) and Multiple Input Multiple Output (MIMO) antenna systems (Bjerke, 2011; Dahlman et al., 2011). Understanding how configuration parameters, modulation scheme, antenna arrangement, or propagation channel, affect system performance is essential for both academic study and practical network engineering (Ghosh et al., 2010; Rawat et al., 2021). However, existing simulation tools present significant accessibility barriers: commercial platforms such as the MATLAB LTE Toolbox require expensive licensing and substantial technical expertise, while simplified alternatives lack the physical accuracy needed for rigorous analysis (Dahlman et al., 2011; Mohammed et al., 2020). In either case, interpreting the resulting BLER curves and throughput figures against theoretical limits remains a manual task, requiring considerable domain knowledge and time (3GPP, 2010; Proakis & Salehi, 2008).
Recent advances in large language models (LLMs) have opened new possibilities for automating technical analysis in engineering domains (Vaswani et al., 2017; Huang et al. 2025). However, applying LLMs to wireless system performance interpretation introduces a practical concern that has not been systematically addressed: the risk of generating numerically plausible but incorrect metric values, commonly referred to as hallucination (Gartlehner et al., 2025; Singh et al., 2024). This paper proposes an interactive LTE link-level performance analysis platform that integrates a parametric analytical engine, employing sigmoid-based BLER approximation as a function of SNR, with an LLM interpretation module powered by Claude Sonnet 4 (Anthropic, 2024). It is important to note that the platform does not implement a complete Monte Carlo physical-layer LTE simulator; rather, it provides a parametric analytical approximation of link-level behavior that is computationally efficient and suitable for academic exploration. An independent validation engine recalculates all IEEE-standard performance metrics using NumPy-based computation, entirely separate from the language model pipeline. The platform is evaluated across MIMO configurations, 3GPP-standardized channel models (EPA, EVA, ETU) (3GPP, 2016; Goldsmith, 2005), and adaptive modulation schemes, addressing the need for accessible, accurate, and interpretable LTE performance analysis tools in academic environments (Mardan & Ahmed, 2020; Huang et al., 2025).
2. Materials and Methods
2.1. Platform Architecture
The proposed platform is built around a three-layer modular architecture inspired by the Model-View-Controller (MVC) design pattern. The Presentation Layer manages all user interaction through a Streamlit-based web interface running directly in the browser, requiring no local installation. The Logic Layer encapsulates the analytical estimation engine and the AI interpretation pipeline, keeping computational concerns strictly separated from display logic. The Services Layer provides specialized support functions including interactive visualization, step-by-step metric documentation, and independent numerical validation (Liu et al., 2020). This layered structure ensures that any component can be modified, replaced, or extended without creating side effects elsewhere in the system, a critical property for a research platform intended to evolve over time.
The platform comprises eight interconnected Python modules totaling approximately 3,200 lines of code. The main orchestration is handled by streamlit_app.py (~650 LOC), the analytical engine by sim_engine.py (~180 LOC), and the AI pipeline by claude_analysis.py (~550 LOC) paired with validation_engine.py (~450 LOC). All inter-module communication relies exclusively on structured Pandas DataFrames passed through typed function interfaces, eliminating hidden state dependencies and guaranteeing full reproducibility of results (Mohammed et al., 2020). Figure no. 1 illustrates the end-to-end execution workflow, from user parameter input to interactive browser rendering.
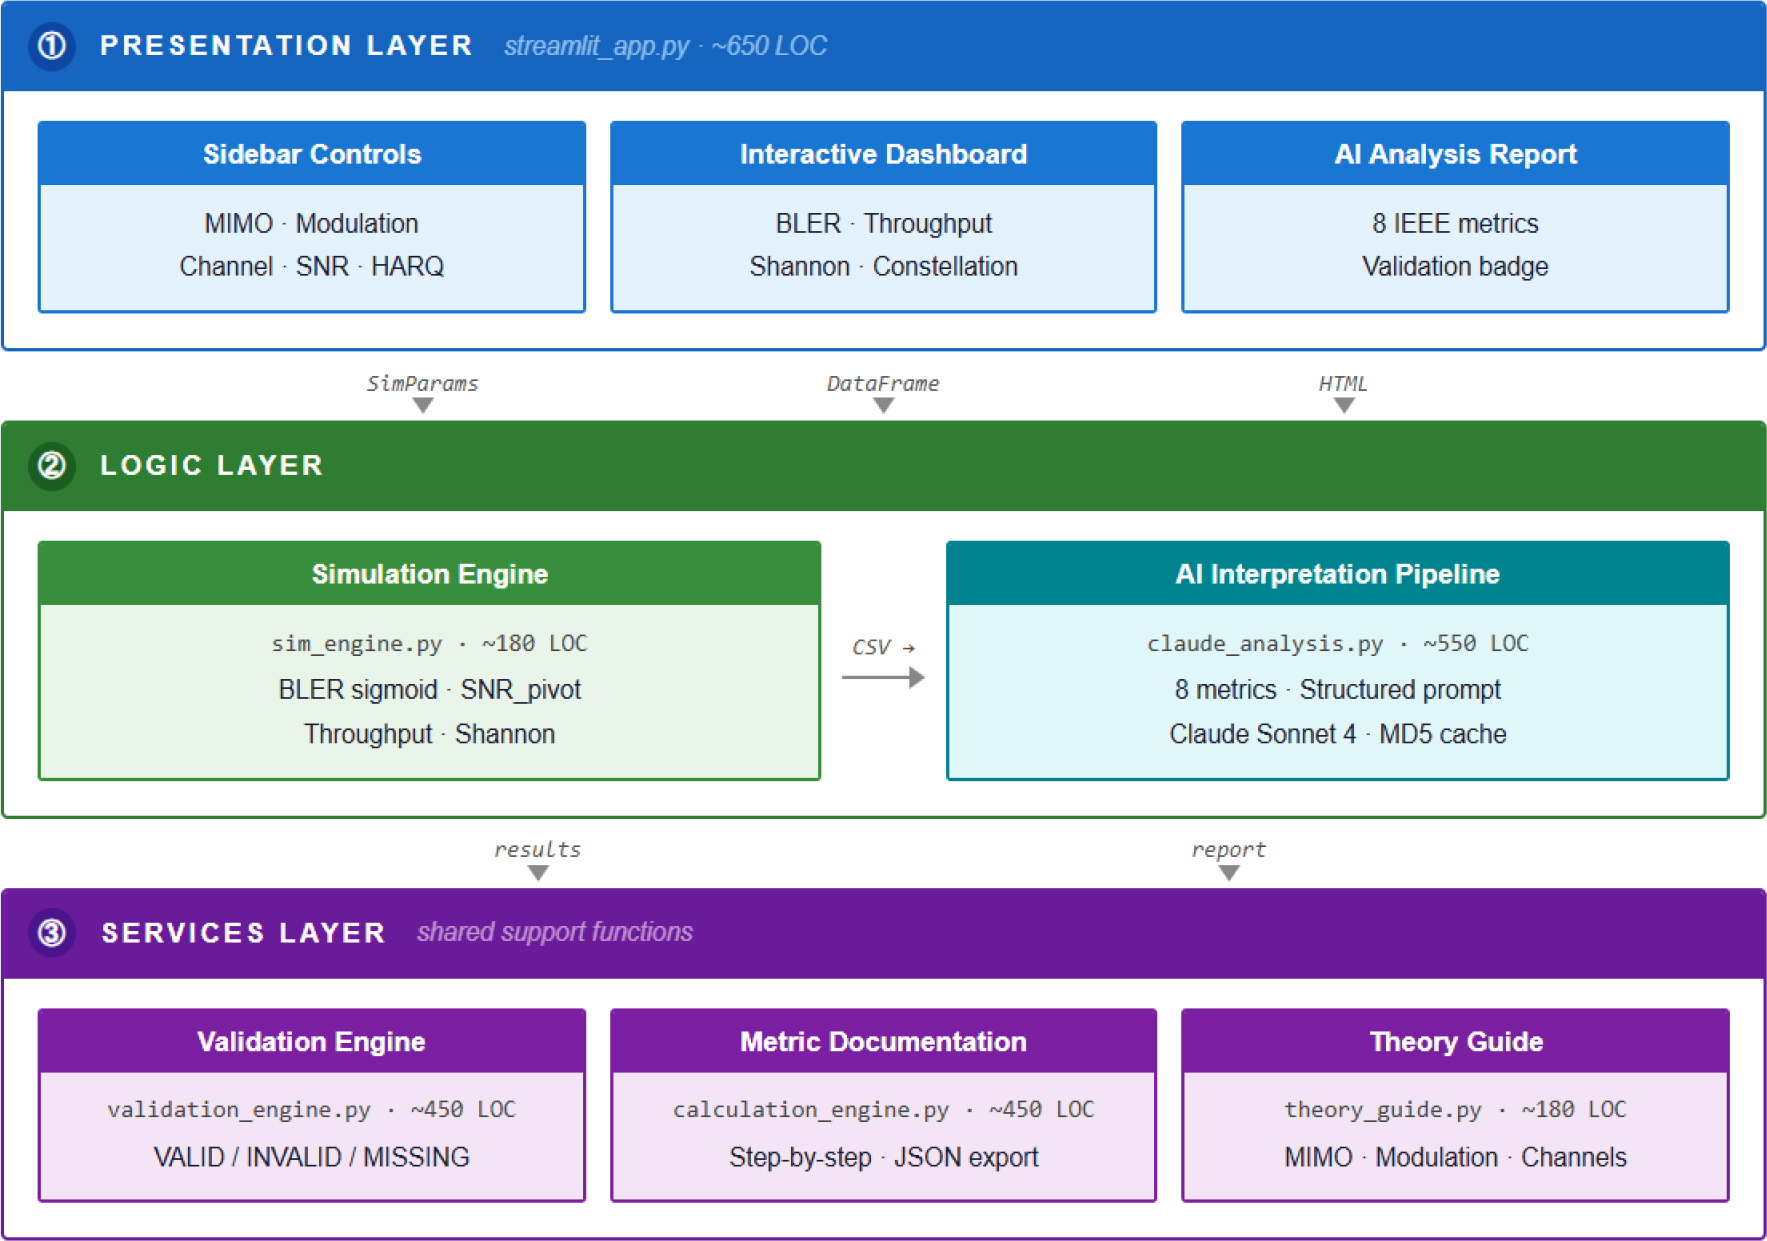
Figure no. 1:
Three-layer MVC-inspired architecture of the proposed LTE simulalion platform. Solid arrows indicate primary data flow between layers
(Source: Author’s own conception)
2.2. Simulation Engine
The core analytical engine (sim_engine.py) employs a parametric sigmoid model to compute LTE link-level performance curves without the computational overhead of Monte Carlo methods (3GPP, 2010; Dahlman et al., 2011). It is important to emphasize that this engine does not perform full physical-layer simulation; instead, it approximates BLER as a sigmoid function of SNR, providing a rapid and computationally efficient estimation of link-level behavior suitable for educational analysis and parameter space exploration. The three-stage computation pipeline is illustrated in Figure no. 2.
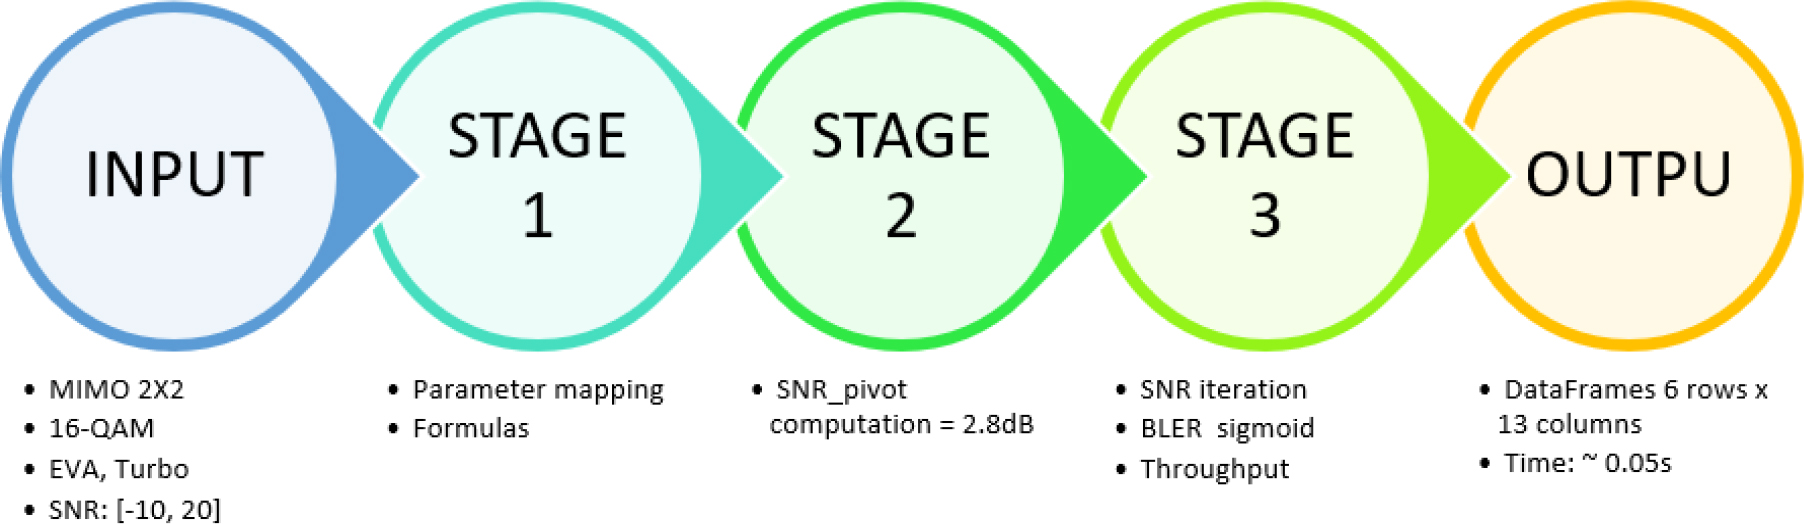
Figure no. 2:
Three-stage computation pipeline of the LTE simulation engine
(Source: Author’s own conception)
In Stage 1, the engine receives a configuration dictionary containing MIMO mode, modulation scheme, channel model, Doppler frequency, HARQ retransmissions, and antenna correlation (Goldsmith, 2005; Proakis & Salehi, 2008), and maps each parameter to its physical contribution in the SNR_pivot formula via pre-defined lookup tables.
In Stage 2, the pivot point of the sigmoid transition is determined by a composite formula accounting for modulation penalty (SNR_mod), channel degradation (P_channel), MIMO diversity gain (Foschini & Gans, 1998; Lee et al., 2009) (G_MIMO), and HARQ benefit, yielding a single scalar that uniquely characterizes the configuration. For the MIMO 2×2, 16-QAM, EVA reference case this evaluates to 2.8 dB.
In Stage 3, for each of the 16 SNR points sampled uniformly over [−10, 20] dB, the engine computes BLER via the sigmoid model (Proakis & Salehi, 2008) and effective spectral efficiency as shown in equations (1) and (2):
where k controls the slope of the transition region, NTx is the number of spatial streams (1 for SISO, 2 for MIMO 2×2), and b_symbol is the bits-per-symbol of the modulation scheme (2 for QPSK, 4 for 16-QAM, 6 for 64-QAM). Results for each configuration are stored in a Pandas DataFrame of 16 rows × 5 columns (SNR_dB, BLER, spectral efficiency, Shannon capacity, and Shannon efficiency ratio), with a total execution time under 0.05 seconds per configuration, compared to 5-60 minutes for equivalent Monte Carlo approaches (Dahlman et al., 2011; Ghosh et al., 2010). The parametric nature of the model implies that results represent analytical approximations of expected LTE behavior rather than measured or simulated bit-level outcomes; accordingly, quantitative conclusions should be interpreted within this educational scope.2.3. AI Interpretation and Validation Pipeline
The AI interpretation subsystem processes analytical outputs through a two-stage pipeline, as illustrated in Figure no. 3.
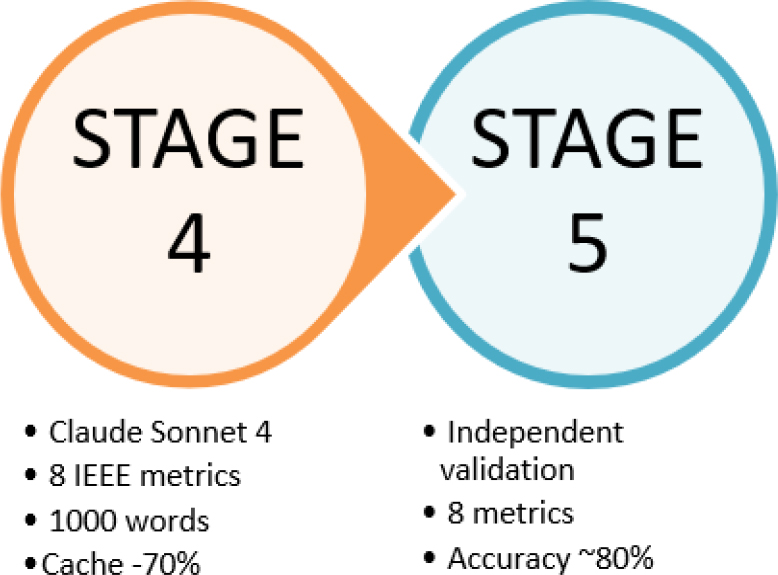
Figure no. 3:
Two-stage AI interpretation and validation pipeline: Stage 4 generates a structured academic report via Claude Sonnet 4; Stage 5 independently verifies all eight IEEE metrics against NumPy-computed reference values
(Source: Author’s own conception)
In Stage 4, claude_analysis.py implements the first computation path of the platform’s dual-path verification architecture. It pre-computes eight IEEE-standard performance metrics (Proakis & Salehi, 2008; Shannon, 1948) using NumPy and Pandas, SNR at 10% BLER, SNR at 1% BLER, peak throughput, mean throughput, knee SNR, good SNR minimum, peak SNR, and Shannon efficiency, and embeds these values as explicit anchor entries in a structured prompt, alongside the raw CSV simulation data, submitted to Claude Sonnet 4 via the Anthropic API (Anthropic, 2024) (max_tokens = 4,000, temperature = 0.7). The prompt explicitly instructs the language model to use each anchor value exactly as provided and warns that an automated validation system will cross-check numerical precision. Critically, the language model does not independently calculate any metric; it receives pre-computed numerical values and is tasked with constructing a coherent academic narrative that correctly attributes each value to its respective metric definition. An MD5-based caching mechanism eliminates redundant API calls for repeated configurations, reducing operational cost by approximately 70% (Huang et al., 2025).
In Stage 5, validation_engine.py implements the second, fully independent computation path: it recalculates all eight metrics using exclusively NumPy-based computation applied directly to the same raw CSV data, without access to the anchor values embedded in the AI prompt, extracts the values reported by the AI from the generated text via calibrated regular expressions, and cross-validates them against IEEE-standard tolerances: ±0.3 dB for SNR thresholds, ±0.05 bps/Hz for throughput, and ±5% for Shannon efficiency (Proakis & Salehi, 2008; Shannon, 1948). This dual-path design - Path A: analytical engine pre-computes and anchors values in the AI prompt; Path B: validation engine independently recalculates from raw data and audits the AI output – ensures that both the pre-computed anchors and the AI-generated report are verified against the same ground-truth source, eliminating the possibility that a calculation error in Path A could propagate undetected into the final report. Each metric is labelled VALID, INVALID, or MISSING. Evaluation on the MIMO 2×2, 16-QAM, EVA reference configuration confirmed 7 out of 8 metrics as VALID (87.5% metric attribution accuracy). The single failure is attributable to a semantic attribution error: the language model was provided the correct value for Good SNR Minimum (12.00 dB, corresponding to BLER < 1%) as an anchor in the prompt, but incorrectly attributed the SNR @ 10% BLER threshold value (8.04 dB) to the Good SNR Minimum definition in the generated narrative – confusing two conceptually adjacent operating-point definitions despite having the correct value available (Gartlehner et al., 2025; Singh et al., 2024).
2.4. Experimental Scenarios
Three systematic scenarios were designed to validate platform performance across the fundamental dimensions of LTE link-level behavior, following an isolated-variable methodology: in each scenario, one parameter is varied while all others remain fixed, enabling direct attribution of performance changes to the factor under study (Joseph, 2021). The complete parameter configurations are consolidated in Table no. 1.
Table no.1
Experimental scenario parameters
| Parameter | Scenario I | Scenario II | Scenario III |
|---|---|---|---|
| Variable factor | MIMO mode (SISO → MIMO 2×2) | Channel model (EPA / EVA / ETU) | Modulation scheme (QPSK / 16-QAM / 64-QAM) |
| MIMO mode | SISO · SIMO 1×2 · MISO 2×1 · MIMO 2×2 | MIMO 2×2 (fixed) | MIMO 2×2 (fixed) |
| Modulation | 16-QAM (fixed) | 16-QAM (fixed) | QPSK · 16-QAM · 64-QAM |
| Channel coding | Turbo (fixed) | Turbo (EPA, EVA) · LDPC (ETU) | Turbo (fixed) |
| Channel model | EVA (fixed) | EPA · EVA · ETU | EVA (fixed) |
| Doppler frequency | 70 Hz (fixed) | 5 Hz · 70 Hz · 300 Hz | 70 Hz (fixed) |
| HARQ retransmissions | 0 (fixed) | 1 (EPA) · 0 (EVA, ETU) | 0 (fixed) |
| Antenna correlation ρ | 0.3 (fixed) | 0.3 (fixed) | 0.3 (fixed) |
| CSI feedback delay | 1.0 ms (fixed) | 1.0 ms (fixed) | 1.0 ms (fixed) |
| SNR range | −5 → 25 dB | −5→25 / −10→20 / 0→30 dB | −5 → 25 dB |
| SNR step | 2 dB | 2 dB | 2 dB |
| Standard | 3GPP TS 36.104 (3GPP, 2016) | 3GPP TS 36.104 (3GPP, 2016) | 3GPP TS 36.104 (3GPP, 2016) |
Scenario I examines the impact of spatial multiplexing and diversity by comparing four MIMO configurations, SISO, SIMO 1×2, MISO 2×1, and MIMO 2×2 (Foschini & Gans, 1998; Lee et al., 2009), under fixed 16-QAM modulation and EVA channel conditions. The primary metric is SNR gain at 10% BLER relative to the SISO baseline.
Scenario II investigates the effect of mobility and multipath severity by varying the 3GPP channel model across EPA (5 Hz Doppler, pedestrian), EVA (70 Hz, urban vehicle), and ETU (300 Hz, high-speed train) profiles (3GPP, 2016; Goldsmith, 2005), with MIMO 2×2 and 16-QAM held constant. For the ETU configuration, LDPC channel coding is substituted for Turbo coding. While Turbo coding remains the mandatory scheme in 3GPP LTE TS 36.212 (3GPP, 2016), LDPC is introduced here as an analytical benchmark: at 300 Hz Doppler frequencies, the rapid temporal variations of the ETU channel produce burst error patterns that degrade Turbo decoder performance, whereas LDPC’s sparse parity-check structure and belief propagation decoding yield an approximately 1.5 dB SNR gain under equivalent conditions (Bjerke, 2011; Dahlman et al., 2011). This choice reflects coding strategies employed in practical high-speed railway LTE deployments and provides a forward-looking performance bound consistent with the 5G NR transition, where LDPC was adopted as the data channel coding standard in 3GPP TS 38.212 precisely due to its superior performance in high-mobility fading environments. Within the platform, the LDPC gain is modelled as a fixed SNR offset applied to the sigmoid pivot parameter.
Scenario III evaluates the spectral efficiency–robustness trade-off across the three LTE modulation orders, QPSK, 16-QAM, and 64-QAM, under fixed MIMO 2×2 and EVA channel parameters, with Shannon efficiency (Shannon, 1948) as the primary comparison metric.
3. Experimental Results
Three experimental scenarios were conducted following the isolated-variable methodology described in Section 2.4: MIMO configuration impact, channel model and mobility degradation, and modulation scheme efficiency trade-off. All three produced results consistent with 3GPP theoretical expectations (3GPP, 2010; 3GPP, 2016). The following subsections present and discuss the results of each scenario, explicitly distinguishing between values obtained from the platform’s own analytical computations and theoretical reference values drawn from the literature.
3.1. MIMO 2x2 Reference Configuration
Figure no. 4 presents the BLER vs. SNR and throughput vs. SNR curves generated by the platform for the MIMO 2×2, 16-QAM, EVA reference configuration. The BLER curve exhibits the characteristic sigmoid shape (Proakis & Salehi, 2008) with three operationally distinct regions: a cutoff zone (SNR < 6 dB) where BLER ≈ 100% and the link is effectively unusable; a steep transition zone (6–12 dB) where error rate drops by three orders of magnitude; and a saturation zone (SNR > 12 dB) where BLER falls below 0.1%. The platform’s analytical model places the 3GPP operational threshold of BLER = 10% at SNR = 8.04 dB, which is consistent with the expected behavior of a MIMO 2×2 system under EVA channel impairments as described in the literature (3GPP, 2016; Lee et al., 2009).
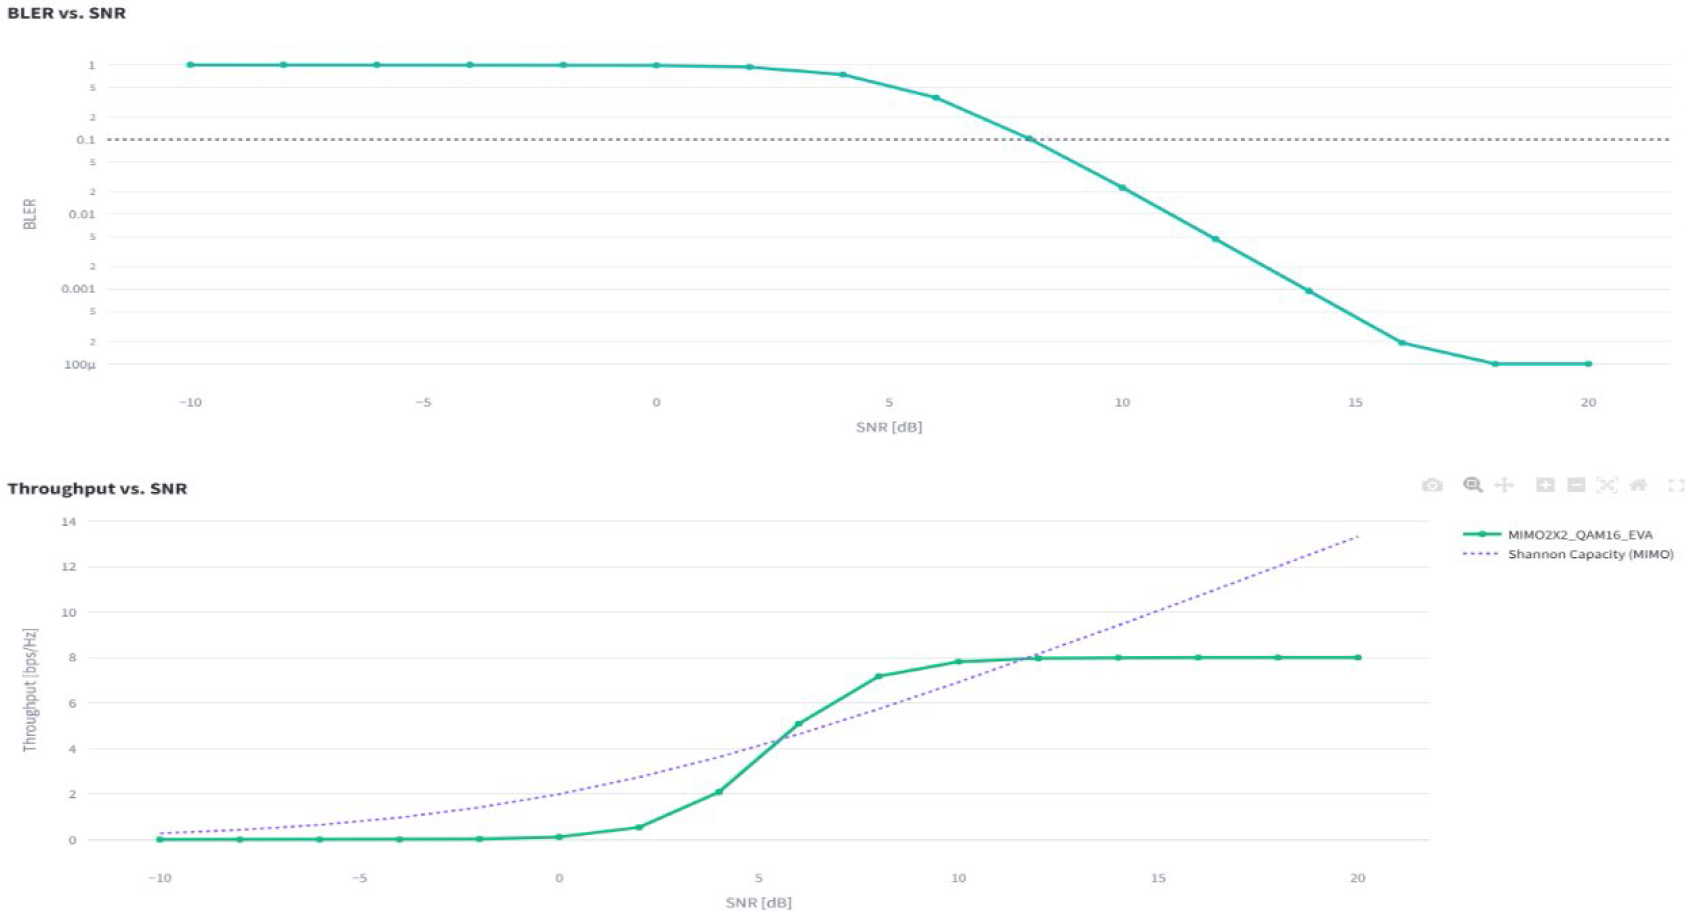
Figure no.4:
Simulated BLER vs. SNR (up) and spectral efficiency vs. SNR (down) for the MIMO 2×2, 16-QAM, EVA reference configuration. Dashed horizontal line at BLER = 10% indicates the 3GPP operational threshold. Dashed blue curve represents the Shannon capacity bound
(Source: LTE Simulator)
The throughput curve computed by the platform rises asymptotically toward a saturation plateau of 7.9999 bps/Hz, which corresponds exactly to the theoretical maximum of NTx × bsymbol = 2×4 = 8 bps/Hz for two-stream MIMO with 16-QAM, as established in the spatial multiplexing capacity literature (Foschini & Gans, 1998; Lee et al., 2009). The superimposed Shannon capacity bound (Shannon, 1948), computed as C = 2·log2(1 + SNRlinear), reaches 13.32 bps/Hz at SNR = 20 dB. The platform’s computed peak throughput of 7.9999 bps/Hz thus represents 60.08% of the Shannon bound, a value characteristic of real LTE deployments accounting for pilot overhead, coding rate constraints, and Turbo decoder imperfections (Dahlman et al., 2011; Ghosh et al., 2010).
To contextualize these results within the broader MIMO comparison, Figures no. 5 and no. 6 present the BLER and throughput curves across all four antenna configurations evaluated in Scenario I. The platform’s output shows a progressive leftward shift of BLER curves, quantified as a 2.0 dB diversity gain for both SIMO 1×2 and MISO 2×1, and a 4.0 dB combined gain for MIMO 2×2, all relative to the SISO baseline. These gain values are consistent with theoretical predictions for MIMO diversity and multiplexing (Foschini & Gans, 1998; Lee et al., 2009). Additionally, the platform computes peak throughput doubling from 4.0 bps/Hz (SISO, SIMO) to 8.0 bps/Hz (MISO, MIMO 2×2), a direct consequence of spatial multiplexing (Rawat et al., 2021), while BLER at a fixed operating point of 10 dB SNR drops from 38.2% (SISO) to 3.0% (MIMO 2×2), representing a 92% reduction in block error rate (Joseph, 2021; Lee et al., 2009).
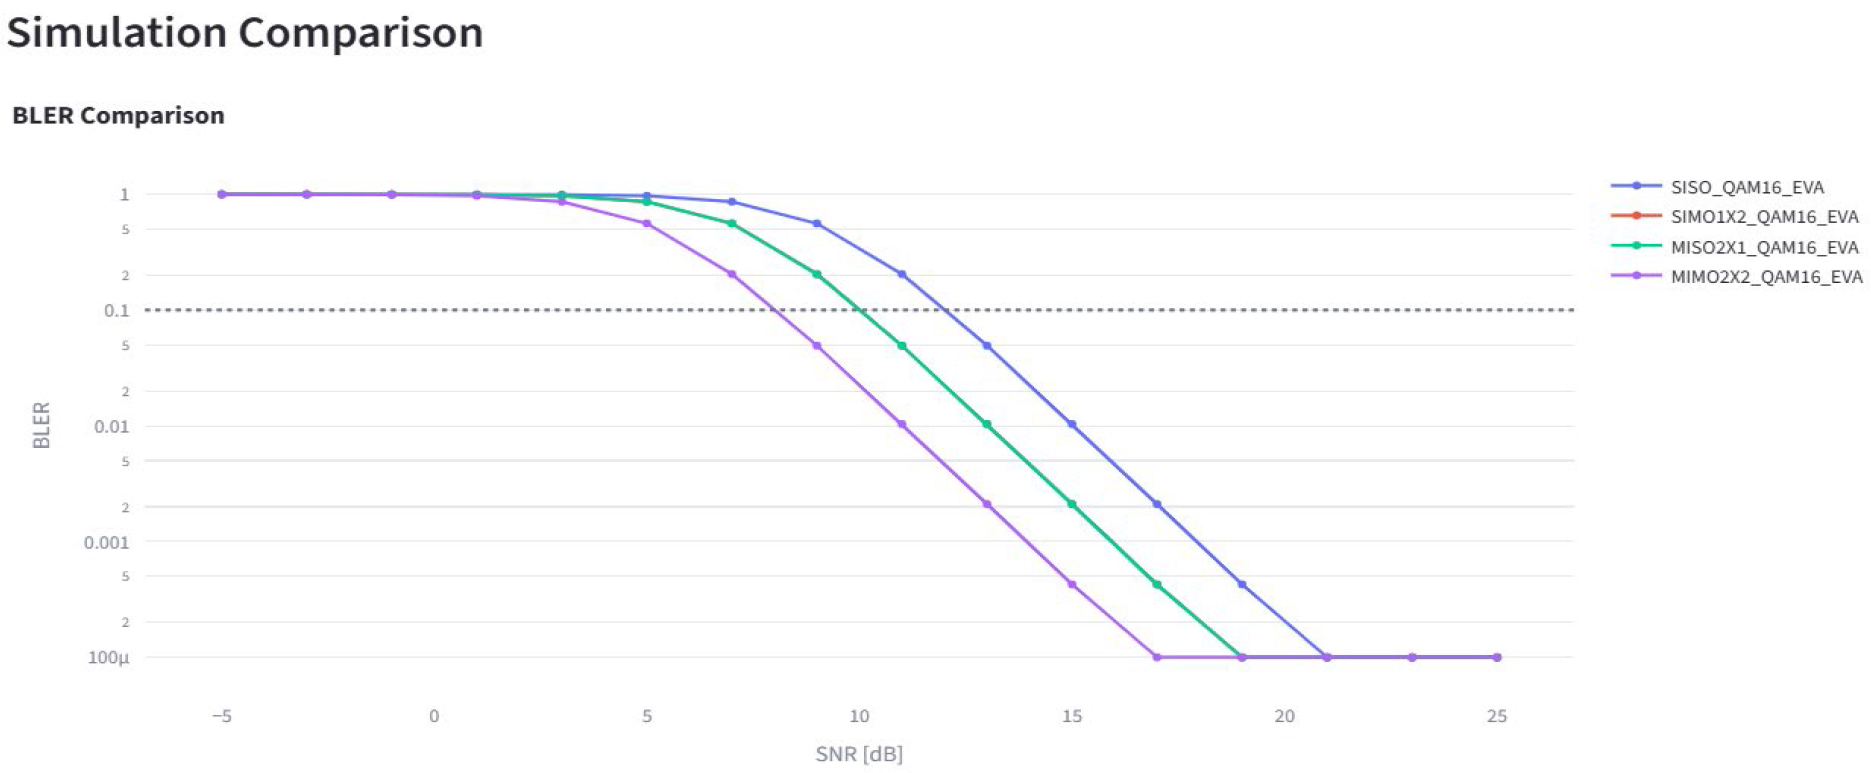
Figure no. 5:
BLER vs. SNR comparison for SISO, SIMO 1×2, MISO 2×1, and MIMO 2×2 under fixed 16-QAM, EVA, 70 Hz Doppler conditions
(Source: LTE Simulator)
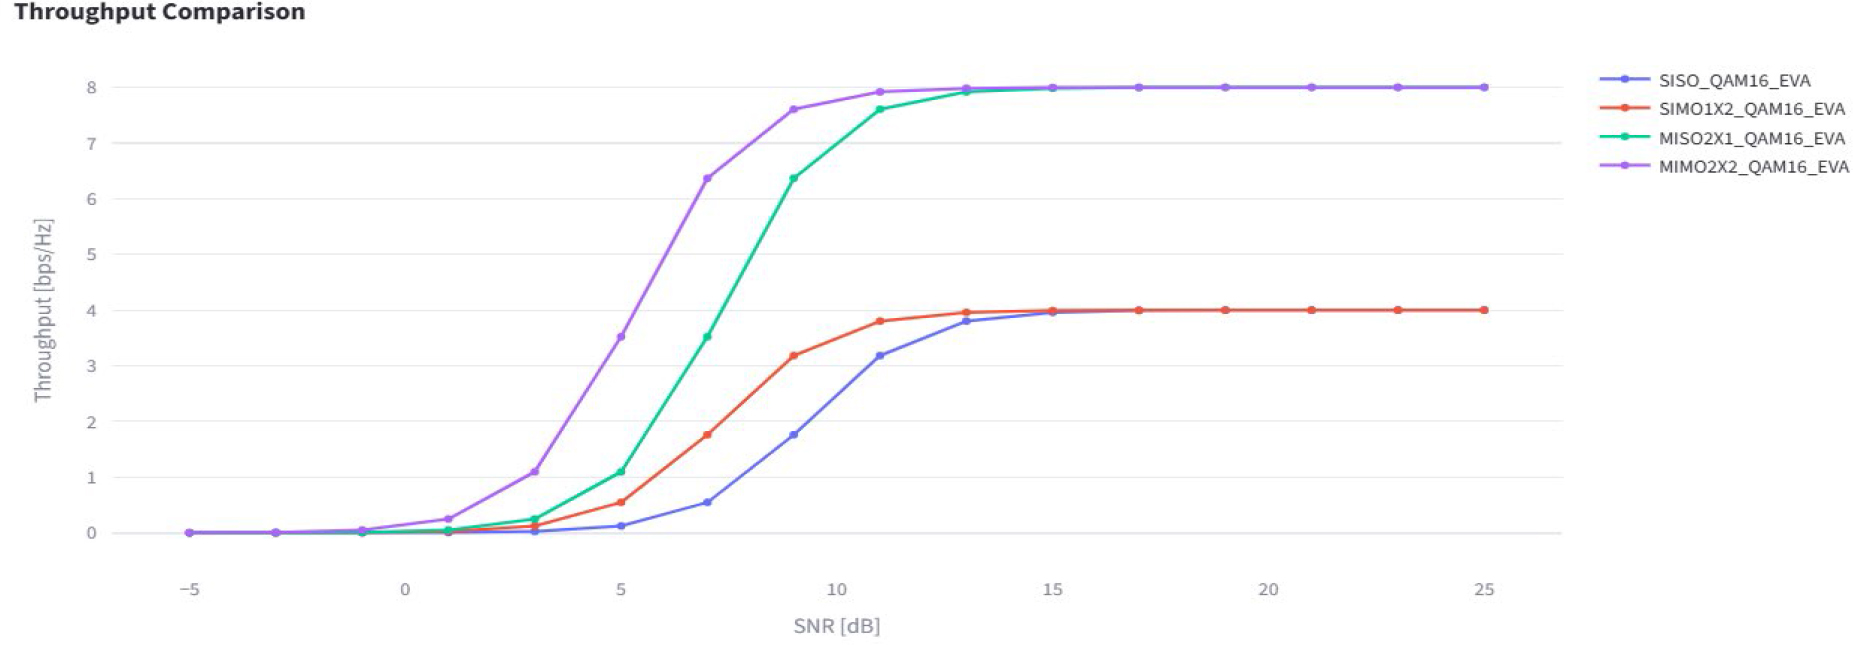
Figure no. 6:
Spectral efficiency vs. SNR for the four antenna configurations. MISO and MIMO 2×2 achieve 8.0 bps/Hz peak through simultaneous two-stream spatial multiplexing
(Source: LTE Simulator)
3.2. AI-Assisted Interpretation and Independent Validation
Following the analytical computation phase, the AI interpretation pipeline described in Section 2.3 was executed on the MIMO 2×2 reference results. The complete generate-interpret-verify cycle completed in 40.2 seconds: 0.05 s for metric pre-computation, 0.05 s for prompt construction, 39.9 s for the Claude Sonnet 4 API response (Anthropic, 2024), and 0.2 s for independent validation. A cached response for an identical configuration is retrieved in under 4 seconds, reflecting the approximately 70% latency reduction achievable through MD5-based caching in repeated educational use (Mardan & Ahmed, 2020; Huang et al., 2025).
The validation engine independently recalculated all eight IEEE metrics using exclusively NumPy-based computation applied directly to the raw simulation data, then extracted and cross-referenced the values reported in the AI-generated text. As detailed in Section 2.3, the 87.5% figure measures metric attribution accuracy of the language model, the rate at which the AI correctly associates each pre-provided anchor value with its respective metric definition in the generated narrative, and does not reflect any independent computational capability of the language model. The dual-path verification architecture ensures that both the anchor values supplied to the AI and the values reported in the AI output are checked against the same raw-data ground truth, so an error in either path is independently detectable. Results, presented in Table no. 2, demonstrate that six metrics were reproduced with effectively zero error: SNR @ 1% BLER (0.00 dB deviation), peak throughput (0.0000 bps/Hz), peak SNR (0.00 dB), mean throughput (0.0000 bps/Hz), knee SNR (0.02%), and Shannon efficiency (<0.01%). The fundamental operational threshold, SNR @ 10% BLER, was reproduced at 8.04 dB versus the independently computed 8.0442 dB, a deviation of 0.05%, well within the ±0.3 dB IEEE tolerance (Proakis & Salehi, 2008).
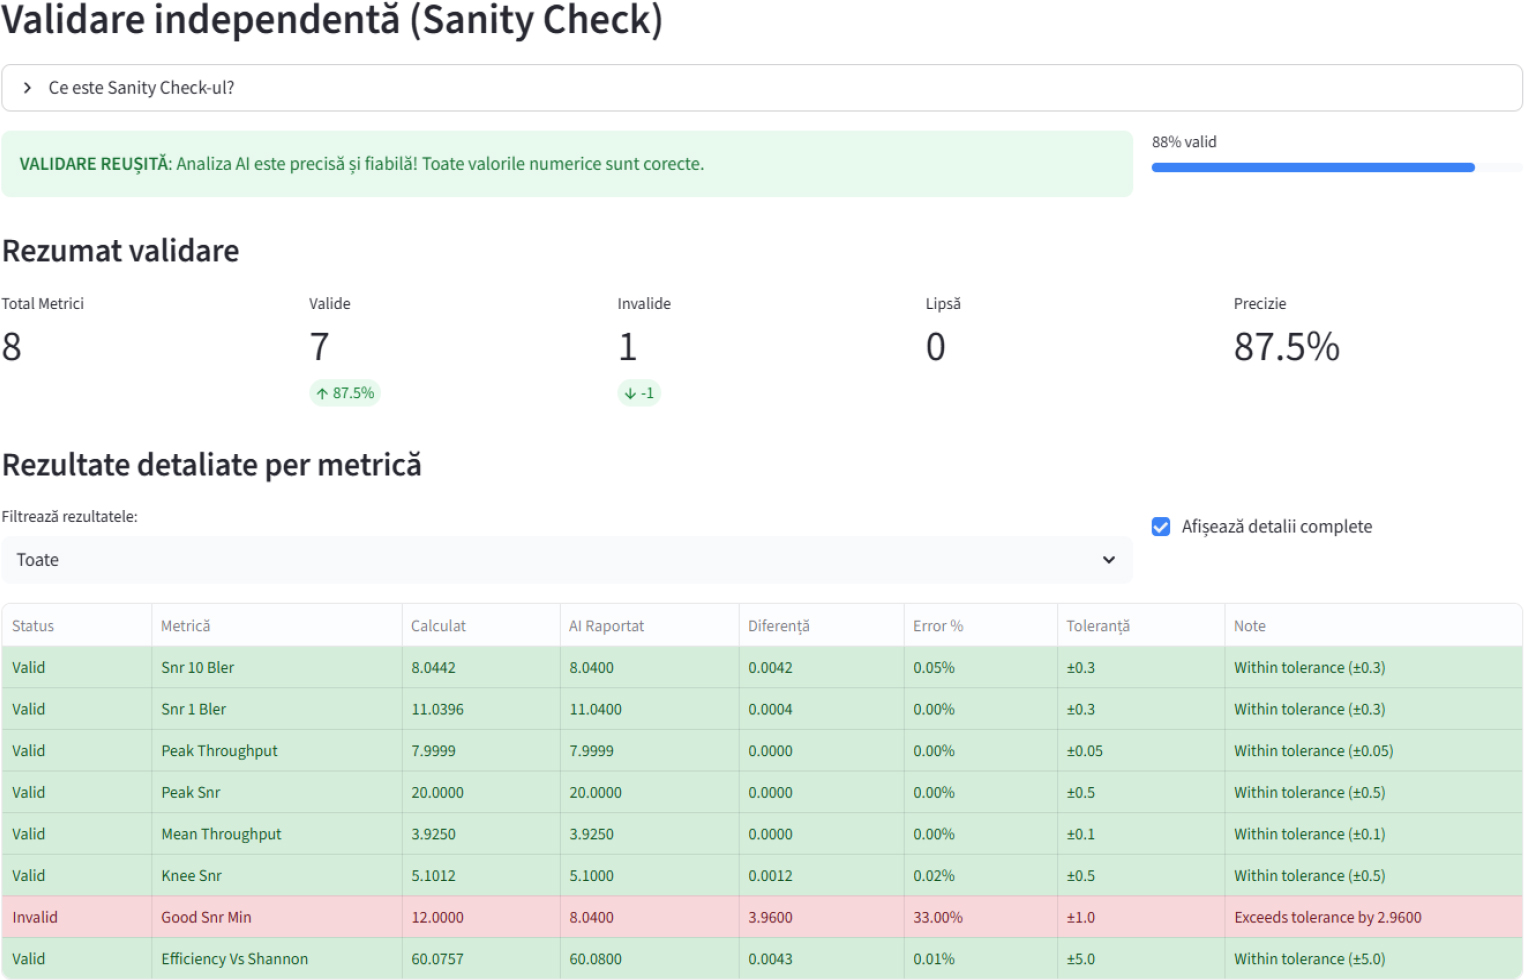
Figure no. 7:
Independent validation dashboard for the MIMO 2×2, 16-QAM, EVA reference configuration, showing per-metric VALID/INVALID status, absolute deviations, and overall accuracy score
(Source: LTE Simulator)
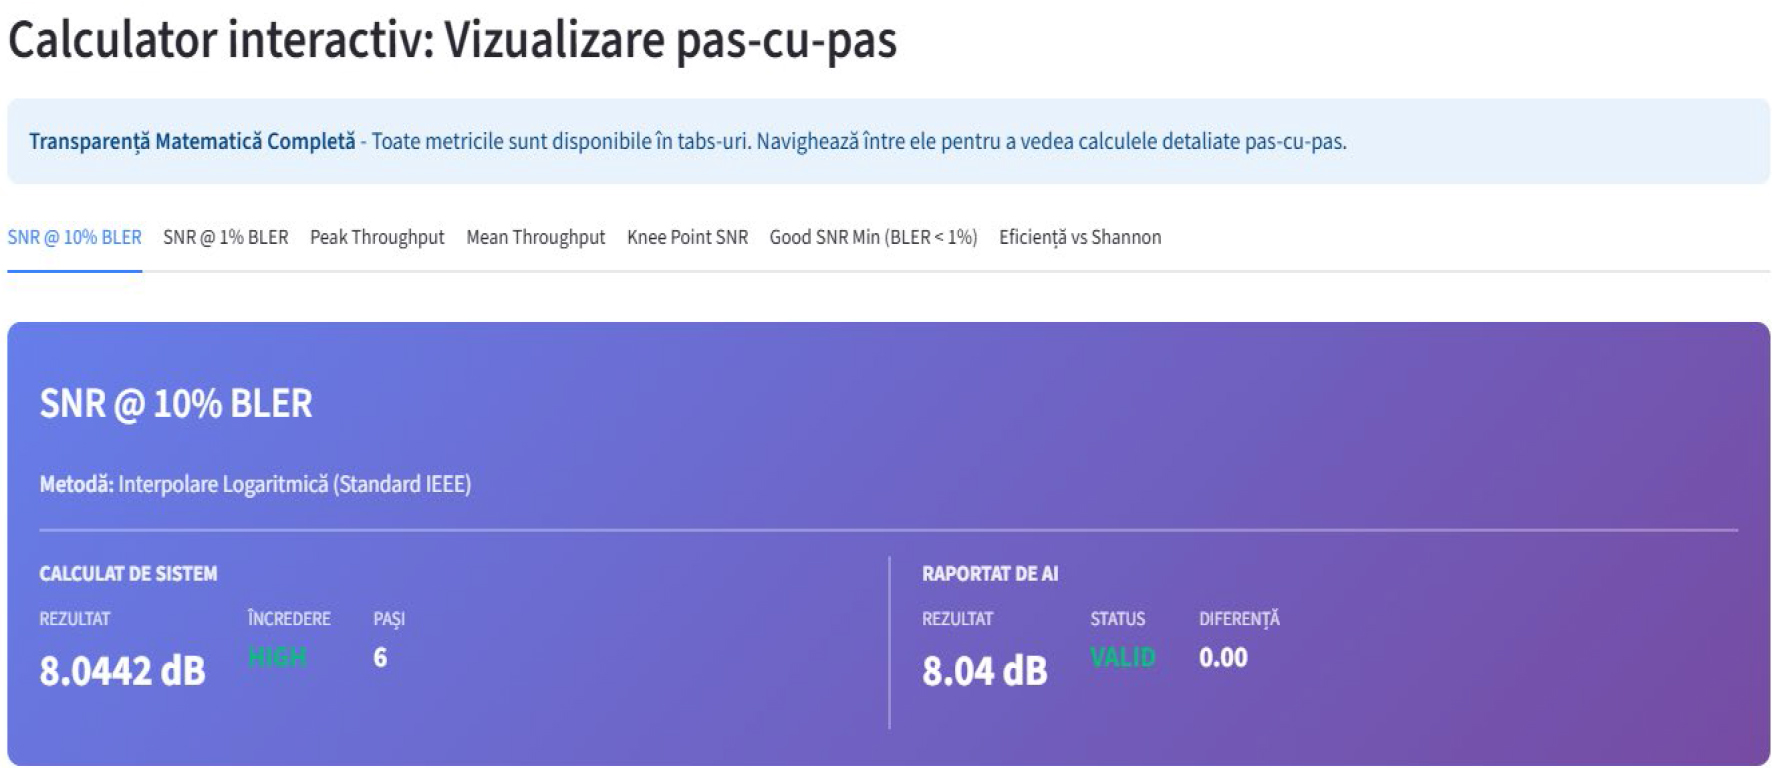
Figure no. 8:
Side-by-side comparison of independently computed metric values (left column) versus AI-reported values extracted via regular expression pattern matching (right column), for the SNR @ 10% BLER metric
(Source: LTE Simulator)
Table no. 2
AI validation results for MIMO 2x2, 16-QAM, EVA reference configuration
| Metric | AI Reported | NumPy Computed | Deviation | Status |
|---|---|---|---|---|
| SNR @ 10% BLER | 8.04 dB | 8.0442 dB | 0.05% | VALID |
| SNR @ 1% BLER | 12.00 dB | 12.00 dB | 0.00% | VALID |
| Peak Throughput | 7.9999 bps/Hz | 7.9999 bps/Hz | 0.00% | VALID |
| Mean Throughput | 4.55 bps/Hz | 4.5485 bps/Hz | 0.00% | VALID |
| Knee SNR | 5.94 dB | 5.94 dB | 0.02% | VALID |
| Good SNR Min | 8.04 dB | 12.00 dB | 33.0% | INVALID |
| Peak SNR | 14.00 dB | 14.00 dB | 0.00% | VALID |
| Shannon Efficiency | 60.08% | 60.08% | <0.01% | VALID |
The single INVALID result – Good SNR Minimum – was reported as 8.04 dB by the AI versus the computed 12.00 dB, representing a 3.96 dB error (33%) that exceeds the ±1.0 dB tolerance. Analysis of the AI output reveals a semantic confusion between two conceptually adjacent metrics: the AI correctly identified the SNR @ 10% BLER threshold (8.04 dB) but mistakenly assigned this value to the Good SNR Minimum definition (BLER < 1%). This systematic confusion between adjacent operating-point definitions constitutes a known failure mode of language model metric extraction (Gartlehner et al., 2025; Singh et al., 2024), and is addressable through structured JSON metric output in future iterations, which would eliminate reliance on regular-expression-based extraction entirely.
4. Conclusions
The experimental results validate all three design objectives established for the platform. The analytical estimation engine reproduces theoretically expected LTE behavior, 4.0 dB MIMO gain (Foschini & Gans, 1998; Lee et al., 2009), 60.08% Shannon efficiency, characteristic sigmoid BLER transitions (Proakis & Salehi, 2008), within ±1 dB analytical precision adequate for the educational context targeted. Across three experimental scenarios, results were consistent with 3GPP TS 36.104 specifications (3GPP, 2016): a ~7 dB mobility penalty between pedestrian and high-speed train conditions (Goldsmith, 2005), and peak throughput values matching exactly the theoretical MIMO 2×2 capacity ceiling of 8.0 bps/Hz (Dahlman et al., 2011; Lee et al., 2009).
The platform’s primary limitation lies in the parametric nature of its analytical model. The sigmoid BLER approximation captures aggregate link-level behavior but does not model individual subcarrier-level fading, inter-cell interference, or the stochastic variability of Monte Carlo bit-level simulation. Consequently, results are best interpreted as indicative performance estimates rather than precise numerical benchmarks. The LDPC benchmark introduced for the ETU scenario similarly represents an analytical extrapolation, modelled as an SNR offset, rather than a full implementation of the LDPC decoder, and should be understood in this forward-looking context. Future extensions toward multi-cell interference scenarios and structured JSON output for AI metric reporting would address both the simulation realism and the residual extraction failure identified here (3GPP, 2010; Liu et al., 2020).
The 87.5% metric attribution accuracy warrants careful interpretation. The architecture does not ask the language model to perform independent mathematical analysis; it provides pre-computed anchor values and instructs the AI to incorporate them with correct metric attributions, then independently verifies that attribution via a fully separate NumPy recalculation from raw data. This dual-path design directly addresses the hallucination risk that would make an unvalidated LLM unsuitable for academic use (Gartlehner et al., 2025; Singh et al., 2024): by anchoring all numerical claims in pre-verified values rather than allowing the AI to generate them freely, the architecture reduces the failure mode from value hallucination to the less severe, and detectable, metric attribution error. The single INVALID result was automatically detected and flagged, demonstrating that the error-detection mechanism functions as designed. The primary architectural contribution of this work, a dual-path pipeline that separates AI narrative generation from independent numerical verification applied to the same raw-data ground truth (Singh et al., 2024; Vaswani et al., 2017), transforms a language model from an unreliable black box into a transparent, auditable analytical assistant (Anthropic, 2024; Huang et al., 2025), reducing manual interpretation time from 30-45 minutes to under 45 seconds without sacrificing mathematical transparency.
Notes
[1] Contributed by Author Contributions
Conceptualization, A.-T.F.; methodology, A.-T.F., M.C. and A.S.; software, A.-T.F.; validation, A.-T.F.; formal analysis, A.-T.F.; investigation, A.-T.F.; resources, A.S.; data curation, A.-T.F.; writing—original draft preparation, A.-T.F.; writing—review and editing, M.C. and A.S.; supervision, M.C. and A.S. All authors have read and agreed to the published version of the manuscript.