
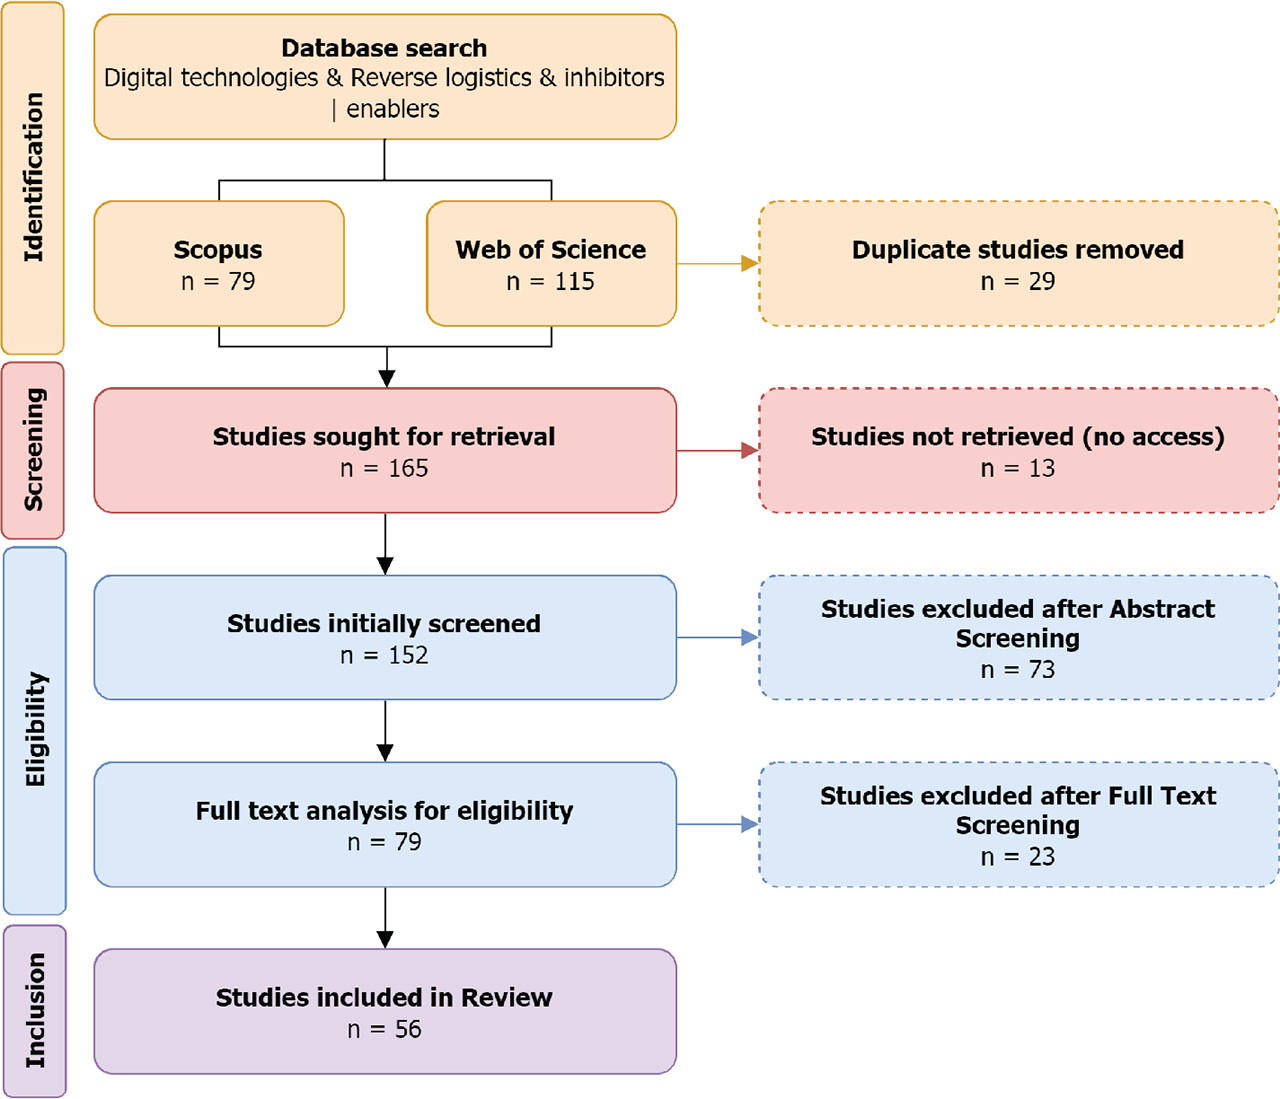
Figure 1.
Flowchart of the systematic literature review based on the PRISMA method (adapted from Page et al., 2021)
Abbildung 1. Ablaufschema der systematischen Literaturrecherche nach der PRISMA-Methode (angepasst nach Page et al., 2021)
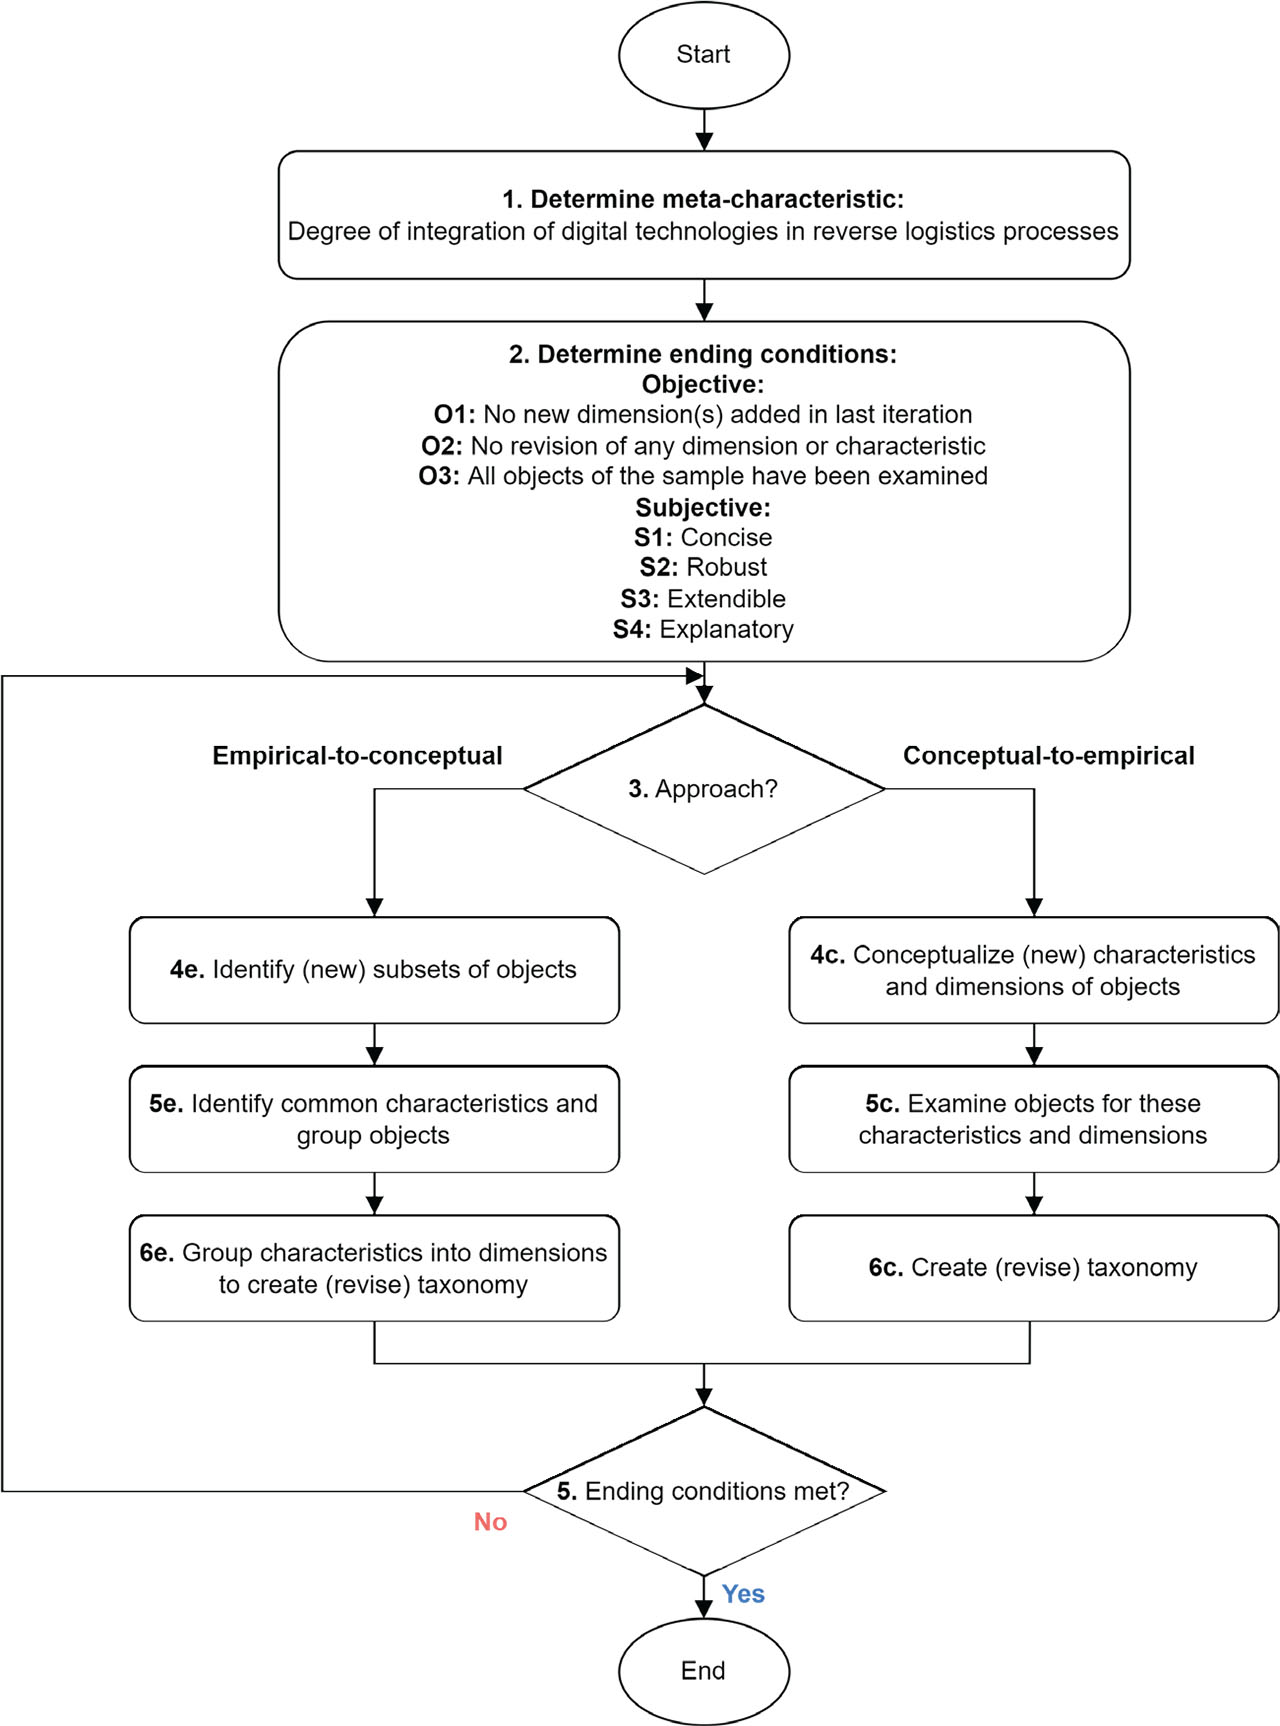
Figure 2.
Methodological approach for the iterative development of the taxonomy (adapted from Nickerson et al., 2013)
Abbildung 2. Abbildung 2. Methodischer Ansatz für die iterative Entwicklung der Taxonomie (angepasst nach Nickerson et al., 2013)
Table 1.
Definition of the Search String grouped by topics
Tabelle 1. Definition der Suchbegriffe, gruppiert nach Themen
| Topic | Keywords |
|---|---|
| Reverse Logistics | (Reverse Logistic* AND (“Circular*” OR “Sustainab*”)) |
| Digital Technologies | (Digital* OR Digital transformation OR Industry 4.0 OR „Innovation“ OR „Cyber Physical system“ OR „Cybersecurity“ OR „CYB“ OR „Data sovereignty“ OR „Artificial Intelligence“ OR „AI“ OR „Augmented Reality“ OR „Virtual reality“ OR „Machine learning“ OR „Deep learning“ OR „Reinforcement Learning“ OR „Federated Learning“ OR „Data analytics“ OR „Big data analytics“ OR „BDA“ OR „Cloud“ OR „Fog“ OR „Edge“ OR „Data spaces“ OR „Data hubs“ OR „Internet of things“ OR „IOT“ OR „Sensor*“ OR „Scan*“ OR „Traceability“ OR „Industrial Internet“ OR „Blockchain“ OR „Blockchain technology“ OR „Information Technolog*“ OR „ICT“ OR „Computer Vision“) |
| Success Factors and Barriers | („Success Factor*“ OR Enabl* OR Facilitat* OR driv* OR Barrier*) |
Table 2.
Coding Categories Used for Qualitative Content Analysis of the Literature
Tabelle 2. Kodierungskategorien für die qualitative Inhaltsanalyse der Literatur
| Category | Description |
|---|---|
| Research Question and Objective | Main research aim and questions addressed in the study. |
| Methodology | Type of research method applied (e.g., case study, survey, conceptual paper). |
| Data Type/Source | Type of data used to generate results (e.g., primary, secondary, or mixed sources). |
| Type of Study Output | Nature of the contribution (e.g., empirical findings, conceptual framework, literature review). |
| Analyzed Nation/Region | Geographical context or focus of the study or data. |
| Industry Focus | Sector or industry context explored (e.g., electronics, automotive, retail). |
| Operational Focus | Cross-industry processes or functions explored (e.g., supply chain management, logistics, waste disposal). |
| Analyzed technology | Specific digital or technical solutions examined in the study. |
| Analyzed Industry 4.0 Technologies | Which of the nine Industry 4.0 technologies are analyzed in the study (e.g., Internet of Things, Cyber-Physical Systems). |
| Definition of Reverse logistics | Whether and how reverse logistics is defined or conceptualized in the study. |
| Analyzed Life Cycle Stage(s) | Product life cycle stage(s) considered in the study (e.g., design, use phase, end-of-life). |
| Stakeholder Perspective | Stakeholder group(s) that the study focuses on (e.g., consumers, manufacturers, policymakers). |
| Circular Economy Orientation | Whether reverse logistics is examined as part of a broader circular economy framework. |
| Analyzed R-Strategies | Which of the ten R-strategies (e.g., Reduce, Reuse, Recycle) are analyzed in the study. |
| Identified Critical Success Factors or Drivers | Critical success factors or drivers explicitly derived from empirical findings or author synthesis. |
| Cited Critical Success Factors or Drivers | Critical success factors or drivers referenced from previous literature without original empirical validation. |
| Identified Barriers | Barriers explicitly derived from empirical findings or author synthesis. |
| Cited Barriers | Barriers referenced from previous literature without original empirical validation. |
| Limitations | Limitations acknowledged by the authors regarding their study. |
| Identified Gaps | Research gaps or future research directions proposed by the study. |
Table 3.
Yearly distribution of reviewed studies
Tabelle 3. Zeitliche Verteilung untersuchten Studien
| Year | Number of studies |
|---|---|
| 2006–2010 | 3 |
| 2011–2015 | 1 |
| 2016–2020 | 16 |
| Since 2021 | 36 |
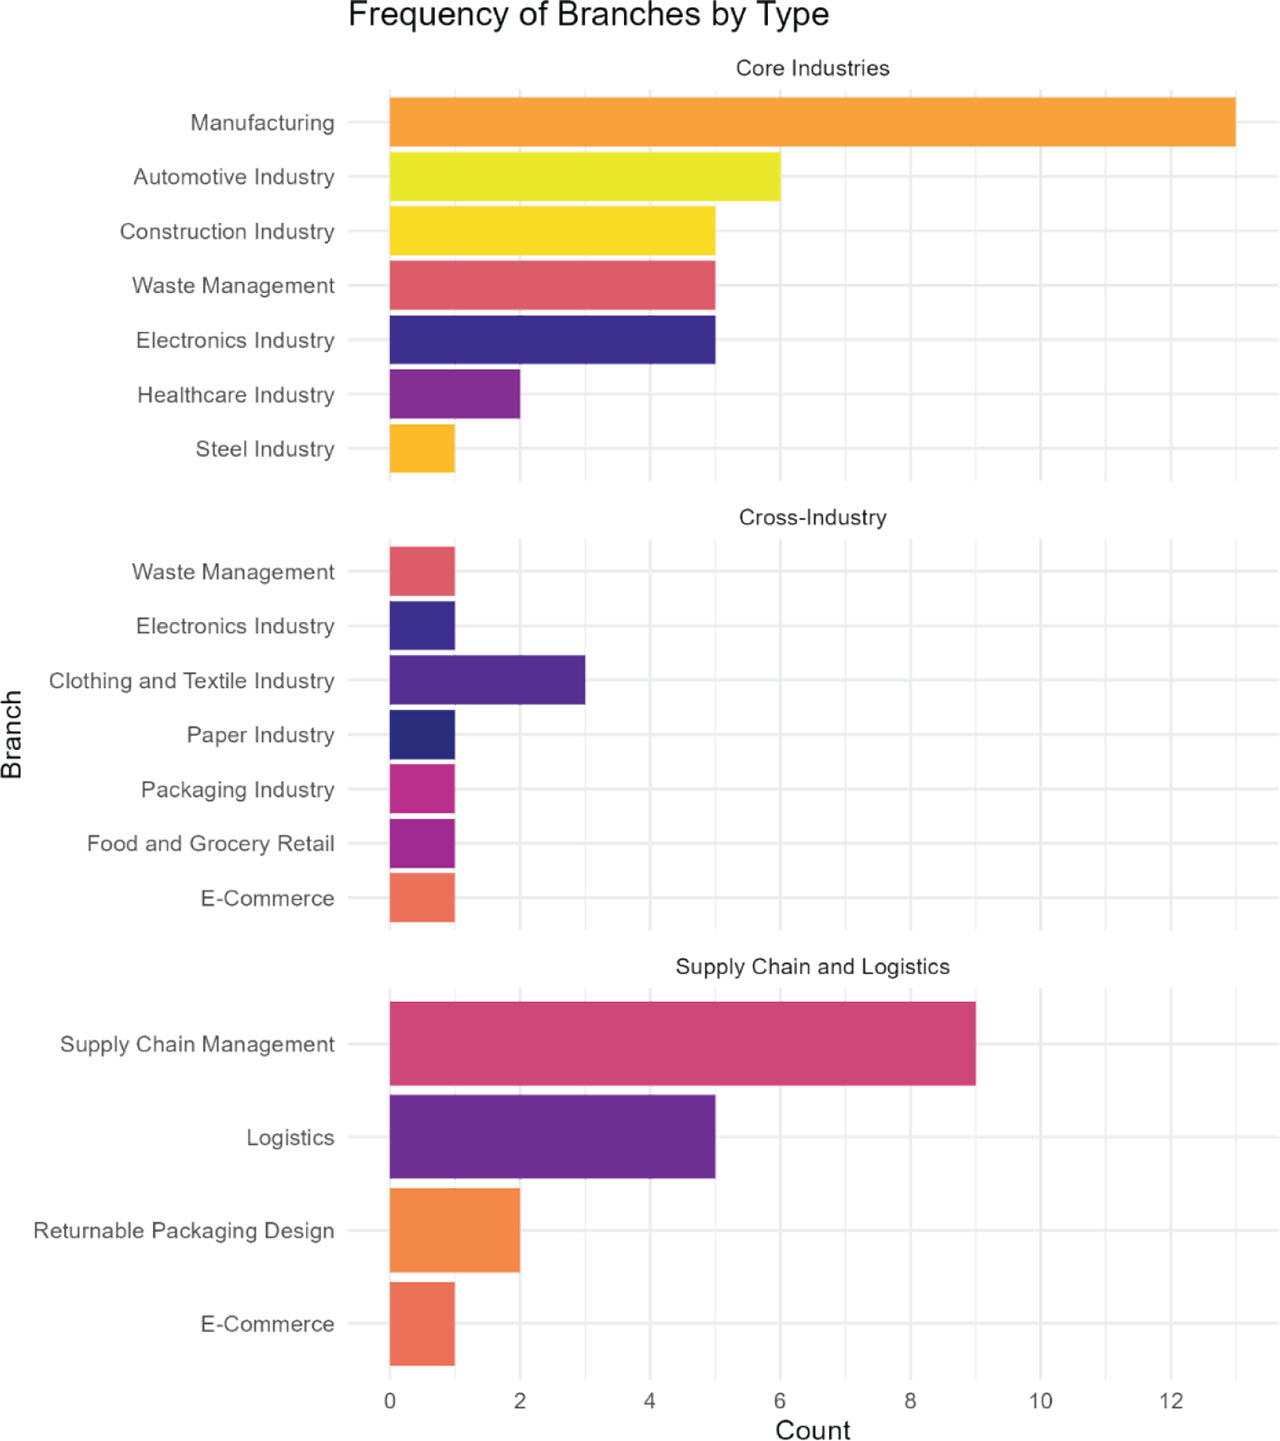
Figure 4.
Frequency of analyzed sectoral and functional focus by type (own illustration)
Abbildung 4. Häufigkeit der analysierten sektoralen und funktionalen Schwerpunkte (eigene Darstellung)
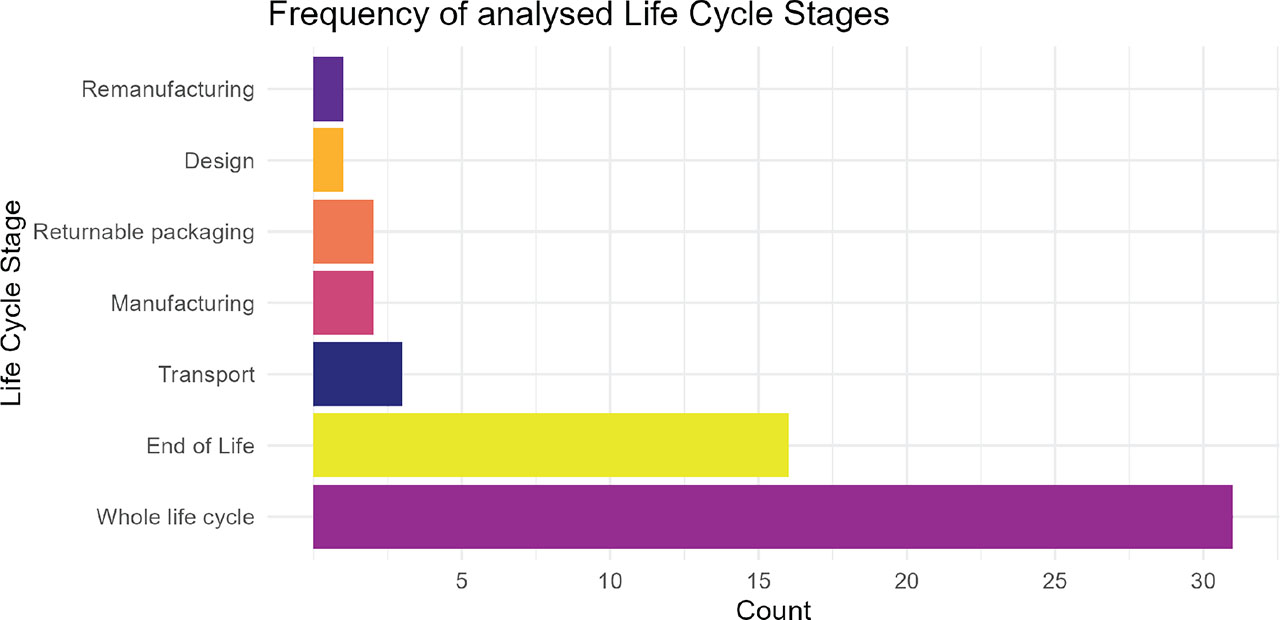
Figure 5.
Frequency of analyzed life cycle stages (own illustration)
Abbildung 5. Häufigkeit der analysierten Lebenszyklusphasen (eigene Darstellung)
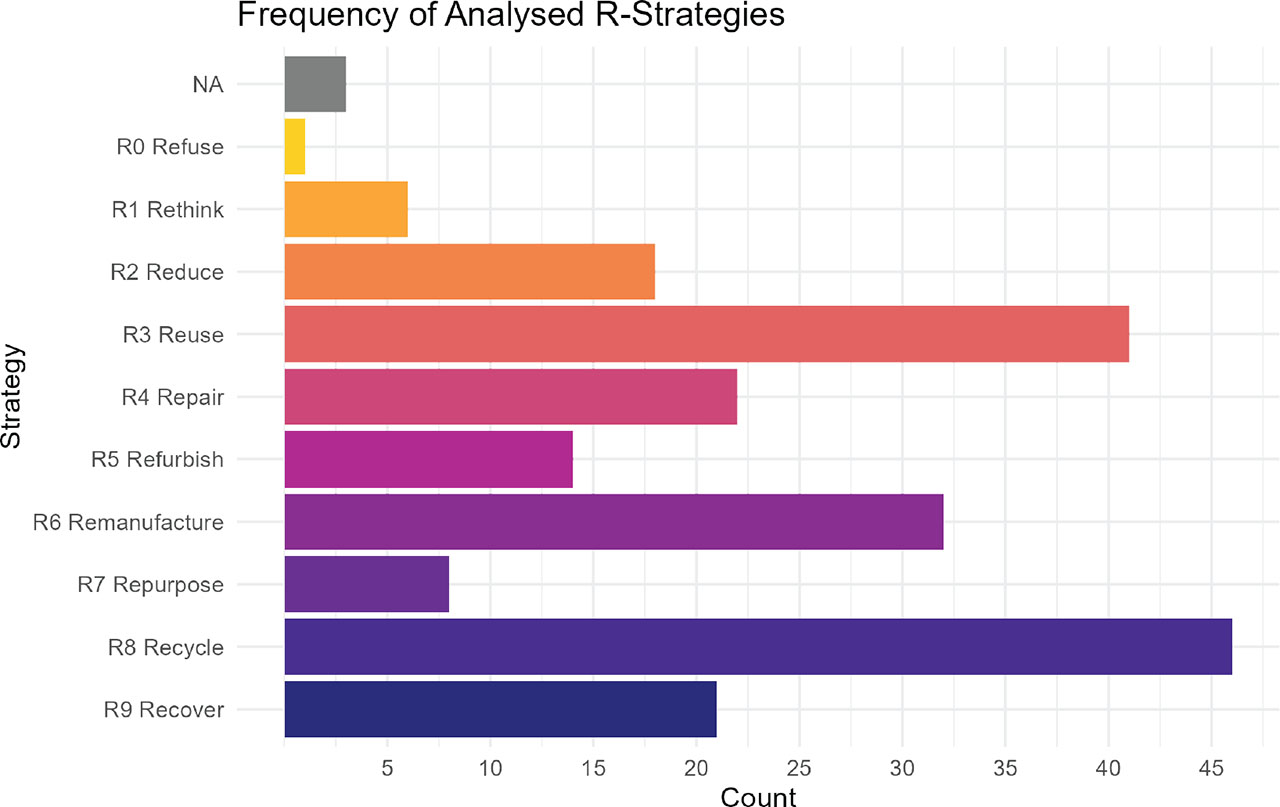
Figure 6.
Frequency of analyzed R-strategies (own illustration)
Abbildung 6. Häufigkeit der analysierten R-Strategien (eigene Darstellung)
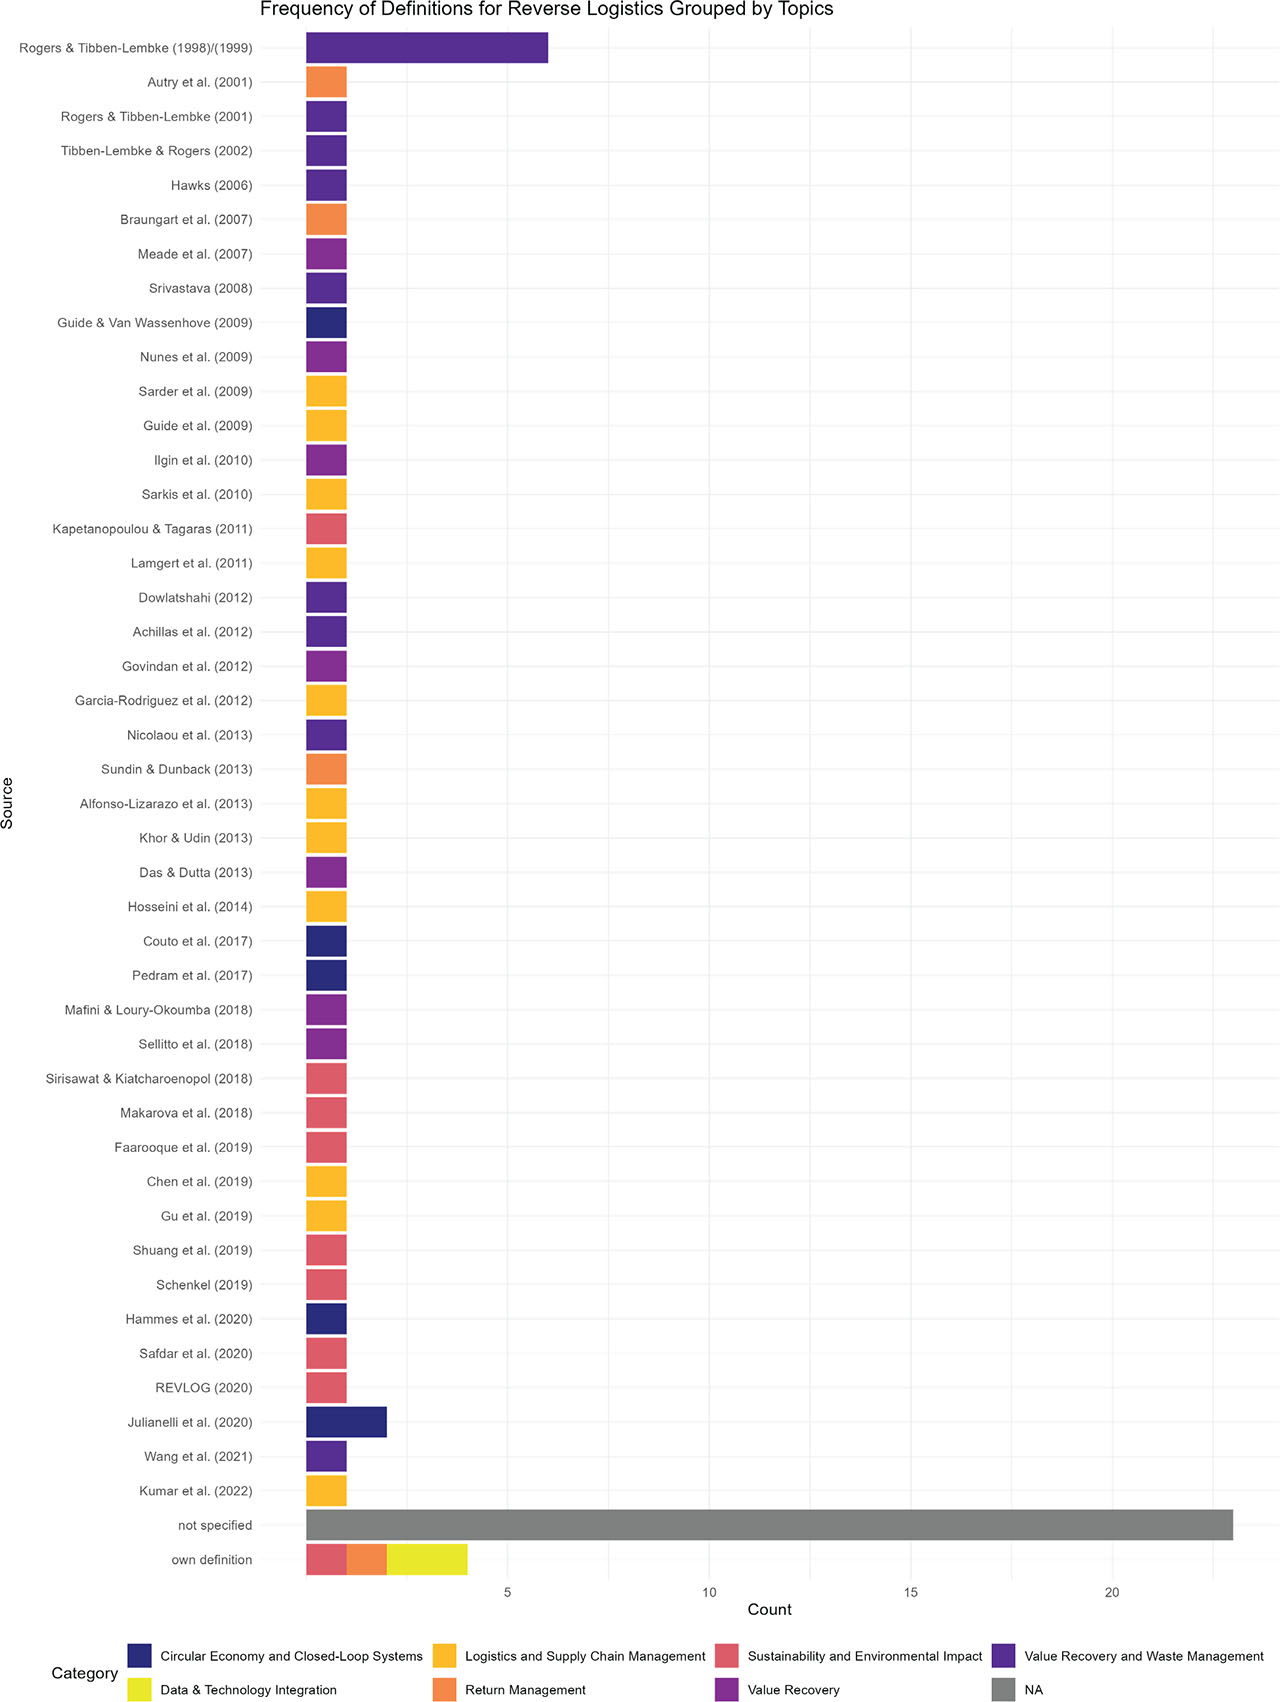
Figure 7.
Frequency of definitions for RL grouped by topics in chronological order (own illustration)
Abbildung 7. Häufigkeit der Definitionen von RL gruppiert nach Themen in chronologischer Reihenfolge (eigene Darstellung)
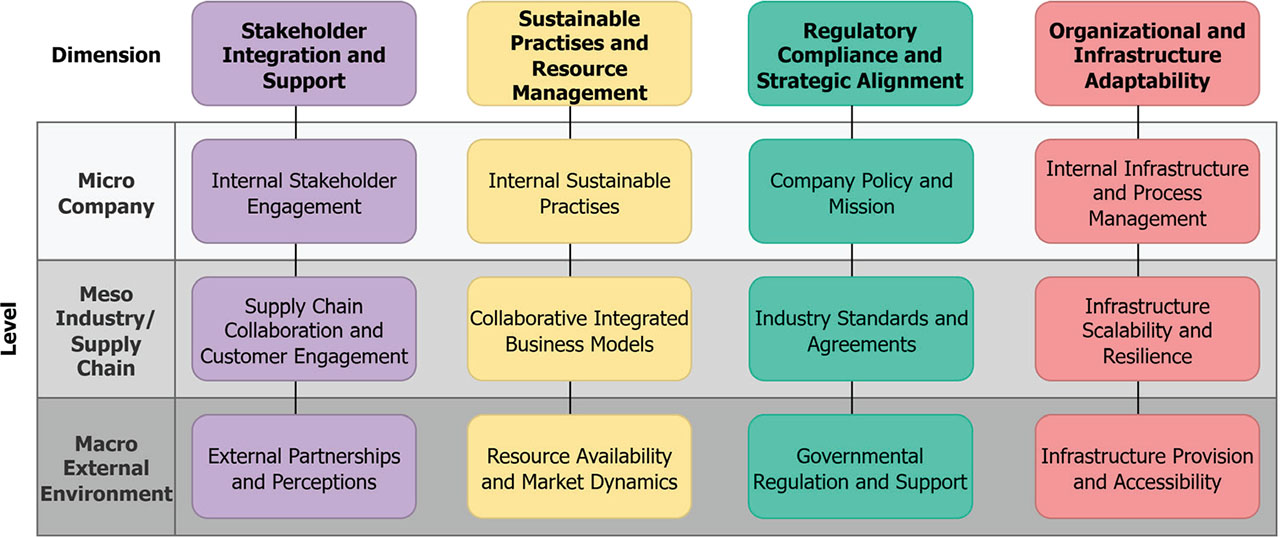
Figure 8.
Developed taxonomy of critical success factors for the implementation of digitally enabled reverse logistics (own illustration)
Abbildung 8. Entwickelte Taxonomie kritischer Erfolgsfaktoren für die Umsetzung einer digital gestützten Rücknahmelogistik (eigene Darstellung)
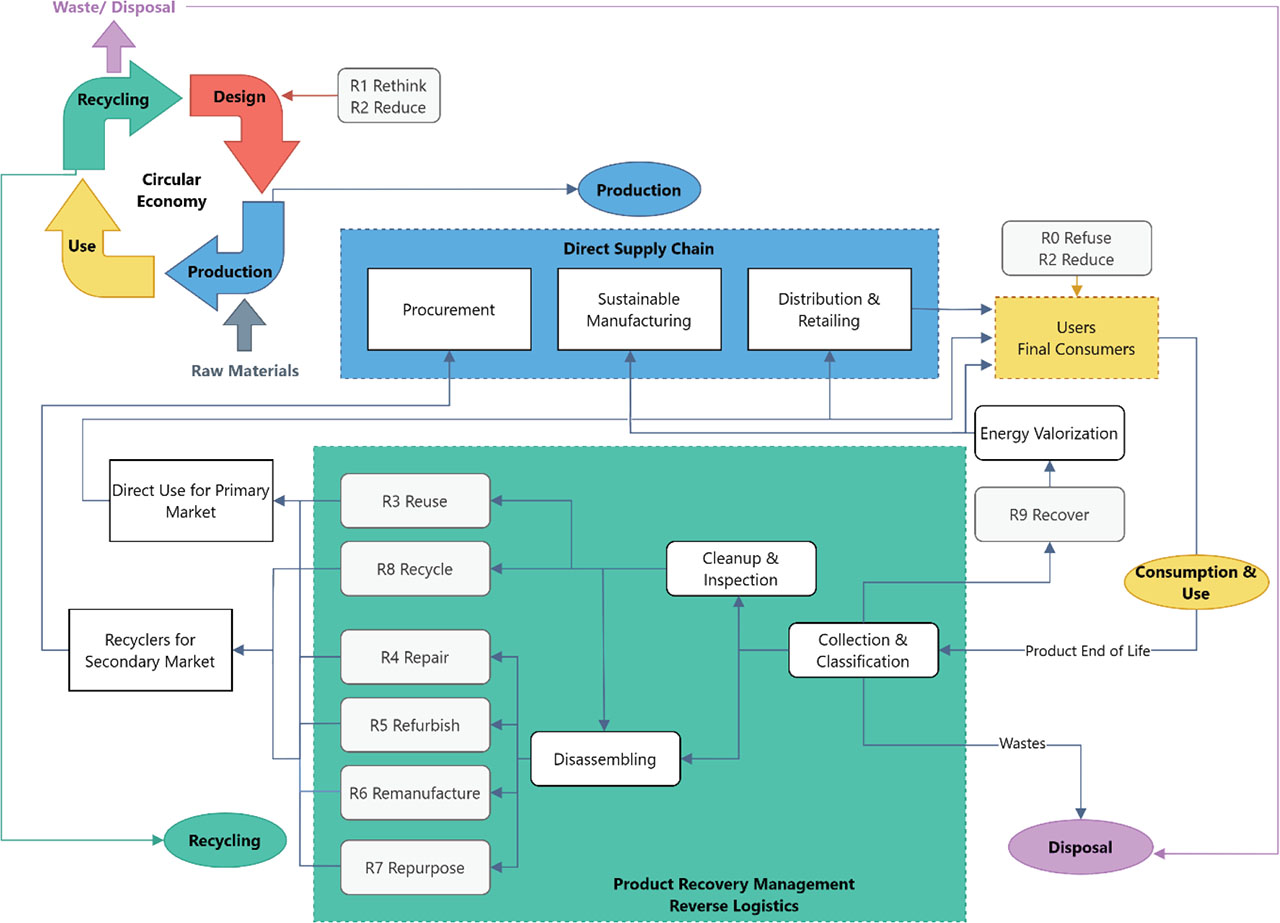
Figure 9.
Interaction between circular economy, reverse logistics, and supply chain management (adapted from Ciliberto et al., 2021, and expanded with the R-strategies according to Potting et al., 2016)
Abbildung 9. Wechselwirkungen zwischen Kreislaufwirtschaft, Rücknahmelogistik und Lieferkettenmanagement (angelehnt an Ciliberto et al., 2021 und erweitert um die R-Strategien nach Potting et al., 2016)
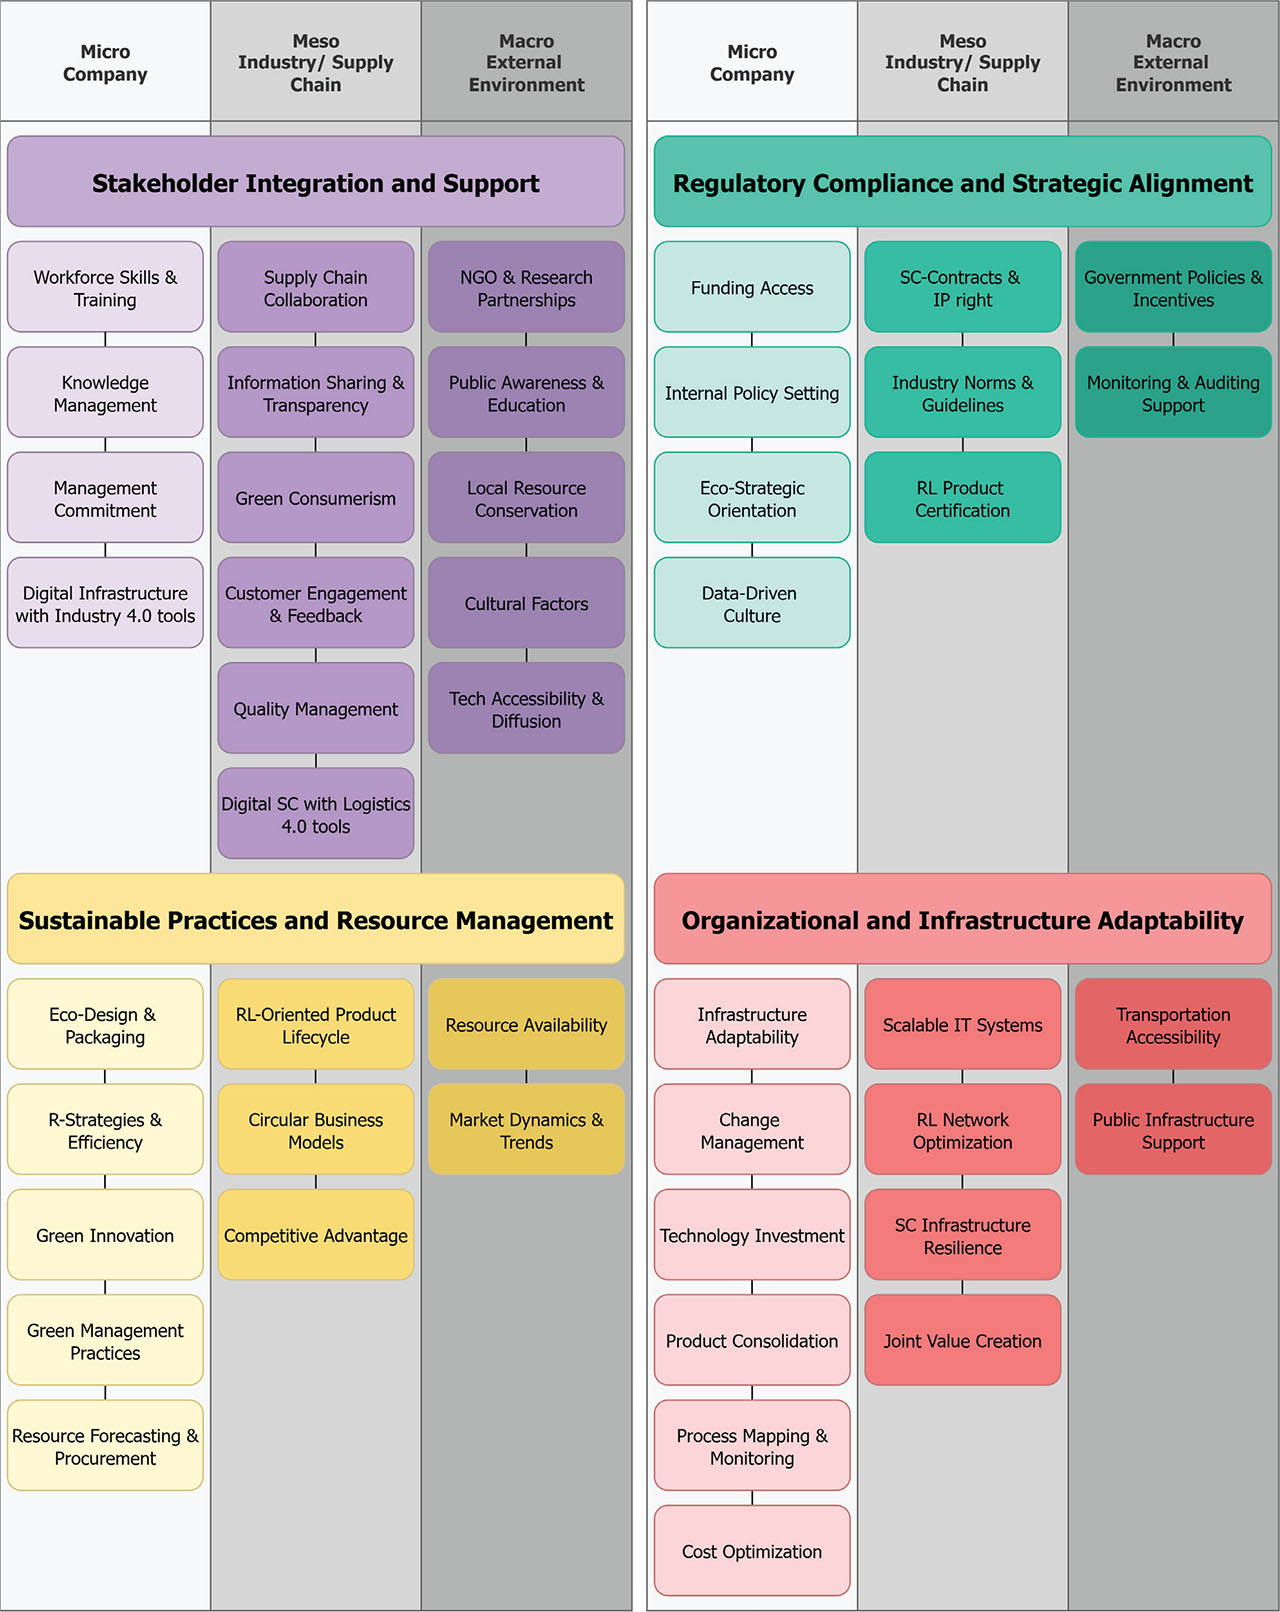
Figure 10.
Detailed taxonomy of critical success factors for the implementation of digitally enabled reverse logistics, including all dimensions and characteristics (own illustration)
Abbildung 10. Detaillierte Taxonomie kritischer Erfolgsfaktoren für die Umsetzung der digital gestützten Rücknahmelogistik mit allen Dimensionen und Charakteristiken (eigene Darstellung)