
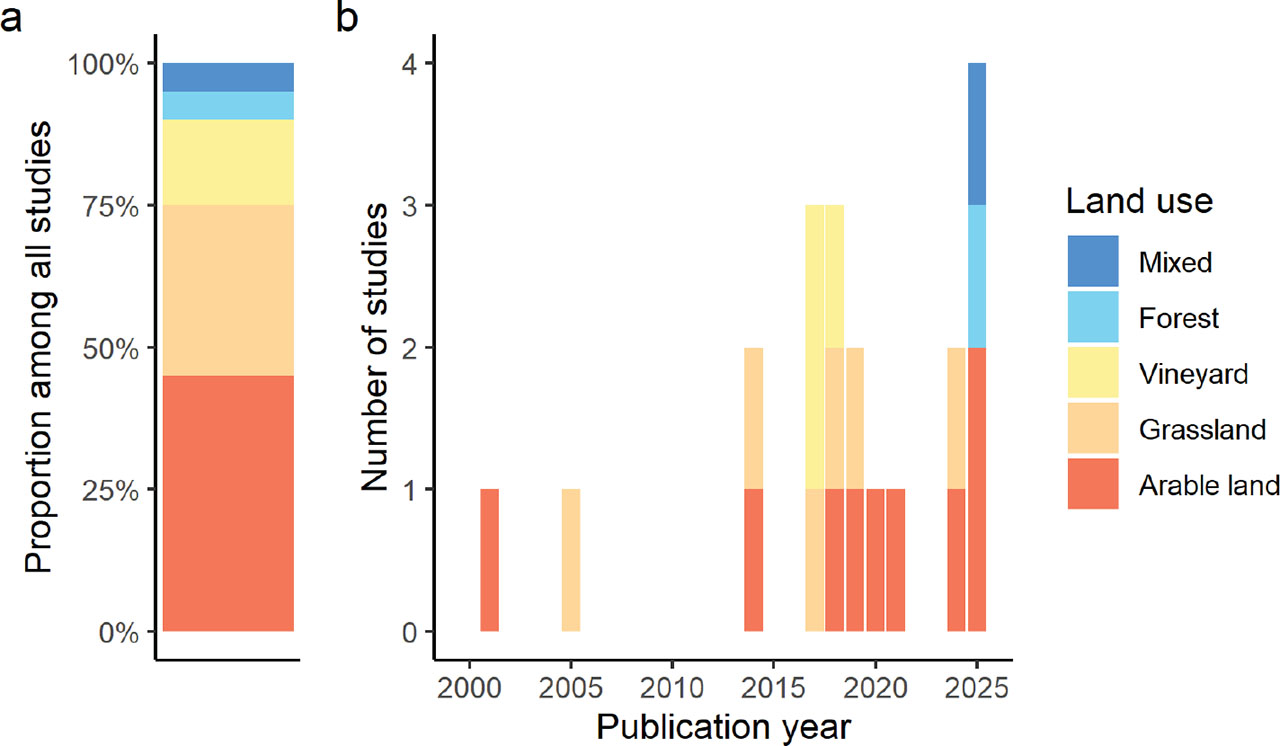
Figure 1.
(a) Proportion of different land uses in the 20 reviewed studies. (b) Distribution of studies over time based on publication year, with land uses also indicated by colour. Search conducted in September 2025.
Abbildung 1. (a) Anteile von verschiedenen Landnutzungstypen in den 20 behandelten Studien. (b) Zeitliche Verteilung der Studien basierend auf dem Jahr der Veröffentlichung, die Landnutzungstypen sind auch hier farblich ausgewiesen. Literatursuche im September 2025.
Table 1.
Overview of earthworm species found in all Austrian earthworm studies since 2000, listed per land use type. Total number of studies including species-specific information = 13. Outdated species nomenclature was updated whenever necessary according to Csuzdi (2012).
Tabelle 1. Übersicht über die Regenwurmarten, die in allen österreichischen Regenwurmstudien seit 2000 gefunden wurden, gelistet für den jeweiligen Landnutzungstyp. Die Gesamtanzahl der Studien, die Informationen auf Artniveau enthalten = 13. Veraltete Artnamen wurden anhand von Csuzdi (2012) aktualisiert.
Table 2.
Overview of studies investigating different environmental and management patterns in arable soils. A = abundance, B = biomass, S = species richness, N/A = not available, n. s. = no significant differences reported.
Tabelle 2. Übersicht über Studien zu verschiedenen Umwelt- und Managementeinflüssen in Ackerböden. A = Abundanz, B = Biomasse, S = Artenzahl, N/A = Information nicht vorhanden, n. s. = keine statistisch signifikanten Unterschiede berichtet.
| Study | Comparison | Response | Significance | Effect |
|---|---|---|---|---|
| Simon et al., 2025 | No-tillage cultivation, plough | A, B, S | p < 0.001, p < 0.001, p = 0.045 | High tillage intensity decreases all tested earthworm parameters |
| Euteneuer and Butt, 2025 | Conservation, conventional | A, B, S | p < 0.05, p < 0.05, p < 0.05 | Conservational land use positively impacts earthworms in terms of all three tested parameters |
| Rampazzo and Mentler, 2001 | Undisturbed non-agricultural land, conventional tillage | A, B, S | N/A | |
| Euteneuer et al., 2024 | Plough, cultivation, no-till | A, B | p = 0.006, p = 0.024 | No-till increases B and A |
| Jeanneret et al., 2021 | European study that includes Austria. Organic farming, conventional farming | S | n. s. | |
| Euteneuer et al., 2020 | Different cover crops, irrigation versus rainfed, different seasons | A, B, S | p < 0.01, n. s., n. s. | Under rainfed conditions, higher earthworm A in bare fallow compared to black oat and Sudan grass Cover crops are supporting earthworm B in winter |
| Euteneuer et al., 2019 | Cover crops, sclerotia, different seasons | A, B | p = 0.007, n. s. | Higher A under oil seed compared to bare fallow and oat. No effect of sclerotia |
| Spiegel et al., 2018 | Organic fertilisation, organic–mineral fertilisation, mineral fertilisation, control | A, B | n. s., n. s. | |
| Schneider et al., 2014 | European study that includes Austria. Organic farming, conventional farming | A, S | n. s., n. s. |
Table 3.
Overview of studies investigating different environmental and management patterns in grasslands. A = abundance, B = biomass, S = species richness, N/A = not available, n. s. = no significant differences reported, ↑ = positive effect/relationship, ↓ = negative effect/relationship.
Tabelle 3. Übersicht über Studien zu verschiedenen Umwelt- und Managementeinflüssen im Grünland. A = Abundanz, B = Biomasse, S = Artenzahl. N/A = Information nicht vorhanden, n. s. = keine statistisch signifikanten Unterschiede berichtet, ↑ = positiver Effekt/Zusammenhang, ↓ = negativer Effekt/Zusammenhang.
| Study | Type | Comparison | Response | Significance | Effect |
|---|---|---|---|---|---|
| Kerschbaumer et al., 2024 | Lowland grassland | Mowing frequency | A, B, S | n. s. | |
| Vegetation types (dry, fresh, moist) | B, S | p < 0.05 | ↓ Moist meadow | ||
| Jernej et al., 2019 | Montane grassland | Mowing versus abandonment | A | p < 0.1 | ↓ Abandoned |
| Vegetation characteristics | A | n. s. | |||
| Steinwandter et al., 2017 | Alpine grassland | Mowing versus pasturing | A | p < 0.01 | ↓ Pasture |
| Managing versus abandonment | A | n. s. | |||
| Seeber et al., 2005 | Alpine grassland | Mowing versus pasturing, managing versus abandonment | A, | p < 0.01 | ↑ Managed and abandoned meadows, abandoned pasture |
| B | n. s. | ↓ Managed pasture | |||
| Geitner et al., 2014 | Alpine grassland | Mowing versus pasturing | A, | n. s., | |
| B | n. s. | ||||
| Site characteristics | A (endogeic, epigeic, hemiedaphic groups) | Several significant ones | ↑ Humus, pH, parent rock, altitude | ||
| ↓ Thickness litter layer | |||||
| Steinwandter et al., 2018 | Alpine grassland | Grazing intensity (sheep) | A | N/A | Tendency: highest A at medium grazing intensity, lowest A at high grazing intensity |
Table 4.
Overview of studies investigating environmental and management patterns in vineyards. A = abundance, B = biomass, S = species richness, N/A = not available, n. s. = no significant differences reported, ↑ = positive effect/relationship, ↓ = negative effect/relationship.
Tabelle 4. Übersicht über Studien zu verschiedenen Umwelt- und Managementeinflüssen in Weingärten. A = Abundanz, B = Biomasse, S = Artenzahl. N/A = Information nicht vorhanden, n. s. = keine statistisch signifikanten Unterschiede gefunden, ↑ = positiver Effekt/Zusammenhang, ↓ = negativer Effekt/Zusammenhang.
| Study | Comparison | Response | Significance | Effect |
|---|---|---|---|---|
| Zaller et al., 2018 | Within rows: herbicides versus mechanical weeding | A, B | n. s., n. s. | |
| Buchholz et al., 2017 | Inter-rows: permanent green cover versus tillage | A, B, S | N/A | None |
| Site characteristics | A, B, S | N/A | ↑ Soil quality and plant biomass | |
| Faber et al., 2017 | Inter-rows: different tillage methods | A, B | n. s. |