
1. Introduction
Climate models predict an increase in average air temperatures, as well as a shift in precipitation patterns, resulting concurrently in more frequent and intense periods of heatwaves and drought in summer, accompanied by heavier intermittent rainfall events in Austria (APCC, 2014; IPCC, 2020; Thaler et al., 2021). A drought event encompasses a precipitation deficit, leading to soil water deficit, which exerts a range of stress effects on plants (Crocetti et al., 2020) and soil biota (Schimel, 2018).
The main water deficit response in plants is stomatal closure, thereby reducing photosynthetic CO2 uptake and triggering photoinhibition (Huseynova et al., 2016; Ahmad et al., 2018). This leads to increased proportion of 13C fixation, hence increasing the δ13C values of plant tissues. Generally, plants discriminate against 13C during carboxylation, and the observed isotope fractionation is positively correlated with the CO2 intercellular partial pressure and negatively correlated with stomatal resistance and plant water-use efficiency (Farquhar et al., 1989). Differences in photosynthetic discrimination at the time of tissue development, relocation of C assimilates, and post-photosynthetic isotope fractionation lead to different δ13C values in various plant tissues, with typically higher grain δ13C values than those in straw (Craufurd et al., 1991).
Drought stress also hampers the uptake of nutrients, such as N, by plants due to impaired membrane functionality and internal transport leading to lower root absorbing capacity (Rathore et al., 2017; Ahmad et al., 2018). Water limitation and impaired photosynthesis induce the mobilization of reserves from the stem and leaves to the grain (Yang et al., 2003; Blum, 2005; Srivastava et al., 2017), whereby the translocation of proteins is favored over starch (Singh et al., 2012; Mariem et al., 2021). These changes cause reduced plant productivity and altered grain quality compared to those of plants with optimal water supply (Barnabás et al., 2008; Crocetti et al., 2020; Mariem et al., 2021).
Ultimately, drought can lead to severe yield losses, especially in rainfed summer crops (Eitzinger et al., 2013; Bodner et al., 2015; Thaler et al., 2021). Yield losses of 25%–38% in winter wheat, 40% in maize, and up to 50% in sugar beet and potatoes due to drought have been reported in southeastern Europe (Van Lanen et al., 2016; Nagy et al., 2018). Yield losses are more pronounced in soils with low water storage capacity, whereas soils rich in organic matter are deemed more resilient to extreme weather events, such as drought and heavy rainfall, due to their higher aggregate stability and higher water infiltration and storage capacities (Lal, 2004; Altieri et al., 2015).
The drought response patterns of plants and soil biota will reciprocally interact with soil carbon (C) and nitrogen (N) dynamics. During prolonged and more intense drought events, the ecosystem C cycle is likely to slow down due to lower plant C input and diminished plant residue mineralization (Wu et al., 2011). Considering the ecosystem N cycle, a reduction of plant N uptake and an accumulation of inorganic and organic N in the soil were reported (Deng et al., 2021). Accumulation of soil N under drought was also observed for this experimental site (Watzinger et al., 2023), possibly outbalancing the reduced nutrient uptake capacity of plants under drought. Croplands predominantly receive mineral N fertilizer with a distinct low δ15N value, and δ15N values in plants commonly reflect 15N source signature (Choi et al., 2017). On the other hand, it is well documented that isotope fractionation processes in the soil and loss of 15N depleted N compounds have increased δ15N in plants under reduced mean annual precipitation in natural ecosystems (Amundson et al., 2003). Also, in agricultural settings, plant δ15N can be driven by isotope fractionation processes in the soil (Watzka et al., 2006). In addition, δ15N values in grain, in comparison to the values in straw, might give an indication of the plant availability of soil inorganic N at the time of grain filling. 15N in grain is enriched if plants have to relocate N from leaves to the grain (Kanstrup et al., 2011; Zhou et al., 2013).
It is commonly agreed that the ecosystem resistance and resilience to drought increases with increasing biodiversity due to the asynchrony of species’ responses (tolerance vs. recovery) (Klaus et al., 2016; Bardgett and Caruso, 2020). In croplands, particularly plant diversity is strongly reduced, leading to a decrease in the soil's C storage, the total nutrient pool (plant biomass and soil) (Furey and Tilman, 2021), and microbial activity (Lange et al., 2015). Often, long-term cultivated agricultural soils become impoverished in soil organic C content and exhibit a deterioration in soil structure under tillage. We, therefore, assumed very strong responses of crop yield and plant δ13C values as a proxy of water use efficiency to more frequent and intense periods of drought. We also hypothesized that plant N content would increase and δ15N values would decrease due to the accumulation of mineral fertilizer N in the soil under reduced precipitation.
To test this, main and catch crop yield, weed biomass, plant N and C content, and stable isotope values (δ13C and δ15N) were monitored in three soil types of varying fertility in a lysimeter facility of the Pannonian region in Austria. The site had been exposed to current and predicted (for the period 2071–2100) precipitation regimes for 9 years. Results from the last three experimental years are presented here.
2. Materials and Methods
2.1. Experimental set-up
The Austrian Agency for Health and Food Safety (AGES) lysimeter facility consists of 18 filled gravitation lysimeters representing the three main soil types of the Marchfeld, namely, calcaric Phaeozem (Ps), calcic Chernozem (Ch), and gleyic Phaeozem (Pg) (Gerzabek and Krenn 2005; Stenitzer and Hösch, 2005). The gleyic Phaeozem, a groundwater-influenced soil type, had become dry and experienced unnatural shrinking and crack formation. The main soil chemical properties of the upper 10 cm of lysimeter soils were redetermined in 2019 and are presented in the Supplemental Table 1. Further soil properties can be found in Tataw et al. (2014) and Watzinger et al. (2023). Rainfall was simulated with an overhead irrigation system since 2011 (Tataw et al., 2014, 2016). For the “current” scenario, half of the lysimeters were irrigated according to current precipitation patterns, as calculated by the 30-year mean of rainfall (amount and distribution) in Groß-Enzersdorf, Marchfeld (517 mm). The other half of lysimeters in the “predicted” scenario were watered according to the precipitation pattern predicted for a dry year (20 percentile) for the period 2071–2100 in the Pannonian region (436 mm) (Tataw et al., 2016). From 2018 onward, an adapted and improved model, the historic (1961–2000) and the hot and dry model scenario presented in Seidl et al. (2019), was used to calculate the “current” scenario and the “predicted” very dry year (5 percentile) scenario (531 and 386 mm precipitation per annum, respectively) (Watzinger et al., 2023). The lysimeter station was covered by a plastic tunnel and irrigated during the growing season, and it remained uncovered in winter when it received ambient precipitation. The period of coverage and irrigation treatment followed the precipitation scenarios for dry (2017) and very dry (2018, 2019) years, except that a heavy rainfall event was simulated on the 25th of April 2018 and 60 mm of precipitation was applied additionally. The amounts of precipitation and irrigation applied in the years 2017–2019 are illustrated in Figure 1.
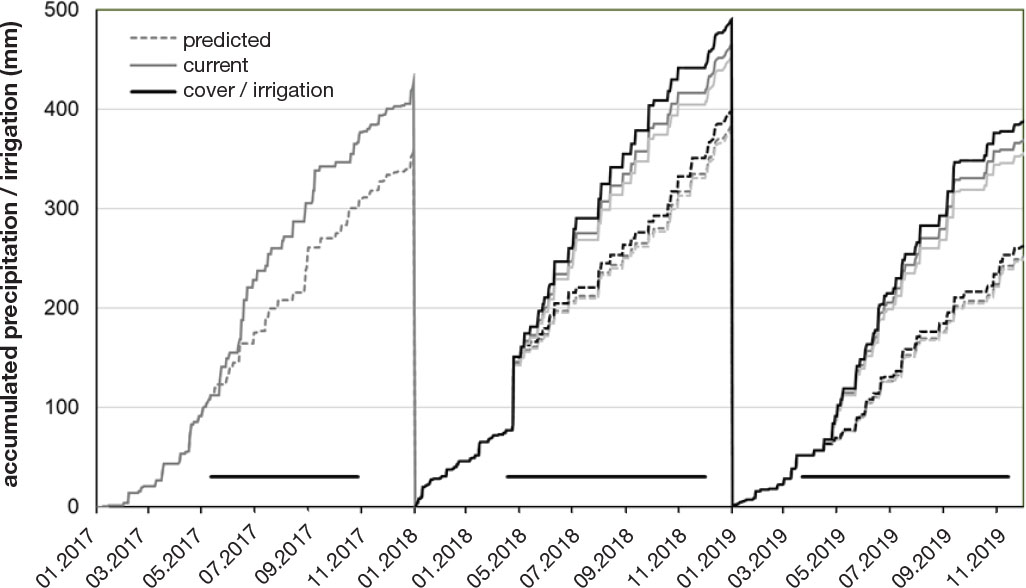
Figure 1.
Period of cover/irrigation (black line) and precipitation and irrigation applied to the lysimeter soil from 2017 until 2019. From 2018 onward, the variation of irrigation – the minimum (light gray) and the maximum (black) on lysimeter replicates – besides the average (dark gray) irrigation is illustrated.
Abbildung 1. Folienabdeckung der Lysimeteranlage und Bewässerung (schwarze Linie) sowie die akkumulierte Niederschlags- und Bewässerungsmenge in den Jahren 2017, 2018 und 2019. Ab 2018 wurde die Schwankung - Minimum (hellgrau), Maximum (schwarz), Mittelwert (dunkelgrau) – der Lysimeterbewässerung dargestellt.
The crop rotation and crop residue management throughout the experiment followed the common agricultural practices in the Marchfeld region (Table 1). Before sowing and after the harvest, the soil was manually tilled. Fertilizer was applied according to Austrian standard recommendations (BMLFUW, 2017) (Table 2). N fertilizer was added as calcium ammonium nitrate (NAC 27 N, Borealis LAT GmbH, Austria) with a stable isotope composition δ15N of −1.2‰. Visual controls for pest infestations were done on a regular basis to identify potential insect pests and to allow for appropriate measures to be taken. No significant insect infestations were detected for the duration of the experiments described. However, weeds were quite abundant and were removed manually.
Table 1.
Crop rotation and management of the lysimeters
Tabelle 1. Fruchtfolge und Bewirtschaftung der Lysimeteranlage
| Crop | Sowing | Harvest | Crop residue management |
|---|---|---|---|
| Spring wheat (Triticum turgidum subsp. durum (Desf.) Husn) cv. Floradur | 04.04.2017 | 20.07.2017 | Crop residues removed |
| White mustard (Sinapis alba L.) catch crop | 24.08.2017 | 07.03.2018 | Mustard residues were mulched and incorporated into the soil on 09.04.2018 |
| Spring barley (Hordeum vulgare L. cv. Cerbinetta) | 09.04.2018 | 23.07.2018 | Crop residues removed |
| Winter wheat (Triticum aestivum L.) cv. Capo | 11.10.2018 | 03.07.2019 | Crop residues incorporated |
Table 2.
Application rates of N fertilizer in kg N ha−1 dependent on the soil type (calcaric Phaeozem - PS; calcic Chernozem – Ch; gleyic Phaeozem – Pg)
Tabelle 2. Stickstoffdüngung in kg N ha−1 angepasst an den Bodentyp (calcaric Phaeozem - PS; calcic Chernozem – Ch; gleyic Phaeozem – Pg)
| Fertilization date | Pg | Ps | Ch |
|---|---|---|---|
| 04.04.2017 | 55 | 40 | 55 |
| 08.05.2018 | 50 | 50 | 50 |
| 20.03.2019 | 40 | 35 | 40 |
| 16.04.2019 | 65 | 45 | 65 |
| 16.05.2019 | 45 | 40 | 45 |
Aboveground plant biomass was harvested at the end of the vegetation period for crop and weed biomass determination and for further elemental and isotopic analyses in the laboratory. Plants were dried at 60°C for dry biomass determination. Cereal crops were separated into three different plant components – straw, grain, and chaff. On 06.07.2017, the second leaves after the flag leaves were sampled, pooled, and analyzed. Analysis of plant biomass and C and N isotope composition was conducted by Elemental Analyzer – Isotope Ratio Mass Spectrometry (EA-IRMS; elemental analyzer coupled to Delta V Advantage; Thermo Scientific, Bremen, Germany).
2.2. Statistical analysis
Two- or three-way analysis of variance (ANOVA) type III sum of squares analyses using soil type, precipitation treatment, and/or year as the main factors were run, and Tukey HSD (Honestly Significant Difference) tests were conducted. Generally, no transformation of raw data was necessary to meet the assumptions of normality and variance homogeneity. For statistical analysis, the R package Jamovi was used (R Core team, 2020; The jamovi project, 2021, Gallucci, 2019).
3. Results and Discussion
3.1. Response of plant biomass production to drought
More frequent and intense drought periods significantly decreased the total biomass and grain yield of crops and the harvest index (proportion of grain biomass to total aboveground biomass) in our lysimeter experiment (Tables 3 and 4, Figure 2, Supplemental Figure 1, and Supplemental Table 2). Moreover, earlier plant maturation was observed under the predicted precipitation scenario. Grain yields were highest in the gleyic Phaeozem, followed by the calcic Chernozem and the sandy calcaric Phaeozem. However, the impact of drought was strongest in both Phaeozem soil types compared to Chernozem (40% vs. 30% biomass reduction in spring barley and 40% vs. 10% biomass reduction in winter wheat). The grain yield declined most strongly in the sandy Phaeozem (60% reduction). These results are in line with current knowledge of the response of cereals to water shortage as observed in our experiment. The soil water content in the upper 10 cm determined during several points throughout the vegetation periods frequently approached the wilting point (−1.5 MPa) (Watzinger et al., 2023). It has been repeatedly reported that water limitation during grain filling reduces photosynthesis and accelerates leaf senescence in cereals, resulting in reduced availability of assimilates and a shortening of the grain-filling period (Dupont and Altenbach, 2003; Barnabás et al., 2008; Mariem et al., 2021). The lack of photoassimilates as well as reduced activity of starch-synthesizing enzymes inhibit grain starch production, which is one of the leading causes of reduced crop yields under water deficit (Worch et al., 2011). Higher water-holding and nutrient provision capacity of Chernozem likely buffered the impact of drought, as already reported by Tataw et al. (2016). Formation of cracks in the gleyic Phaeozem, which has a comparable water holding capacity to Chernozem, enabled preferential water flow, and hence likely hindered the storage of water. Our results were well in accordance with those presented by Tataw et al. (2016) from the same experimental site, who found significant reduction of grain yield and harvest index.
Table 3.
Harvests of cultivated crops and weeds per plant species and year for the different soil types and precipitation treatments in g m−2
Tabelle 3. Ernteertrag (g m−2) von Getreide, Zwischenfrucht und Beikräutern aus den Jahren 2017, 2018 und 2019 für die verschiedenen Bodentypen und Niederschlagsszenarien
| Crop (year) | Gleyic Phaeozem | Calcaric Phaeozem | Calcic Chernozem | |||
|---|---|---|---|---|---|---|
| Current | Predicted | Current | Predicted | Current | Predicted | |
| Spring wheat (2017) | 112 (19) | 35 (4) | 150 (38) | 73 (56) | 81 (19) | 33 (30) |
| Mustard (2017–2018) | 351 (38) | 360 (43) | 199 (63) | 177 (17) | 247 (88) | 351 (81) |
| Spring barley (2018) | 542 (56) | 352 (56) | 247 (104) | 145 (122) | 327 (68) | 249 (44) |
| Weed (2018) | 119 (47) | 104 (53) | 121 (36) | 100 (40) | 118 (88) | 70 (27) |
| Winter wheat (2019) | 953 (119) | 562 (118) | 456 (12) | 242 (83) | 625 (140) | 564 (37) |
| Weed (2019) | 12 (10) | 6 (7) | 33 (16) | 3 (0) | 35 (14) | 8 (9) |
[i] Given are the average values (n = 3; standard deviation in brackets) of aboveground dry plant biomass.
Table 4.
Two-way ANOVA table of the impact of soil and precipitation on the plant biomass of cash and catch crops, grain yield, and weeds in the years 2017–2019
Tabelle 4. 2-Wege-ANOVA-Tabelle zum Einfluss von Boden und Niederschlag auf die Pflanzenbiomasse von Haupt- und Zwischenfrüchten, Ertrag und Beikräuter für die Jahre 2017 bis 2019
| Parameter | Unit | Soil | Precipitation | ||
|---|---|---|---|---|---|
| F | p | F | p | ||
| Spring wheat | g m−2 | 4.47/PS | 0.035 | 19.6/curr | <0.001 |
| - Grain | g m−2 | 2.60 | 0.115 | 12.8/curr | 0.004 |
| - Straw | g m−2 | 6.17/PS | 0.014 | 19.2/curr | <0.001 |
| Mustard | g m−2 | 12.0 | 0.001 | 1.14 | 0.306 |
| Spring barley | g m−2 | 12.4/Pg | 0.001 | 8.76/curr | 0.012 |
| - Grain | g m−2 | 12.2/Pg | 0.001 | 8.73/curr | 0.012 |
| - Straw | g m−2 | 4.09/Pg | 0.044 | 6.97/curr | 0.022 |
| Weed | g m−2 | 0.208 | 0.815 | 1.29 | 0.279 |
| Winter wheat | g m−2 | 18.6/Pg | <0.001 | 16.3/curr | 0.002 |
| - Grain | g m−2 | 28.6/Pg | <0.001 | 27.6/curr | <0.001 |
| - Straw | g m−2 | 14.3/Pg | <0.001 | 9.15/curr | 0.011 |
| Weed | g m−2 | 2.27 | 0.146 | 17.0/curr | 0.001 |
[i] F indicates the mean square of the treatment divided by the mean square of the residuals and p is the significance value. The treatment (soil and precipitation) with the higher value is indicated after F. Values with p ≤ 0.05 are highlighted in bold. Pg – gleyic Phaeozem; Ps – calcaric Phaeozem; Ch – calcic Chernozem; curr – current precipitation scenario; pre – predicted precipitation scenario;
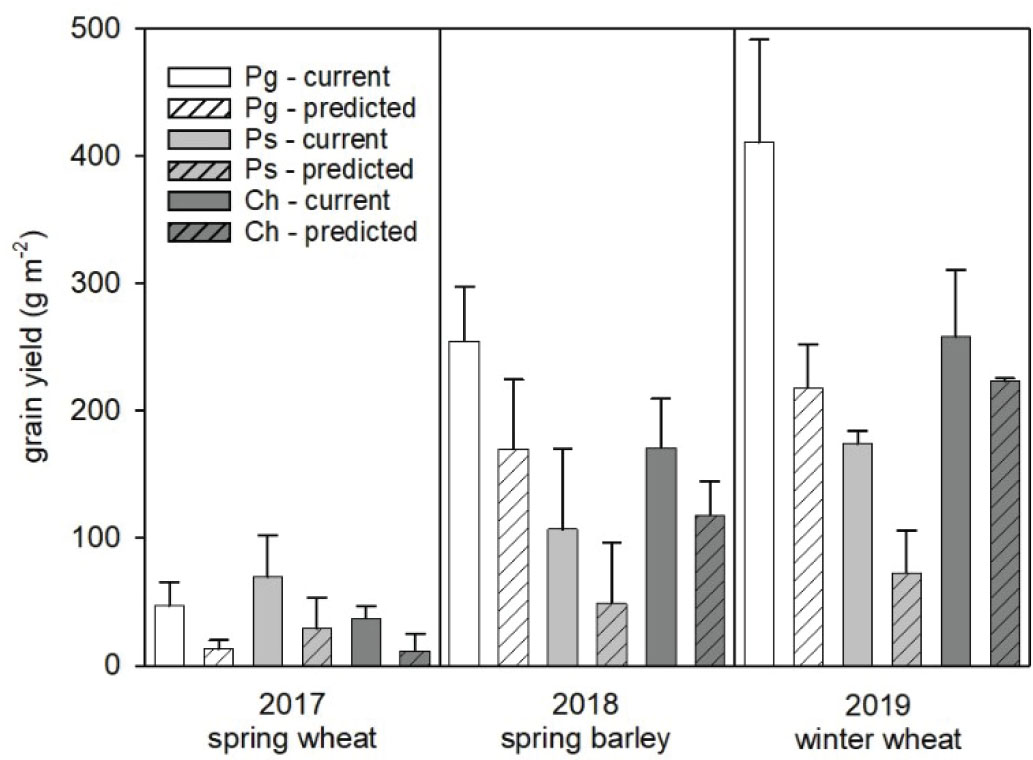
Figure 2.
Grain yield of spring wheat (2017), spring barley (2018), and winter wheat (2019) for the different soil types and precipitation treatments in g m−2. Given are the arithmetic mean values (n = 3), and the error bars represent the standard deviation.
Abbildung 2. Ertrag von Sommerweizen (2017), Sommergerste (2018) und Winterweizen (2019) für die verschiedenen Bodentypen und Niederschlagsszenarien in g m−2. Gegeben sind die arithmetischen Mittelwerte (n=3) und die Standardabweichung als Fehlerbalken.
In contrast to crops, weeds were less affected, which would underpin current knowledge that a genetically diverse community can adapt to environmental stress easier than a single species (Klaus et al., 2016) (Tables 3 and 4, Supplemental Table 2). Also, mustard biomass, which grows as a catch crop in winter, was not significantly affected by the soil type and precipitation scenarios. In contrast, the biomass of mustard even increased by 40% in Chernozem. It appeared that plants growing over the winter period (mustard and winter wheat) were not negatively affected by the previous drought periods when the current and predicted precipitation manipulation treatments were not in place, that is, both treatments received the same amount of precipitation. Especially plants in the Chernozem even profited from this, which was also observed by Evans and Burke (2013). We suspect that nutrients in general and N specifically accumulated in the soil due to reduced plant uptake in late spring and summer. Accumulation of N under the predicted precipitation regime in this experimental site was indicated using a stable isotope labeling approach (Watzinger et al., 2023).
The variation of plant growth between the lysimeters was generally high due to variations within the irrigation system. This was caused by differences in the water pressure along the irrigation lines and the drizzlers (2018: current 464 ± 38 mm, predicted 383 ± 20 mm; 2019: current 401 ± 32 mm, predicted 284 ± 14 mm) (Figure 1). Moreover, replications of lysimeter × treatment combinations were low (n = 3). In addition, the intensity of irrigation was high (2017: 86.4 mm h−1 and 2018 onward: 76.2 mm h−1), mimicking rather extreme rainfall events with intermittent dry spells. Moreover, some lysimeters were affected by animal activities (bioturbation by mice, burrowing activities by rabbits, dogs, and crows), especially in 2017, and there was an island effect, as lysimeters were surrounded by bare soil. These experimental issues might have led to the observed high variability and lower plant growth than expected under comparable field conditions.
Our data has to be contextualized within the constraints of unaltered temperature and CO2 concentration manipulation and bearing in mind that we had mimicked rather extreme drought years.
Cereal production models including temperature and CO2 concentration, besides precipitation, simulated lower reduction of yield or even increased yield for the same region in an average climate change year: spring barley 2% to >10% and winter wheat 0%–10% reduction (Eitzinger et al., 2013); winter wheat around 10 % yield increase and spring barley 18%–21% (Alexandrov et al., 2002; Eitzinger et al., 2008); and winter wheat 18%–28% yield increase (Thaler et al., 2021). Yield increase was mainly attributed to CO2 fertilization. Without CO2 fertilization, the yield of winter wheat is expected to decrease by around 12% in 2080 (Eitzinger et al., 2008). In addition, the predicted precipitation pattern chosen for our lysimeter study simulated the driest year out of five (20 percentile) in 2017 and the driest year out of 20 (5 percentile) in 2019. Precipitation manipulation was only commenced during the growing season; thus, the predicted higher precipitation during winter season was dismissed in our experimental set-up. Thaler et al. (2021) have presented data from the 10 percentiles and found that the increase of yield was less pronounced (11%–23%).
3.2. Alteration of the plant δ13C value
The increase of plant δ13C in the predicted precipitation scenario verified increased stomatal resistance and reduced photosynthetic C assimilation (Table 5, Supplemental Tables 2–5). Delta 13C values were also higher in sandy Phaeozem, followed by gleyic Phaeozem and Chernozem, which was also likely related to the soil water-holding capacity. Straw δ13C values were in line with those reported for leaves by Tataw et al. (2016) on the same experimental site. δ13C values were generally higher in grain than in leaves as reported earlier (Craufurd et al., 1991). The difference between straw and grain δ13C values was only significantly affected by the year/crop species. The difference was highest in winter wheat in 2019 (up to 3‰) and lowest in spring barley in 2018. This difference might have either derived from physiological differences of the plant species (Domergue et al., 2022) or be explained by a higher difference in water availability during leaf and grain development in 2019 than in 2018, when plants had received an additional 60-mm heavy rainfall event in late April.
Table 5.
Delta13C values of cultivated crops per plant species and year for the different soil types and precipitation treatments in ‰
Tabelle 5. Delta13C Werte der Kulturpflanzen pro Jahr für die verschiedenen Bodentypen und Niederschlagsszenarien in ‰
| Crop (year)/part | Gleyic Phaeozem | Calcaric Phaeozem | Calcic Chernozem | |||
|---|---|---|---|---|---|---|
| Current | Predicted | Current | Predicted | Current | Predicted | |
| Spring wheat (2017)/grain | −25.3 (0.6) | −23.6 (0.8) | −24.8 (0.8) | −23.7 (0.4) | −25.1 (1.0) | −24.4 (1.0) |
| Spring wheat (2017)/straw | −27.2 (1.0) | −26.0 (0.3) | −26.9 (0.3) | −26.0 (0.4) | −26.5 (0.6) | −25.5 (0.3) |
| Spring barley (2018)/grain | −27.1 (0.2) | −26.0 (0.3) | −25.2 (1.0) | −24.6 (0.7) | −27.9 (0.4) | −27.5 (0.3) |
| Spring barley (2018)/straw | n.d. | n.d. | −26.5 (0.3) | −25.7 (0.2) | −28.0 (0.3) | −27.1 (0.1) |
| Winter wheat (2019)/grain | −26.4 (0.1) | −24.6 (0.1) | −24.4 (0.1) | −23.6 (0.9) | −26.9 (0.8) | −25.1 (0.0) |
| Winter wheat (2019)/straw | −28.3 (0.8) | −27.5 (0.4) | −27.6 (0.5) | −26.7 (0.3) | −28.2 (0.4) | −27.6 (0.6) |
[i] Given are the average values (n = 3; standard deviation in brackets) n.d. not determined
3.3. The plant N content and its delta15N values
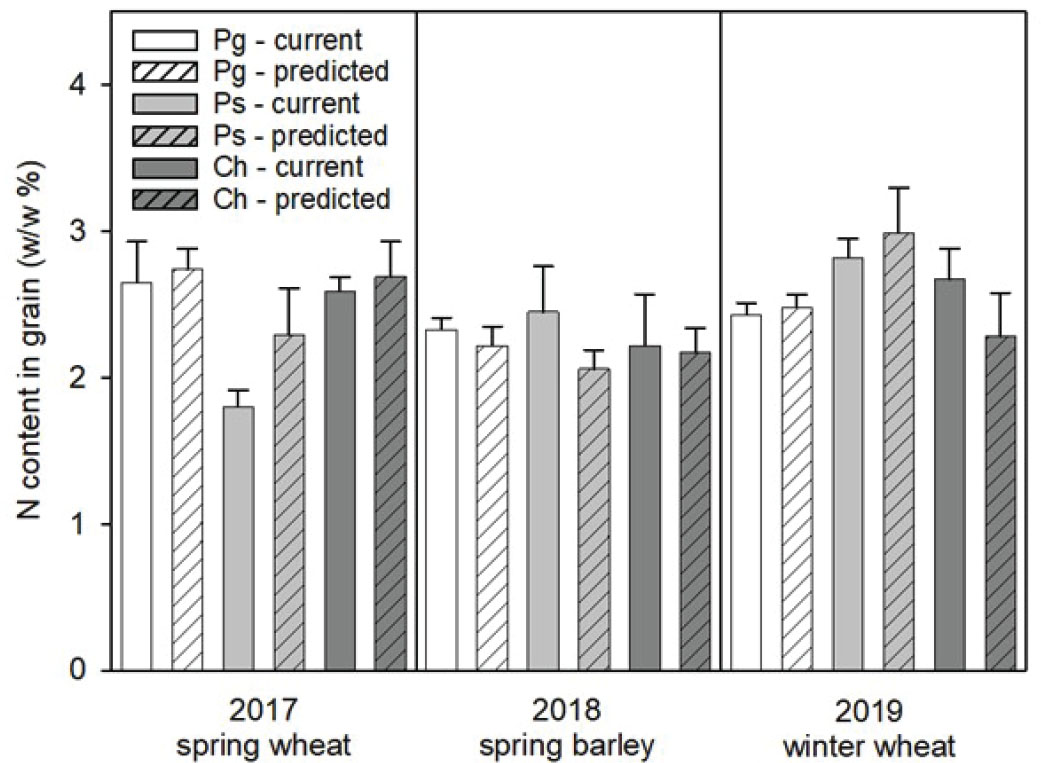
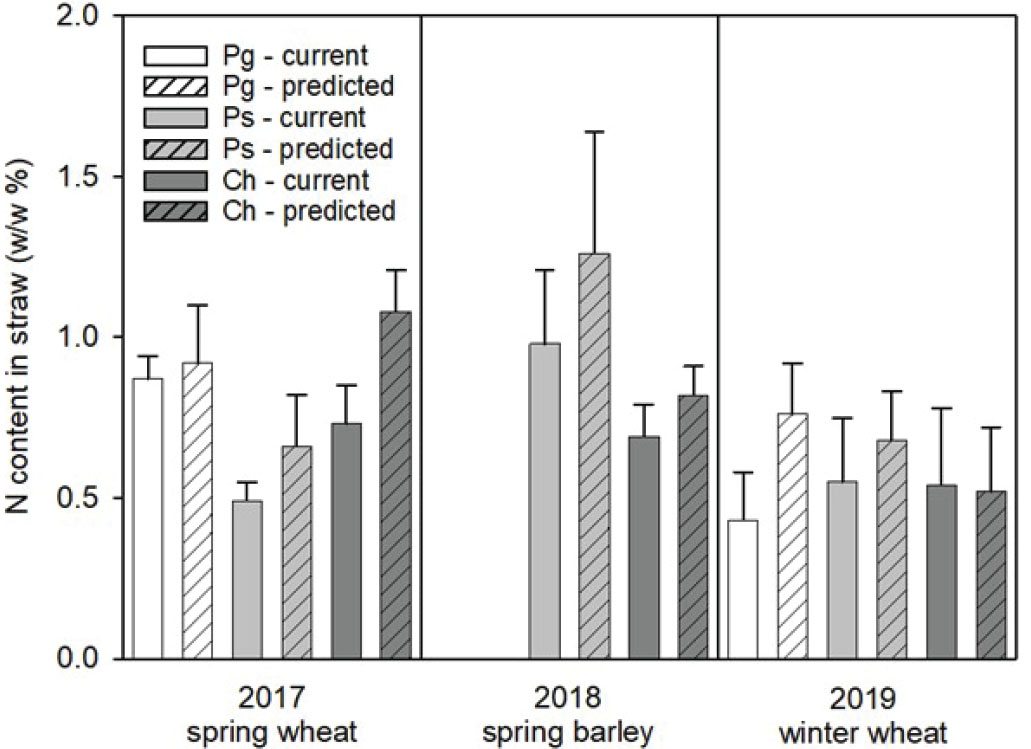
Grain N content of spring wheat was significantly elevated under drought in 2017. In the following years, the N content did not change significantly between the current and predicted precipitation scenarios, indicating no loss in the quality of grain (Supplemental Tables 2–5 and Supplemental Figure 2). Most importantly, N content in straw and mustard was higher under drought, which was likely driven by an accumulation of available N in the soil system due to lower plant N uptake, while N fertilization remained unchanged and N mineralization was less reduced (Watzinger et al., 2023, Evans and Burke, 2013) (Supplemental Tables 2–5 and Supplemental Figure 3). Higher straw N content likely facilitated the translocation of N into grains. In addition, the mobilization and translocation of proteins to cereal grains over the translocation of starch is favored under drought stress (Mariem et al., 2021), which might have also come into play in our experiment, thus balancing the grain quality between the treatments.
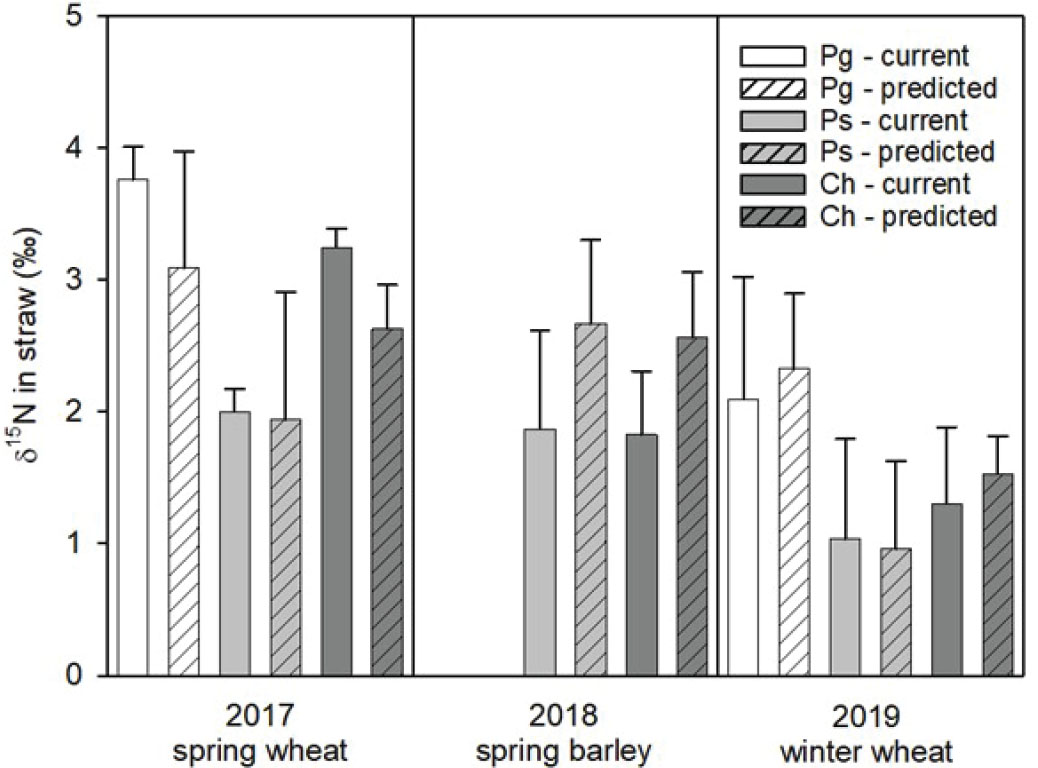
Crop δ15N values were significantly elevated in gleyic Phaeozem and Chernozem in comparison to the sandy calcaric Phaeozem soil, with a significant decrease in 2019 (Figure 3, Supplemental Tables 2 and 4 and Supplemental Figure 4). This likely resulted from a higher N uptake in the Pg and Ch soil and the higher percentage uptake of soil-born N with a higher δ15N value (6.9‰) than mineral N fertilizer (−1.2‰). Plant δ15N decreased in 2019, which can be attributed to three applications of N fertilizer in comparison to only one fertilization event in the previous years. Grain was 15N enriched by around 1‰ in comparison to straw. Enrichments are related to relocation of N from leaf to grain during grain filling (Kanstrup et al., 2011; Zhou et al., 2013), while provision of mineral N fertilizer during grain filling leads to lower fractionation due to lower relocation of N (Fuertes-Mendizábal et al., 2018). Accordingly, 15N enrichment in grain was less in winter wheat, which received three applications of mineral N fertilizer, in contrast to only one mineral fertilizer application in April and May during spike formation in spring wheat and spring barley in 2017 and 2018. Significant differences in plant δ15N values between precipitation scenarios were rare and observed in leaves in 2017 and grain in 2019. Then, δ15N values were lower under drought, possibly indicating higher percentage of mineral fertilizer N usage (Bol et al., 2005; Choi et al., 2017) and higher N remaining from soybean plant residues (N-fixing plant species with low δ15N values) incorporated in 2016. Decreased plant δ15N values have also been attributed to more closed N cycling, that is, low N input/output versus N turnover in soils. A closer N cycle has been seen in natural ecosystems and increasing mean annual precipitation (Amundson et al., 2003), while the use of mineral fertilizer might trigger the loss of N under drought due to asynchronicity of fertilizer application and plant uptake (Ullah et al., 2020). However, as we have already documented lower soil N losses but similar N turnover rates under drought in this experiment (Watzinger et al., 2023), we concluded that δ15N values in the plant were rather driven by the source coinciding with the accumulation of mineral N fertilizer.
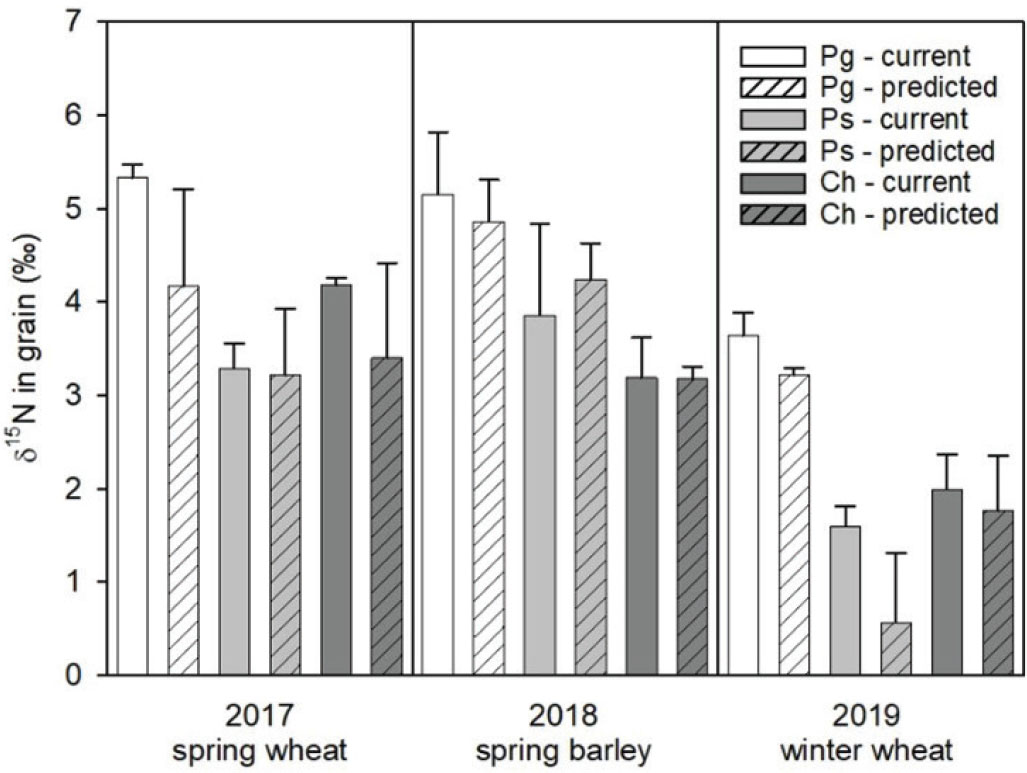
Figure 3.
Grain δ15N values of spring wheat (2017), spring barley (2018), and winter wheat (2019) for the different soil types and precipitation treatments in ‰. Given are arithmetic mean values (n = 3), and the error bars represent the standard deviation.
Abbildung 3. Korn δ15N Werte von Sommerweizen (2017), Sommergerste (2018) und Winterweizen (2019) für die verschiedenen Bodentypen und Niederschlagsszenarien in ‰. Gegeben sind die arithmetischen Mittelwerte (n = 3) und die Standardabweichung als Fehlerbalken.
4. Conclusions
The study area “Marchfeld” is one of the warmest and driest areas (precipitation: 560 mm year−1, mean annual temperature: 11.2°C) in Austria and is intensively used for agricultural production of grain and vegetables. Especially for enabling the cultivation of vegetables, irrigation is conducted, and in the last few years also, cereals had to be occasionally irrigated in spring. The 9-year lasting precipitation manipulation in our experiment affected aboveground biomass (crops) due to drought stress more than soil biota (Watzinger et al., 2023), reinforcing the dominant role of plants in controlling the soil C and N cycles via N uptake and C input. Higher biomass production in the soil type with higher water storage capacity corroborates the importance of good soil structure, but fertile soils cannot completely outbalance the negative impacts due to more frequent and intense drought periods. Regarding the predicted extreme weather events, additional water conservation strategies will become very important. In addition, fertilization regimes might need to be adapted to prevent the accumulation of nutrients in the soil system under reduced plant biomass growth. N, in particular, is prone to gaseous and hydrological losses in the ecosystem, when fields are irrigated in the near future.
Acknowledgments
The work was funded by the Austrian Climate Research Program 9 under the project name Climagrocycle (KR16AC0K13275).
Supplemental Tables and Figures
Supplemental Table 1.
Chemical and physical soil characteristics (n = 6) of gleyic Phaeozem (Pg), sandy calcaric Phaeozem (Ps), and calcic Chernozem (Ch) in the upper 10 cm.
Ergänzungstabelle 1. Chemische und physikalische Bodeneigenschaften (n = 6) des gleyic Phaeozem (Pg), des sandigen calcaric Phaeozem (Ps) und des calcic Chernozem (Ch) in den oberen 10 cm.
| Parameter | Pg | Ps | Ch |
|---|---|---|---|
| pH | 7.92 ± 0.04 | 7.93 ± 0.03 | 7.94 ± 0.03 |
| CaCO3 (%) | 29.0 ± 1.0 | 13.9 ± 0.4 | 20.9 ± 1.0 |
| Total organic C (%) | 2.32 ± 0.09 | 1.93 ± 0.12 | 2.91 ± 0.04 |
| Total N (%) | 0.211 ± 0.012 | 0.102 ± 0.005 | 0.227 ± 0.005 |
| Available N (mg/kg/7 d) | 57.9 ± 5.7 | 37.5 ± 5.5 | 59.2 ± 4.5 |
| Available P (mg/kg) | 62.5 ± 5.2 | 134.3 ± 3.8 | 81.0 ± 6.2 |
| Available K (mg/kg) | 82.02 ± 13.5 | 57.0 ± 8.5 | 73.5 ± 8.0 |
| CEC (cmolc/kg) | 25.9 ± 1.2 | 13.8 ± 0.4 | 28.9 ± 0.3 |
| Ca (% from CEC) | 76.5 ± 1.4 | 78.1 ± 0.7 | 78.4 ± 1.0 |
| Mg (% from CEC) | 19.8 ± 1.2 | 18.0 ± 0.6 | 18.6 ± 0.9 |
| K (% from CEC) | 1.1 ± 0.1 | 1.5 ± 0.2 | 0.9 ± 0.1 |
| Na (% from CEC) | 2.5 ± 0.4 | 2.4 ± 0.4 | 2.1 ± 0.3 |
| Aggregate stability (%) | 21.3 ± 5.5 | 23.2 ± 8.5 | 30.7 ± 6.8 |
[i] Available N determined using anaerobic incubation (ÖNORM L1204); Available K and P determined using a calcium lactate acetate extraction; CEC = cation exchange capacity determined using BaCl2 extraction; H, Mn, Fe, and Al were not detected in the BaCl2 extractant.
Supplemental Table 2.
Three-way ANOVA tables of the overall impact of soil, precipitation, and year (2017, 2018, and 2019) on crop yield, carbon and nitrogen content, and carbon and nitrogen isotope signature
Ergänzungstabelle 2. 3-Wege-ANOVA-Tabellen der Auswirkungen von Boden, Niederschlag und Jahr (2017, 2018 und 2019) auf Ernteertrag, Kohlenstoff- und Stickstoffgehalt sowie Kohlenstoff- und Stickstoffisotopensignatur.
| Parameter | Unit | Soil | Precipitation | Year | ||
|---|---|---|---|---|---|---|
| F | p | F | p | p | ||
| Crop | g m−2 | 25.8/Pg, Ch | <0.001 | 34.1/curr | <0.001 | <0.001 |
| - Grain | g m−2 | 30.9/Pg, Ch | <0.001 | 42.9/curr | <0.001 | <0.001 |
| - Straw | g m−2 | 16.4/Pg | <0.001 | 20.5/curr | <0.001 | <0.001 |
| Harvest index | 2.004 | 0.150 | 7.98/curr | 0.008 | 0.031 | |
| Weed** | g m−2 | 0.08 | 0.924 | 3.75 | 0.065 | <0.001 |
| Grain N | % | 0.76 | 0.474 | 0.60 | 0.444 | 0.005 |
| Straw N* | % | 0.79 | 0.461 | 12.3/pre | 0.001 | <0.001 |
| Grain δ15N | ‰ | 40.3/Pg | <0.001 | 6.09/curr | 0.019 | <0.001 |
| Straw δ15N* | ‰ | 11.0/Ch | <0.001 | 0.16 | 0.688 | <0.001 |
| Grain C | % | 4.19/PS, Ch | 0.024 | 0.248 | 0.662 | 0.061 |
| Straw C* | % | 5.94/PS | 0.006 | 0.50 | 0.485 | <0.001 |
| Grain δ13C | ‰ | 28.4/PS | <0.001 | 33.8/pre | <0.001 | <0.001 |
| Straw δ13C* | ‰ | 10.2/PS | <0.001 | 38.7/pre | <0.001 | <0.001 |
F indicates the mean square of the treatment divided by the mean square of the residuals and p is the significance value. The treatment (soil and precipitation) with the higher value is indicated after F. Values with p ≤ 0.05 are highlighted in bold.
Supplemental Table 3.
Two-way ANOVA table of the impact of soil and precipitation on carbon and nitrogen content and isotope signature of spring wheat and mustard cultivated in 2017
Ergänzungstabelle 3. 2-Wege-ANOVA-Tabelle zum Einfluss von Boden und Niederschlag auf den Kohlenstoff- und Stickstoffgehalt und die Isotopensignatur von Sommerweizen und Senf (2017)
| Parameter | Unit | Soil | Precipitation | ||
|---|---|---|---|---|---|
| F | p | F | p | ||
| Spring wheat – harvest 20.07.2017 | |||||
| Grain N | % | 16.8/Pg, Ch | <0.001 | 5.11/pre | 0.043 |
| Straw N | % | 13.4/Pg, Ch | <0.001 | 9.65/pre | 0.009 |
| Grain δ15N | ‰ | 7.61/Pg | 0.007 | 4.46 | 0.056 |
| Straw δ15N | ‰ | 10.1/Pg, Ch | 0.003 | 2.78 | 0.121 |
| Grain C | % | 8.11/Pg, Ch | 0.006 | 0.61 | 0.450 |
| Straw C | % | 4.49 | 0.035 | 0.71 | 0.416 |
| Grain δ13C | ‰ | 0.61 | 0.561 | 8.83/pre | 0.012 |
| Straw δ13C | ‰ | 2.16 | 0.158 | 15.2/pre | 0.002 |
| Spring wheat – leaf 06.07.2017 | |||||
| Leaf N | % | 19.0/Pg, Ch | <0.001 | 5.11/pre | 0.043 |
| Leaf δ15N | ‰ | 8.96/Pg | 0.004 | 14.0/curr | 0.003 |
| Leaf C | % | 0.088 | 0.916 | 3.97 | 0.070 |
| Leaf δ13C | ‰ | 2.13 | 0.161 | 30.8/pre | <0.001 |
| Mustard leaf 24.10.2017 | |||||
| Mustard N | % | 41.3/Pg | <0.001 | 17.1/pre | 0.003 |
| Mustard δ15N | ‰ | 0.52 | 0.609 | 1.52 | 0.241 |
| Mustard C | % | 3.59 | 0.063 | 4.50 | 0.057 |
| Mustard δ13C | ‰ | 0.65 | 0.538 | 4.18 | 0.064 |
[i] F indicates the mean square of the treatment divided by the mean square of the residuals and p is the significance value. The treatment (soil and precipitation) with the higher value is indicated after F. Values with p ≤ 0.05 are highlighted in bold. Pg – gleyic Phaeozem; PS – sandy Phaeozem; Ch – Chernozem; curr – current precipitation scenario; pre – predicted precipitation scenario
Supplemental Table 4:
Two-way ANOVA tables of the impact of soil and precipitation on yield, carbon and nitrogen content, and isotope signature of spring barley cultivated in 2018
Ergänzungstabelle 4. 2-Wege-ANOVA-Tabelle zum Einfluss von Boden und Niederschlag auf den Kohlenstoff- und Stickstoffgehalt und die Isotopensignatur von Sommergerste (2018)
| Spring barley – harvest 23.07.2018 | |||||
|---|---|---|---|---|---|
| Parameter | Unit | Soil | Precipitation | ||
| F | p | F | p | ||
| Grain N | % | 0.24 | 0.792 | 3.11 | 0.103 |
| Straw N* | % | 7.71/PS | 0.024 | 1.76 | 0.221 |
| Grain δ15N | ‰ | 15.2/Pg | <0.001 | 0.01 | 0.919 |
| Straw δ15N* | ‰ | 0.05 | 0.834 | 4.92 | 0.057 |
| Grain C | % | 1.39 | 0.286 | 0.46 | 0.512 |
| Straw C* | % | 7.11/PS | 0.028 | 0.76 | 0.409 |
| Grain δ13C | ‰ | 37.5/PS Pg | <0.001 | 7.15/pre | 0.020 |
| Straw δ13C* | ‰ | 117/PS | <0.001 | 40.5/pre | <0.001 |
F indicates the mean square of the treatment divided by the mean square of the residuals and p is the significance value. The treatment (soil and precipitation) with the higher value is indicated after F. Values with p ≤ 0.05 are highlighted in bold.
Supplemental Table 5.
Two-way ANOVA tables of the impact of soil and precipitation on yield, carbon and nitrogen content, and isotope signature of winter wheat cultivated in 2019
Ergänzungstabelle 5. 2-Wege-ANOVA-Tabelle zum Einfluss von Boden und Niederschlag auf den Kohlenstoff- und Stickstoffgehalt und die Isotopensignatur von Winterweizen (2019)
| Parameter | Winter wheat – harvest 03.07.2019 | |||||
|---|---|---|---|---|---|---|
| Unit | Soil | Precipitation | ||||
| F | p | F | p | |||
| Grain N | % | 0.77 | 0.488 | 0.41 | 0.536 | |
| Straw N | % | 2.10 | 0.166 | 4.92/pre | 0.047 | |
| Grain δ15N | ‰ | 36.8/Pg, Ch | <0.001 | 5.74/curr | 0.038 | |
| Straw δ15N | ‰ | 5.22/Pg | 0.023 | 0.17 | 0.688 | |
| Grain C | % | 91.6/Pg | <0.001 | 0.00 | 0.987 | |
| Straw C | % | 5.79/PS, Ch | 0.017 | 0.60 | 0.452 | |
| Grain δ13C | ‰ | 13.2/PS | 0.002 | 21.1/pre | 0.001 | |
| Straw δ13C | ‰ | 4.05/PS | 0.045 | 8.38/pre | 0.013 | |
[i] F indicates the mean square of the treatment divided by the mean square of the residuals and p is the significance value. The treatment (soil and precipitation) with the higher value is indicated after F. Values with p ≤ 0.05 are highlighted in bold. Pg – gleyic Phaeozem; PS – sandy Phaeozem; Ch – Chernozem; curr – current precipitation scenario; pre – predicted precipitation scenario
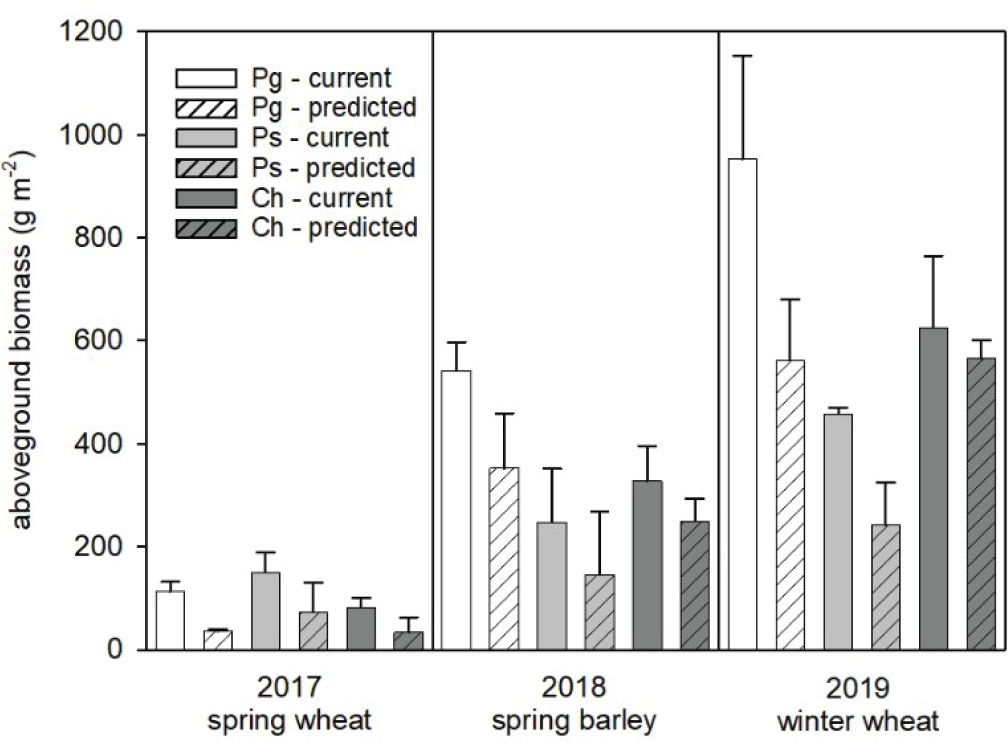
Supplemental Figure 1.
Harvests of spring wheat (2017), spring barley (2018), and winter wheat (2019) for the different soil types and precipitation treatments in g m−2. Given are the arithmetic mean values (n = 3) of the aboveground dry biomass, and the error bars represent the standard deviation.
Ergänzungsabbildung 1. Ernten von Sommerweizen (2017), Sommergerste (2018) und Winterweizen (2019) für die verschiedenen Bodentypen und Niederschlagsbehandlungen in g m−2. Gegeben sind die arithmetischen Mittelwerte (n=3). Die Fehlerbalken stellen die Standardabweichung dar.
Supplemental Figure 2.
Grain N content of spring wheat (2017), spring barley (2018), and winter wheat (2019) for the different soil types and precipitation treatments in ‰. Given are the arithmetic mean values (n = 3), and the error bars represent the standard deviation.
Ergänzungsabbildung 2. Stickstoffgehalt im Korn von Sommerweizen (2017), Sommergerste (2018) und Winterweizen (2019) für die verschiedenen Bodentypen und Niederschlagsbehandlungen in ‰. Gegeben sind die arithmetischen Mittelwerte (n = 3). Die Fehlerbalken stellen die Standardabweichung dar.
Supplemental Figure 3.
Straw N content of spring wheat (2017), spring barley (2018), and winter wheat (2019) for the different soil types and precipitation treatments in ‰. Given are the arithmetic mean values (n = 3), and the error bars represent the standard deviation.
Ergänzungsabbildung 3. Stickstoffgehalt des Strohs von Sommerweizen (2017), Sommergerste (2018) und Winterweizen (2019) für die verschiedenen Bodentypen und Niederschlagsbehandlungen in ‰. Gegeben sind die arithmetischen Mittelwerte (n = 3). Die Fehlerbalken stellen die Standardabweichung dar.
Supplemental Figure 4.
Straw δ15N values of spring wheat (2017), spring barley (2018), and winter wheat (2019) for the different soil types and precipitation treatments in ‰. Given are the arithmetic mean values (n = 3), and the error bars represent the standard deviation.
Ergänzungsabbildung 4. Delta15N-Werte des Strohs von Sommerweizen (2017), Sommergerste (2018) und Winterweizen (2019) für die verschiedenen Bodentypen und Niederschlagsbehandlungen in ‰. Gegeben sind die arithmetischen Mittelwerte (n = 3). Die Fehlerbalken stellen die Standardabweichung dar.