
Table 1
Basic characteristics of loam and organic residues: (i) 80% maize and 20% sugar beet (80m20b), (ii) 20% maize and 80% sugar beet (20m80b), and (iii) 20% winter wheat and 80% sugar beet (20w80b); compost (com); and sewage sludge (sl) with two repeated measurements each and symbol ± corresponds to the standard deviation.
Tabelle 1. Grundlegende Eigenschaften des Lehms und der organischen Rückstände: (i) 80 % Mais und 20 % Zuckerrübe (80m20b), (ii) 20 % Mais und 80 % Zuckerrübe (20m80b) und (iii) 20 % Weizen und 80 % Zuckerrübe (20w80b), Kompost (com) und Klärschlamm (sl) mit jeweils zwei Messwiederholungen und das Symbol ± entspricht der Standardabweichung.
| Parameters | Loam | com | sl | 80m20b | 20m80b | 20w80b |
|---|---|---|---|---|---|---|
| pHCaCl2 (−) | 6.79 ± 0.3 | 8.08 ± 0.6 | 7.47 ± 0.3 | 7.74 ± 0.3 | 7.72 ± 0.3 | 7.78 ± 0.4 |
| OC (g kg−1) | 11.96 ± 2.3 | - | - | - | - | - |
| dm (%) | - | 52.0 ± 4 | - | 5.51 ± 0.2 | 5.38 ± 0.3 | 5.38 ± 0.1 |
| NH4-N (kg m3 om−1) | - | - | - | 1.95 ± 0.3 | 2.09 ± 0.3 | 2.08 ± 0.4 |
| Ntotal (kg m3 om−1) | - | 1.24 ± 0.2 | 4.02 ± 0.3* | 2.82 ± 0.1 | 2.87 ± 0.2 | 2.32 ± 0.1 |
| P (g kg dm−1) | - | 1.97 ± 0.2 | 2.46 ± 0.2* | 23.5 ± 1.1 | 23.6 ± 1.8 | 27.3 ± 1.9 |
| K (g kg dm−1) | - | 5.95 ± 0.5 | 3.49 ± 0.3* | 71.9 ± 3.4 | 75.1 ± 2.9 | 74.4 ± 3.1 |
| Mg (g kg dm−1) | - | 4.03 ± 0.4 | 1.96 ± 0.1* | 10.1 ± 0.9 | 10.4 ± 1.1 | 13.0 ± 0.8 |
| Ca (g kg dm−1) | - | 21.9 ± 1.6 | - | 28.3 ± 1.4 | 28.7 ± 2.1 | 31.5 ± 1.8 |
| Na (g kg dm−1) | - | - | - | 3.24 ± 0.2 | 3.03 ± 0.1 | 3.59 ± 0.1 |
| C/N (–) | 10 ± 0.9 | - | - | 8.02 ± 0.3 | 7.97 ± 0.2 | 9.98 ± 0.2 |
Table 2
Soil characteristics after the application of the organic residues to loam: (i) 80% maize and 20% sugar beet (80m20b), (ii) 20% maize and 80% sugar beet (20m80b), and (ii) 20% winter wheat and 80% sugar beet (20w80b); compost (com); and sewage sludge (sl) for two repeated measurements each, and symbol ± corresponds to the standard deviation. Differences in mean values compared to loam were significant at p<0.05 (*), p<0.01 (**), p<0.001 (***), and p<0.0001 (****) for ANOVA.
Tabelle 2. Bodeneigenschaften nach der Zuführung der organischen Rückstände zum Lehm: (i) 80 % Mais und 20 % Zuckerrübe (80m20b), (ii) 20 % Mais und 80 % Zuckerrübe (20m80b) und (iii) 20 % Weizen und 80 % Zuckerrübe (20w80b), Kompost (com) und Klärschlamm (sl) mit jeweils zwei Messwiederholungen und das Symbol ± entspricht der Standardabweichung. Abweichungen zum Mittelwert des Lehms sind bei der ANOVA signifikant bei p<0,05 (*), <0,01 (**), <0,001 (***), <0,0001 (****).
| Parameters | Loam | com | sl | 80m20b | 20m80b | 20w80b |
|---|---|---|---|---|---|---|
| pHCaCl2 (−) | 6.79 ± 0.3 | 6.87 ± 0.3 | 6.75 ± 0.3 | 6.62 ± 0.4 | 6.59 ± 0.6 | 6.65 ± 0.3 |
| CECpot (cmolc kg−1) | 9.39 ± 1.4 | 11.1 ± 1.5* | 9.78 ± 0.7 | 10.2 ± 0.8 | 9.58 ± 0.6 | 9.68 ± 0.6 |
| Na (cmolc kg−1) | 0.11 ± 0.1 | 0.12 ± 0.1 | 0.11 ± 0.1 | 0.25 ± 0.1**** | 0.12 ± 0.1 | 0.12 ± 0.1 |
| K (cmolc kg−1) | 0.64 ± 0.1 | 0.83 ± 0.1** | 0.68 ± 0.1 | 1.23 ± 0.1**** | 1.24 ± 0.2**** | 1.19 ± 0.2**** |
| Mg (cmolc kg−1) | 2.35 ± 0.1 | 2.38 ± 0.3 | 2.39 ± 0.2 | 2.58 ± 0.3 | 2.61 ± 0.2 | 2.51 ± 0.3 |
| Ca (cmolc kg−1) | 7.71 ± 0.9 | 8.56 ± 0.7 | 8.21 ± 1.1 | 8.24 ± 0.9 | 8.31 ± 0.8 | 7.97 ± 0.9 |
| OC (g kg−1) | 12.4 ± 1.4 | 13.5 ± 1.9 | 12.2 ± 1.1 | 14.1 ± 1.7 | 14.3 ± 1.5* | 13.2 ± 1.2 |
| Ntotal (g kg−1) | 1.19 ± 0.1 | 1.28 ± 0.1 | 1.31 ± 0.1 | 1.52 ± 0.2 | 1.61 ± 0.1 | 1.48 ± 0.1 |
| C/N ratio | 10 ± 0.4 | 10 ± 0.6 | 10 ± 0.6 | 9 ± 0.3 | 9 ± 0.4 | 9 ± 0.3 |
Table 3
Porosity, ε, air capacity, AC, plant available water capacity, AWC, and saturated hydraulic conductivity, Ks, after the application of the organic residues to the loam for 8–10 repeated measurements each. Differences in mean values compared to loam were significant at p<0.05 (*), p<0.01 (**), p<0.001 (***), and p<0.0001 (****) for ANOVA. The symbol ± corresponds to the standard deviation; abbreviations of residues are listed in Table 1.
Tabelle 3. Porosität, ε, Luftkapazität, AC, nutzbare Feldkapazität, nFK, und gesättigte Wasserleitfähigkeit, Ks, nach der Zuführung der organischen Rückstände zum Lehm mit jeweils 8–10 Messwiederholungen. Abweichungen zum Mittelwert des Lehms sind bei der ANOVA signifikant bei p<0,05 (*), <0,01 (**), <0,001 (***), <0,0001 (****). Das Symbol ± entspricht der Standardabweichung; Abkürzungen sind in Tabelle 1 aufgeführt.
| Residues | ε | AC | AWC | Ks |
|---|---|---|---|---|
| (cm3 cm−3) | (cm3 cm−3) | (cm3 cm−3) | (cm d−1) | |
| Loam | 0.462 | 0.142 | 0.143 | 54 ± 11 |
| com | 0.438 | 0.154 | 0.114** | 58 ± 12 |
| sl | 0.439 | 0.151 | 0.122* | 40 ± 14 |
| 80m20b | 0.447 | 0.143 | 0.130 | 55 ± 21 |
| 20m80b | 0.473 | 0.191*** | 0.111*** | 59 ± 23 |
| 20w80b | 0.445 | 0.122 | 0.145 | 79 ± 31 |
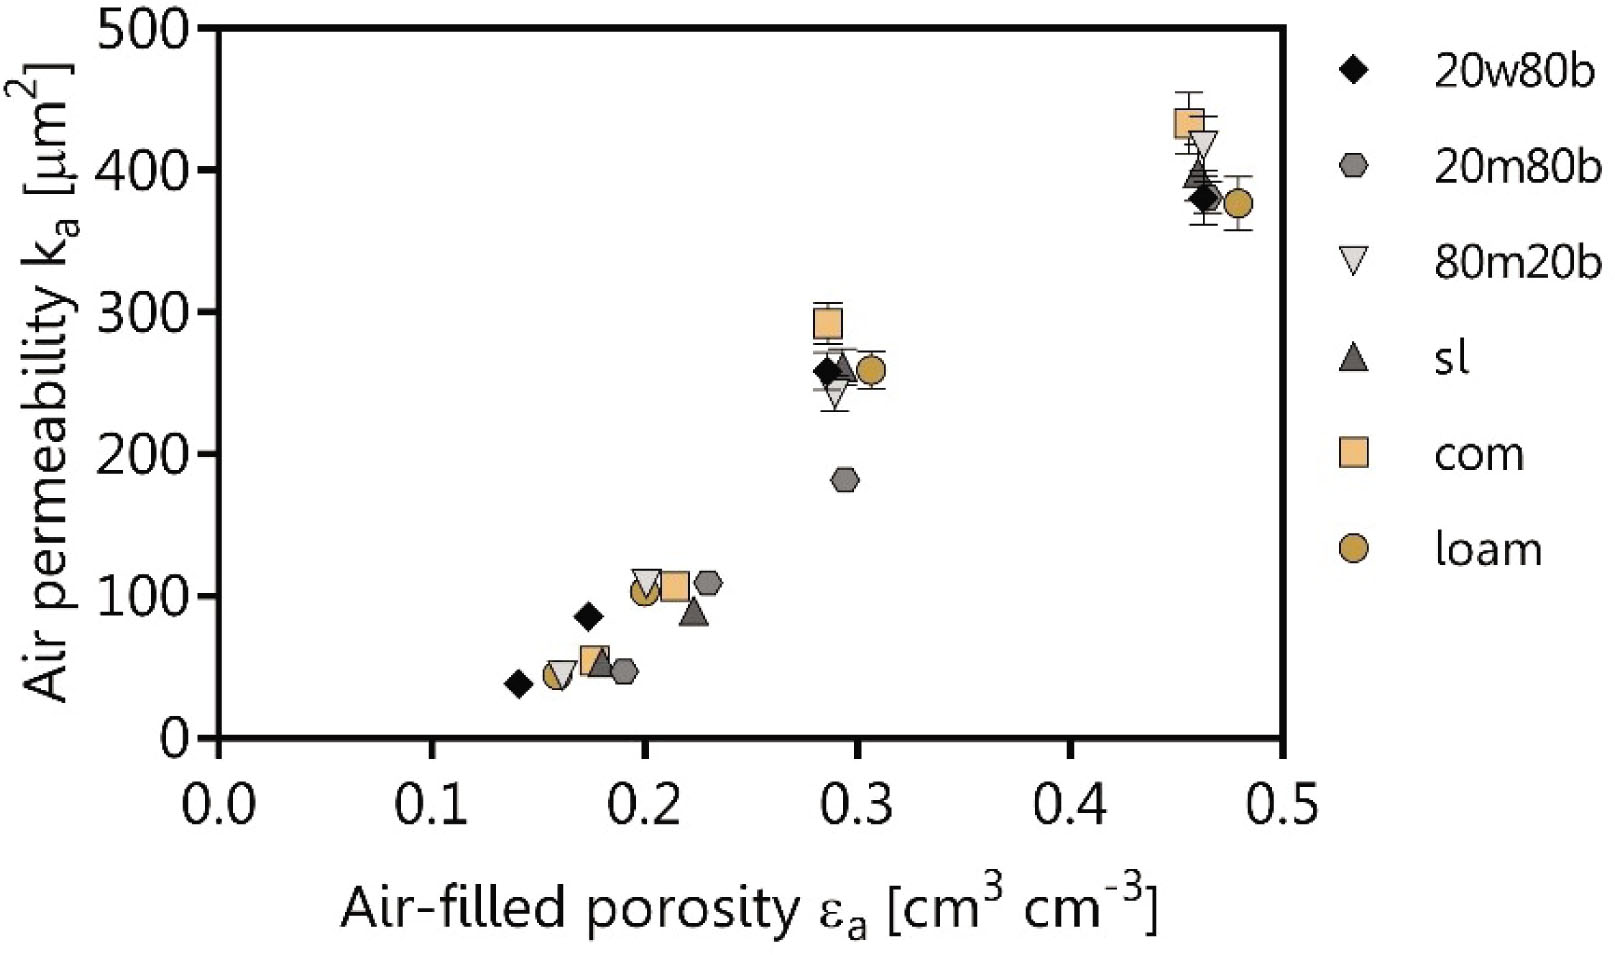
Figure 1
Air permeability, ka, obtained by Eq. 7 after the application of the organic residues for 8–10 soil cores each; abbreviations of residues are listed in Table 1.
Abbildung 1. Luftpermeabilität, ka, berechnet mit Gleichung 7 nach der Zuführung der organischen Rückstände für jeweils 8–10 Bodenproben; Abkürzungen sind in Tabelle 1 aufgeführt.
Table 4
Pore continuity indices c2 and c3 after the application of organic residues for 8–10 repeated measurements each at pressure heads, h, of −60, −300, and −15,000 hPa and in dry stage (105°C). Differences in mean values compared to loam were significant at p<0.05 (*), p<0.01 (**), p<0.001 (***), and p<0.0001 (****) for ANOVA. The symbol ± corresponds to the standard deviation, and r2 indicates the coefficient of determination; abbreviations of residues are listed in Table 1.
Tabelle 4. Porenkontinuitätsindizes c2 und c3 nach der Zuführung der organischen Rückstände für jeweils 8–10 Messwiederholungen bei Druckstufen, h, von −60 hPa, −300 hPa, −15000 hPa und im getrockneten Zustand (105°C). Abweichungen zum Mittelwert des Lehms sind bei der ANOVA signifikant bei p<0,05 (*), <0,01 (**), <0,001 (***), <0,0001 (****). Das Symbol ± entspricht der Standardabweichung und r2 dem Korrelationskoeffizienten; Abkürzungen sind in Tabelle 1 aufgeführt.
| Residue | c2 (μm2) | c3 (μm2) | ||||||
|---|---|---|---|---|---|---|---|---|
| −60 | −300 | −15,000 | dry105°C | −60 | −300 | −15,000 | dry105°C | |
| (hPa) | (hPa) | (hPa) | (hPa) | (hPa) | (hPa) | (hPa) | (hPa) | |
| Loam | 341 | 533 | 953 | 904 | 2.147 | 2.667 | 3.110 | 1.888 |
| com | 214**** | 398*** | 903 | 835 | 1.215**** | 1.860**** | 3.155 | 1.831 |
| sl | 244**** | 485 | 828* | 907 | 1.357**** | 2.176** | 2.823 | 1.972 |
| 80m20b | 290** | 544 | 628**** | 823 | 1.799** | 2.712 | 2.168**** | 1.781 |
| 20m80b | 279** | 390*** | 888 | 857 | 1.468**** | 1.697**** | 3.018 | 1.843 |
| 20w80b | 315 | 592 | 906 | 814 | 2.237 | 3.412*** | 3.168 | 1.759 |
[i] dry105°C = −1,000,000 hPa.
Table 5
Model parameter, LogM, N, and blocked air-filled pore space, εb, after the application of organic residues for 8–10 repeated measurements each at pressure heads, h, of −60, −300, and −15,000 hPa and in dry stage (105°C). Differences in mean values compared to loam were significant at p<0.05 (*), p<0.01 (**), p<0.001 (***), and p<0.0001 (****) for ANOVA. The symbol ± corresponds to the standard deviation, and r2 indicates the coefficient of determination; abbreviations of residues are listed in Table 1.
Tabelle 5. Modellparameter, Log M, N and blockiertes Porenvolumen, εb, nach der Zuführung der organischen Rückstände für jeweils 8–10 Messwiederholungen bei Druckstufen, h, von −60 hPa, −300 hPa, −15000 hPa und im getrockneten Zustand (105°C). Abweichungen zum Mittelwert des Lehms sind bei der ANOVA signifikant bei p<0,05 (*), <0,01 (**), <0,001 (***), <0,0001 (****). Das Symbol ± entspricht der Standardabweichung und r2 dem Korrelationskoeffizienten; Abkürzungen sind in Tabelle 1 aufgeführt.
| Residue | LogM | N | εb | r2 |
|---|---|---|---|---|
| (−) | (−) | (cm3 cm−3) | (−) | |
| Loam | 121 | 1.200 | 0.0079 | 0.96 |
| com | 158*** | 1.231 | 0.0074 | 0.99 |
| sl | 180**** | 1.328 | 0.0073 | 0.98 |
| 80m20b | 121 | 1.081 | 0.0077 | 0.99 |
| 20m80b | 175**** | 1.276 | 0.0072 | 0.97 |
| 20w80b | 75**** | 1.017* | 0.0084 | 0.98 |