
Table 1
Response surface methodology for the functional properties of GF buckwheat breads with addition of AX and POx
Tabelle 1. Response Surface Methode der funktionellen Eigenschaften von GF Buchweizenbroten mit Zugabe von AX und POx
| (AX | POx | Firmness | Relative elasticity | Specific volume | Pore diameter | Gas cell area |
|---|---|---|---|---|---|---|
| [%] | [nkat/g flour])1 | [N] | [%] | [cm3/g bread] | [mm] | [%] |
| 0 | 0 | 9.61 ± 1.78 | 64.27 ± 0.71 | 1.80 ± 0.18 | 2.99 ± 0.90 | 38.71 ± 3.94 |
| 3 | 0 | 7.20 ± 1.39 | 62.39 ± 0.85 | 1.93 ± 0.08 | 3.07 ± 0.85 | 41.02 ± 1.06 |
| 6 | 0 | 6.29 ± 0.76 | 55.54 ± 1.21 | 1.82 ± 0.06 | 4.74 ± 0.20 | 41.32 ± 3.59 |
| 0 | 1 | 4.19 ± 0.23 | 66.06 ± 0.57 | 1.75 ± 0.07 | 3.86 ± 0.41 | 41.10 ± 1.23 |
| 0 | 2 | 5.92 ± 1.47 | 63.73 ± 1.17 | 1.84 ± 0.16 | 3.76 ± 0.31 | 39.60 ± 2.96 |
| 32 | 1 | 4.69 ± 1.49 | 62.20 ± 0.96 | 1.93 ± 0.09 | 3.55 ± 0.46 | 42.35 ± 2.22 |
| 3 | 2 | 6.64 ± 1.15 | 59.67 ± 0.71 | 1.94 ± 0.09 | 2.24 ± 0.39 | 37.44 ± 1.94 |
| 6 | 1 | 6.80 ± 0.10 | 62.60 ± 0.65 | 1.97 ± 0.08 | 2.04 ± 0.15 | 37.44 ± 1.94 |
| 6 | 2 | 7.10 ± 0.43 | 50.46 ± 0.04 | 1.76 ± 0.00 | 5.00 ± 0.66 | 43.42 ± 0.48 |
| Analyses of variance3 | p-Value | p-Value | p-Value | p-Value | p-Value | |
| A: Arabinoxylan | 0.728 | 0.003 | 0.943 | 0.7550 | 0.7920 | |
| B: Pyranose-2 oxidase | 0.281 | 0.358 | 0.371 | 0.8392 | 0.8708 | |
| AA | 0.402 | 0.248 | 0.019 | 0.6755 | 0.5771 | |
| AB | 0.111 | 0.346 | 0.097 | 0.8993 | 0.7918 | |
| BB | 0.056 | 0.176 | 0.349 | 0.6947 | 0.8962 | |
| R2 [%] | R2 [%] | R2 [%] | R2 [%] | R2 [%] | ||
| 73.83 | 87.81 | 76.90 | 11.92 | 11.25 | ||
| Predicted optimized | Predicted optimized | Predicted optimized | Predicted optimized | Predicted optimized | ||
| Factors | factors | factors | factors | factors | factors | |
| AX | 1.92 | 0.00 | 2.24 | 6.00 | 3.27 | |
| POx | 1.27 | 1.05 | 2.00 | 2.00 | 0.67 | |
[i] 1 The values indicate the amount of ingredients; Arabinoxylan (AX) is expressed as % additionally added to the total amount of buckwheat flour
2 The central point (3% AX and 1 nkat POx/g flour) was analysed in triplicates
3 AA = The quadratic factor of AX; BB = The quadratic factor of POx; AB = The interaction effect of AX and POx
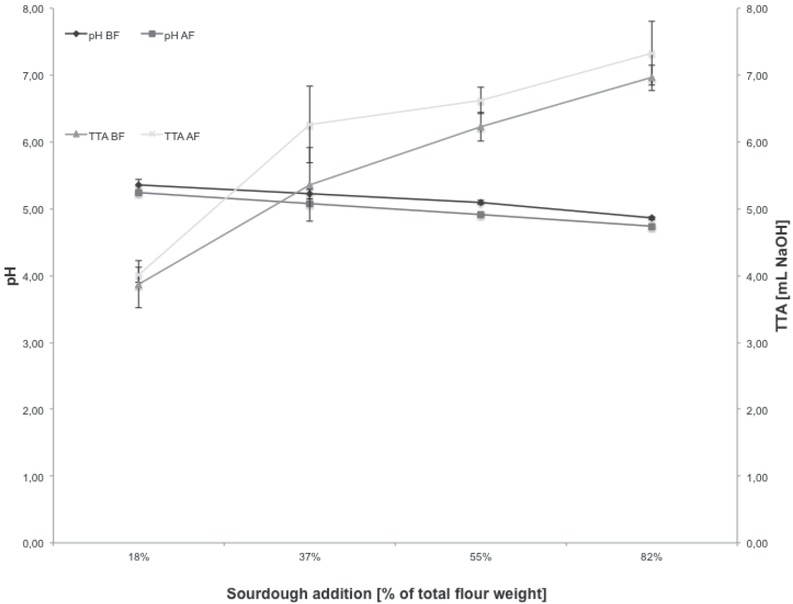
Figure 1
Influence of sourdough on batter acidification, measured by pH and titratable acidity (TTA) before (BF) and after fermentation (AF)
Abbildung 1. Einfluss von Sauerteig auf die Säuerung des Teiges, gemessen anhand des pH und der titrierbaren Säure (TTA) vor (BF) und nach der Fermentierung (AF)
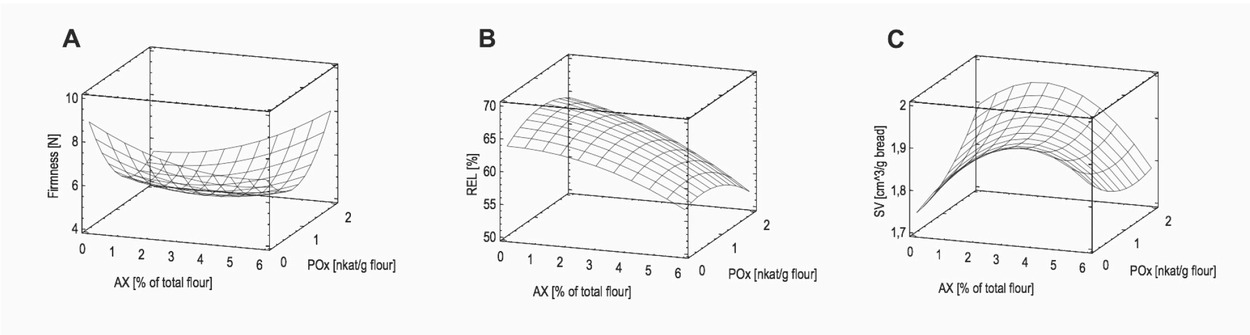
Figure 2
Response surface plots of wholemeal buckwheat breads added with AX and POx of A: firmness; B: relative elasticity (REL) and C: specific volume (SV).
Abbildung 2. „ Response surface plots“ der Vollkorn-Buchweizenbrote mit Zugabe von AX und POx A: Krumenfestigkeit; B: relative Elastizität (REL) und C: spezifisches Volumen (SV)
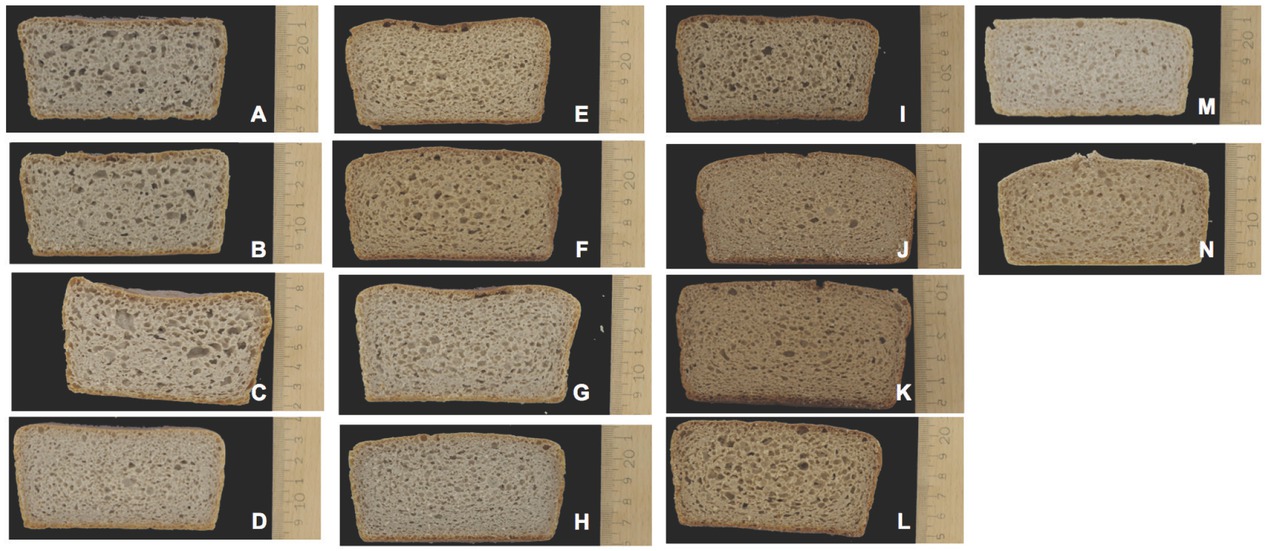
Figure 3
Bread slices of buckwheat breads added with A: 18% sourdough; B: 36% sourdough; C: 54% sourdough; D: 82% sourdough and control for optimization; E: 3% AX; F: 6% AX; G: 1 nkat POx/g flour; H: 2 nkat POx/g flour; I: 3% AX and 1 nkat POx/g flour; J: 3% AX and 2 nkat POx/g flour; K: 6% AX and 1 nkat POx/g flour; L: 6% AX and 2 nkat POx/g flour; M: control with refined flour; N: 3% AX and 1 nkat POx with refined flour
Abbildung 3. Visuelle Darstellung der Krume von allen gebackenen Buchweizenrezepturen mit A: 18% Sauerteig; B: 36% Sauerteig; C: 54% Sauerteig; D: 82% Sauerteig und Kontrolle für Optimierung; E: 3% AX; F: 6% AX; G: 1 nkat POx/g Mehl; H: 2 nkat POx/g Mehl; I: 3% AX und 1 nkat POx/g Mehl; J: 3% AX und 2 nkat POx/g Mehl; K: 6% AX und 1 nkat POx/g Mehl; L: 6% AX und 2 nkat POx/g Mehl; M: Kontrolle mit Auszugsmehl; N: 3% AX und 1 nkat POx/g Mehl mit Auszugsmehl
Table 2
Response surface methodology for the functional properties of GF buckwheat breads with addition of AX and POx
Tabelle 2. Response Surface Methode der funktionellen Eigenschaften von GF Buchweizenbroten mit Zugabe von AX und POx
| SD | Firmness | Relative elasticity | Specific volume |
|---|---|---|---|
| [%]2 | [N]1 | [%]1,3 | [cm3/g bread]1,3 |
| 18 | 14.08 ±1.38c | 68.08 ± 0.12b | 1.82 ± 0.05 |
| 36 | 12.46 ±0.63bc | 67.81 ± 0.61b | 1.77 ± 0.02 |
| 54 | 10.82 ±2.14b | 65.65 ± 0.78a | 1.80 ± 0.10 |
| 82 | 9.61 ±1.78a | 64.27 ± 0.71ab | 1.80 ± 0.18 |
| p-Value | 0.000 | 0.007 | 0.768 |
[i] 1Mean value ± standard deviation. Different lower case letters in the same column indicate significant differences (p ≤ 0.05)
2% of total flour weight;
3Non-parametric data. The statistical analysis of these data was done with the Kruskal-Wallis ANOVA and the Games-Howell test
Table 3
Comparison of functional properties of buckwheat bread with wholemeal and refined flour
Tabelle 3. Vergleich der funktionellen Eigenschaften von Buchweizenbrot mit Vollkorn- und Auszugsmehl
| Flours | AX | POx | Firmness | REL | Specific volume | Colour of crumb4 | Pore diameter | Gas cell area | ||
|---|---|---|---|---|---|---|---|---|---|---|
| [%]2 | [nkat/g flour] | [N]1,4 | [%]1,3,4 | [cm3/g bread]1,4 | L* | a* | b* | [mm]1,4 | [%]1 | |
| Wholemeal | 0 | 0 | 9.61 ± 1.78b | 64.27 ± 0.71c | 1.80 ± 0.18 | 55.42 ± 0.39c | 8.32 ± 0.24a | 16.55 ± 0.45a | 2.99 ± 0.90 | 38.71 ± 3.94a |
| Wholemeal | 3 | 1 | 4.69 ± 1.49a | 62.20 ± 0.96b | 1.93 ± 0.09 | 52.43 ± 1.00b | 9.56 ± 0.43b | 19.63 ± 1.53b | 3.55 ± 0.46 | 42.35 ± 2.22b |
| Refined | 0 | 0 | 10.53 ± 0.94b | 63.56 ± 1.33bc | 1.88 ± 0.01 | 64.35 ± 1.14d | 7.27 ± 0.58a | 16.18 ± 0.94a | 3.62 ± 0.60 | 39.69 ± 1.15a |
| Refined | 3 | 1 | 11.01 ± 0.94b | 55.28 ± 3.91a | 1.91 ± 0.05 | 51.13 ± 0.44a | 9.64 ± 0.25b | 21.33 ± 0.50b | 2.97 ± 0.22 | 40.53 ± 1.09ab |
| p-Value | 0.001 | 0.000 | 0.102 | 0.000 | 0.000 | 0.000 | 0.175 | 0.004 |
[i] 1 Mean value ± standard deviation. Different lower case letters in the same column indicate significant differences (p≤0.05).
2 Arabinoxylan (AX) is expressed as % additionally added to the total amount of buckwheat flour
3 REL, relative elasticity
4 Non-parametric data. The statistical analysis of these data was done with the Kruskal-Wallis ANOVA and the Games-Howell test.