
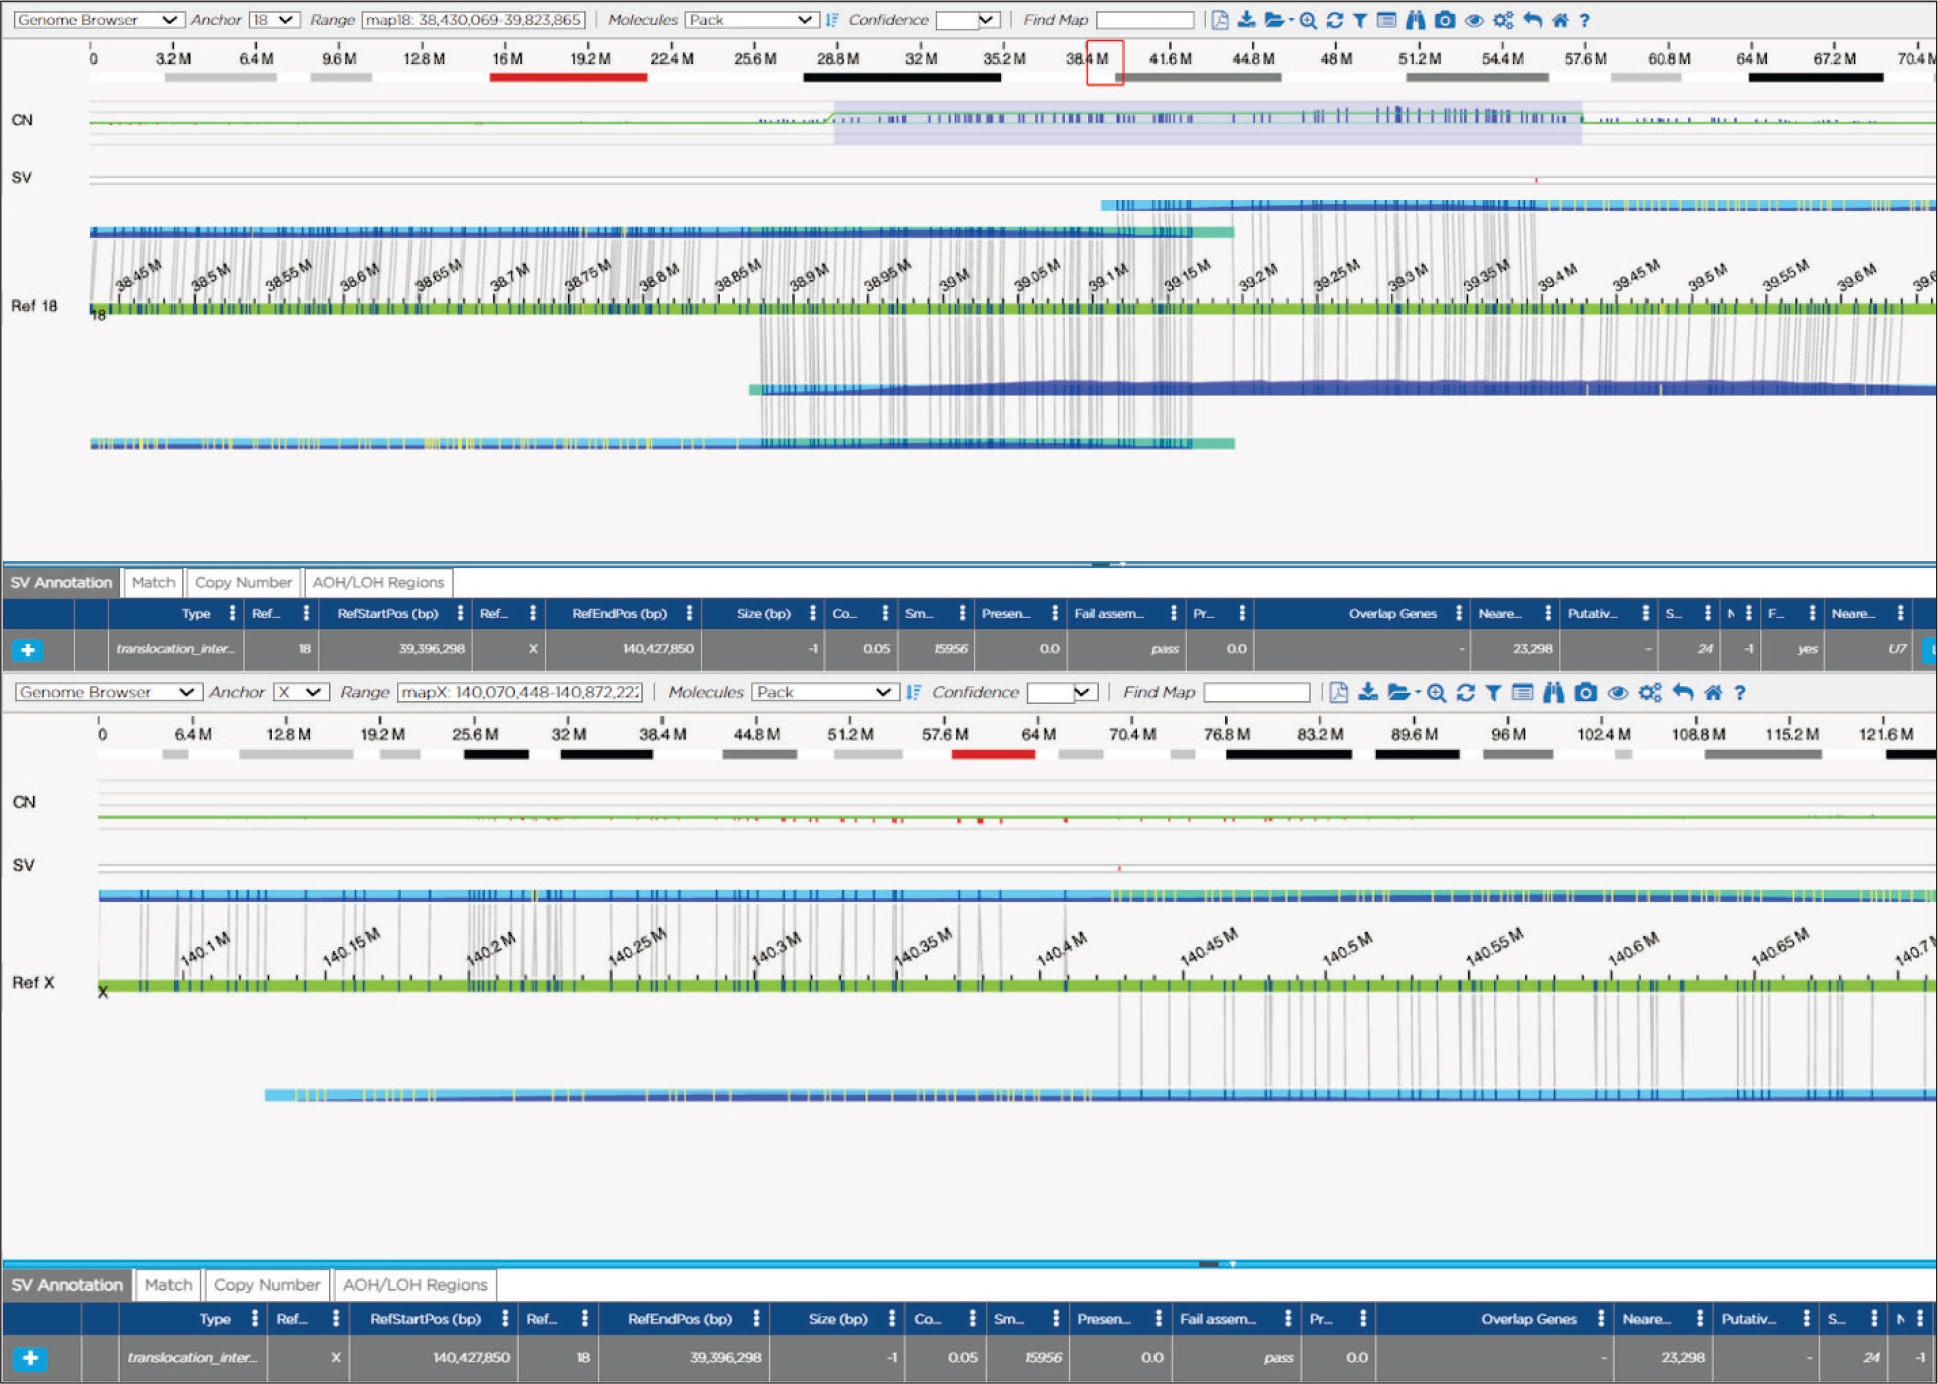
Figure 1.
Optical genome mapping results showing molecules involved in the translocation mapping to chromosome 18 and chromosome X.
Table 1.
Clinical characteristics of the probands
| Clinical characteristics | Proband 1 | Proband 2 | Onset |
|---|---|---|---|
| Age at first visit | 11 yr. & 11 mo. | 3yr. & 6 mo. | |
| Early development | Hyperactivity | Normal | |
| Teratoma regio sacro-coccigealis | + | + | Neonatal |
| Hydronephrosis / *RVU | + (right side) | + (left side) | Neonatal |
| Thrombocytopenia | + | + | Neonatal |
| Purpura, petechiae, bruises | + | + | Infancy |
| Premaxillary prominence | + | + | Toddler |
| Juvenile palmoplantar dermatosis | + | + | Toddler |
| Obesitas | + | + | Toddler |
| Hypo-imunoglobulinaemia | + | 10 yr. | |
| Ameloblastoma mandibulae | + | 10 yr. | |
| Intellectual disability, mild | + | 6 – 7 yr. | |
| Epilepsia | + | 14 yr. | |
| Cerebral dysmyelination (MRI) | + | 17 yr. | |
| Frontoparietal polymicrogyria (MRI) | + | 17 yr. |
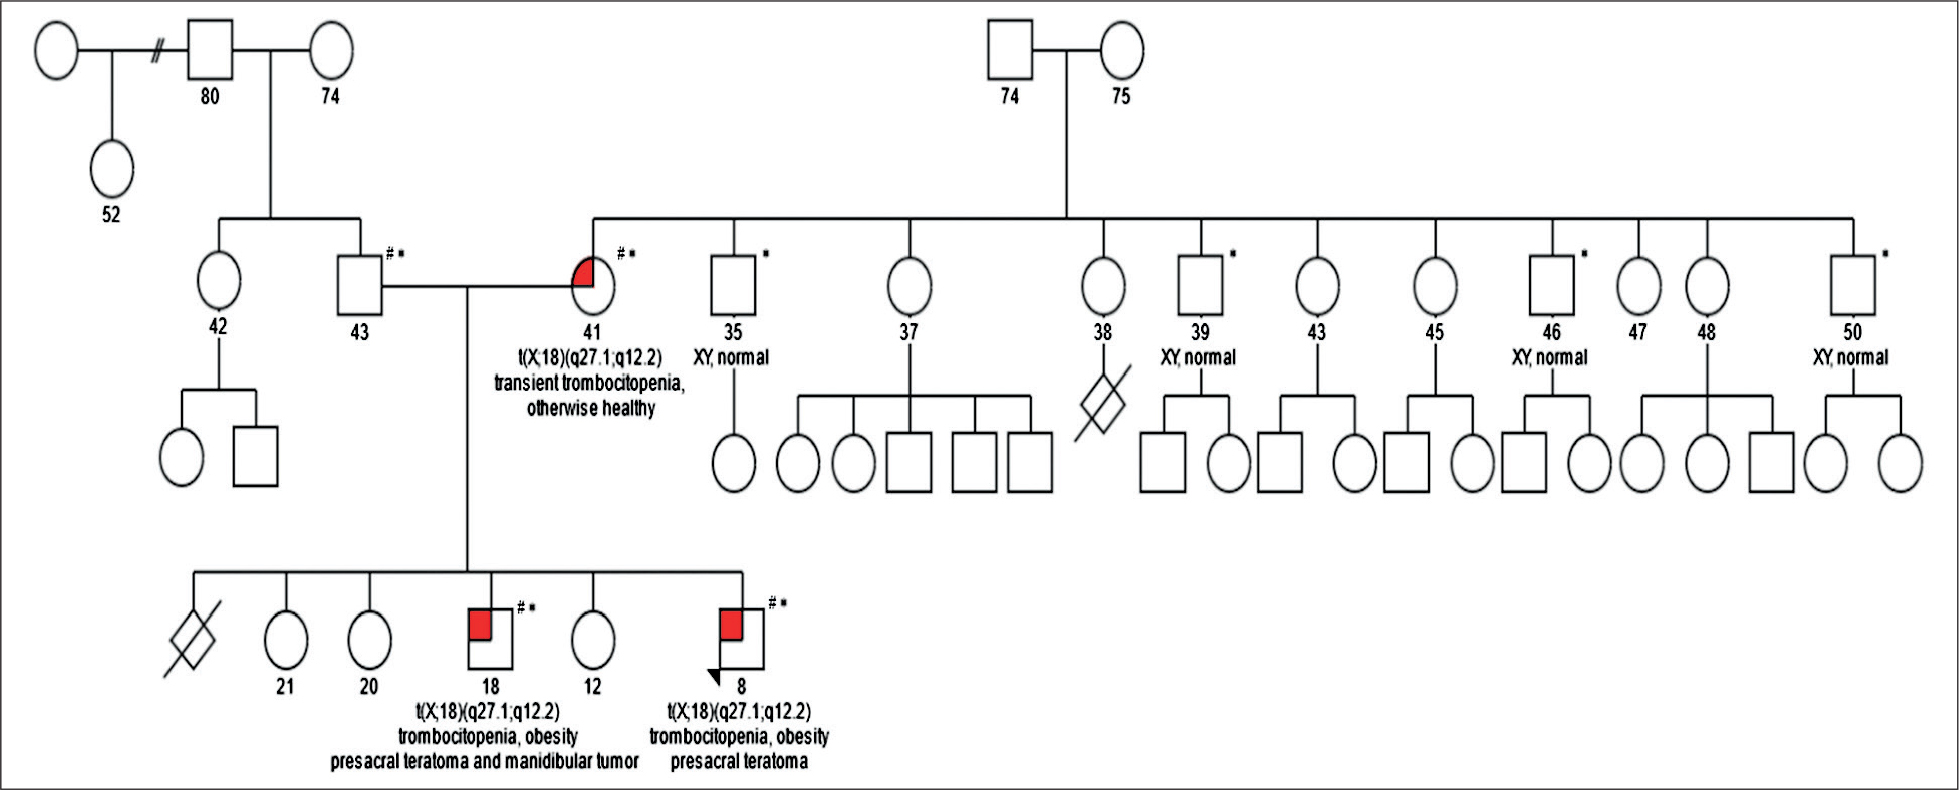
Figure 2.
Family pedigree and segregation analysis results.
# family members in whom karyotyping, microarray and NGS were performed.
* family members in whom OGM was performed.