
Table 1
Demographics of the participants
| Measure | All | Male | Female |
|---|---|---|---|
| Sample Size | 48 | 13 | 35 |
| Age (yr) | 20.08 (2.24) | 20.07 (2.62) | 20.08 (2.13) |
| Height (cm) | 161.02 (8.87) | 171.23 (7.27) | 157.23 (5.95) |
| Weight (kg) | 56.20 (11.49) | 66.72 (12.67) | 52.30 (8.24) |
| BMI (kg/m2) | 21.56 (3.39) | 22.60 (2.96) | 21.18 (3.49) |
Values are shown as mean (SD). BMI: body mass index.
Source: Authors’ contribution.
Table 2
Mean values of physiological parameters
| Heart rate | |||||
|---|---|---|---|---|---|
| Time(min) | 1 | 3 | 5 | 7 | 10 |
| GR | 81.73 (14.10) | 83.25 (13.81) | 82.85 (12.26) | 82.43 (11.79) | 82.97 (12.36) |
| GREX | 102.85 (12.44) | 102.60 (13.85) | 103.70 (14.94) | 104.64 (15.63) | 104.92 (14.72) |
| PM | 79.82 (12.88) | 80.93 (11.04) | 81.14 (10.87) | 80.88 (11.08) | 80.82 (10.48) |
| PMEX | 100.76 (13.45) | 99.73 (13.02) | 101.63 (13.44) | 100.72 (13.01) | 102.07 (13.46) |
| RMSSD | |||||
|---|---|---|---|---|---|
| Time (min) | 1 | 3 | 5 | 7 | 10 |
| GR | 28.84 (20.66) | 27.85 (20.44) | 26.97 (17.85) | 27.49 (19.08) | 27.13 (18.25) |
| GREX | 12.45 (7.12) | 12.32 (7.88) | 12.26 (6.92) | 11.59 (6.61) | 11.77 (6.66) |
| PM | 31.78 (18.76) | 30.11 (18.75) | 29.46 (17.63) | 30.44 (17.73) | 29.06 (16.32) |
| PMEX | 16.38 (8.66) | 16.66 (9.51) | 15.54 (9.25) | 15.82 (9.28) | 14.65 (8.19) |
RMSSD: root mean square of successive differences.
Source: Authors’ contribution.
Source: Authors’ contribution.
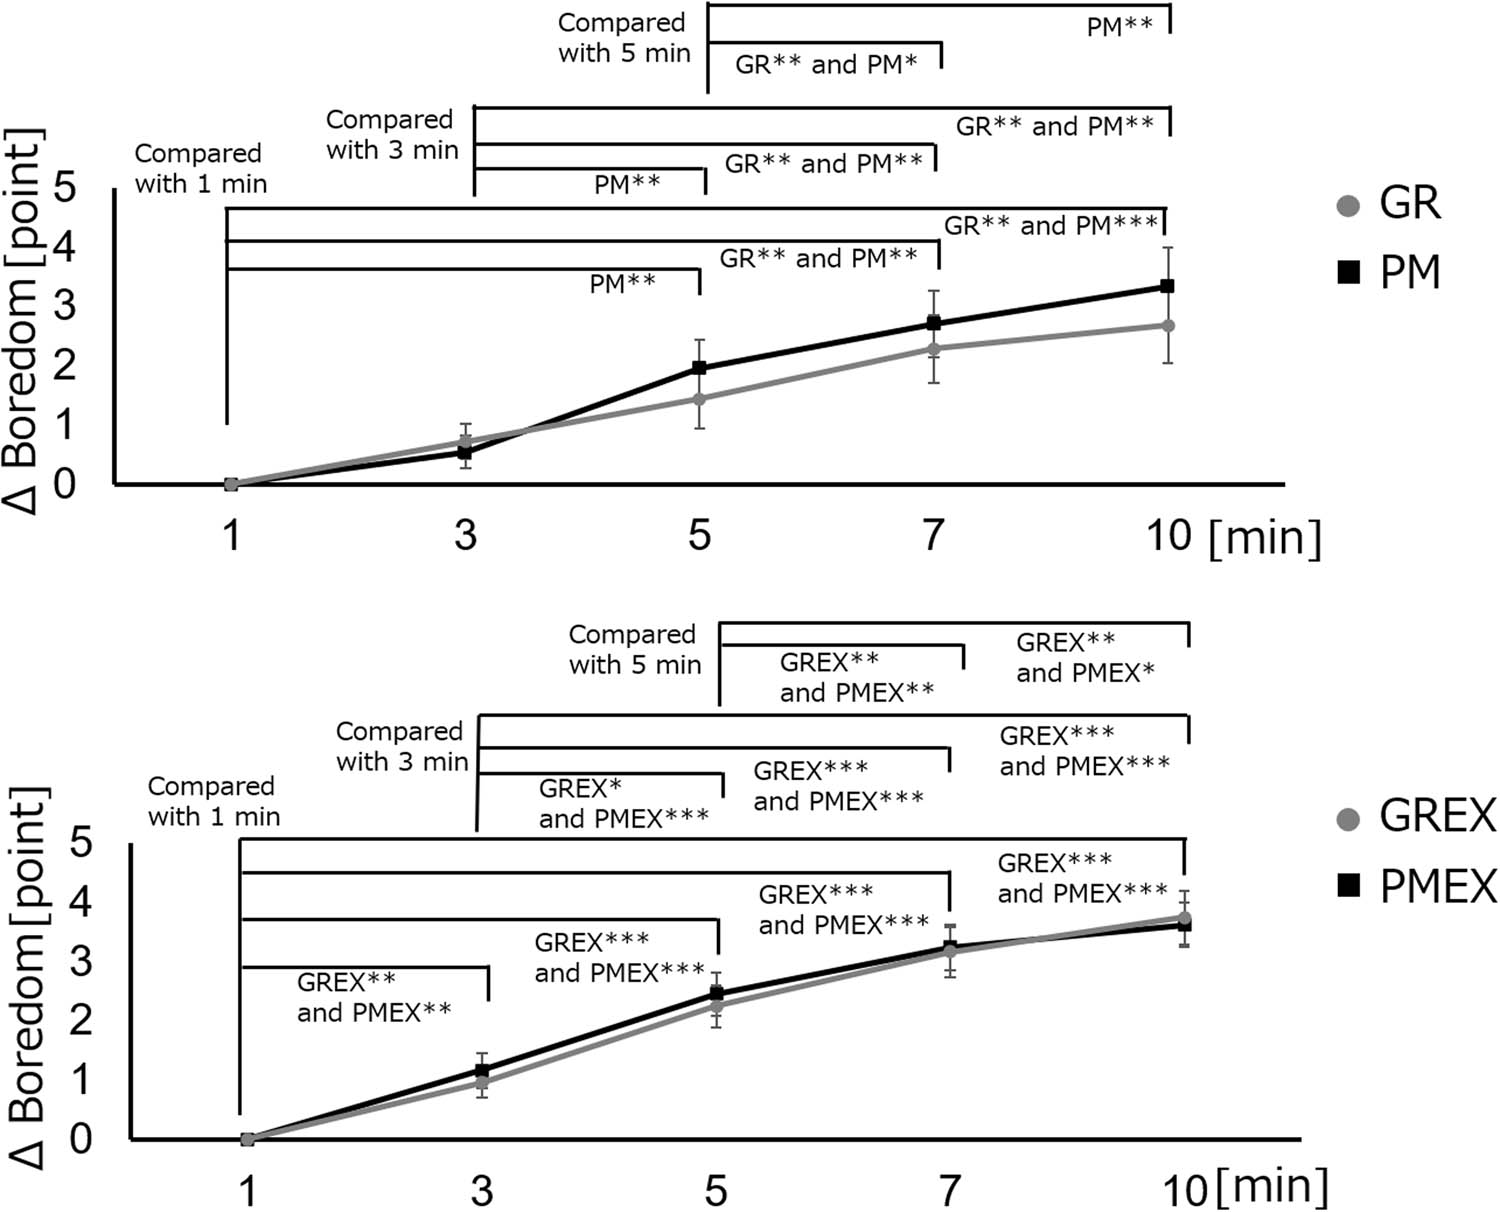
Figure 1
Changes in boredom during the intervention. Boredom increased significantly over the 10-min period across all conditions. In the exercise conditions (GREX and PMEX), increases in boredom were evident at the 3-min time point (GREX: p = 0.007; PMEX: p = 0.005). Data are presented as means ± SE. ***p < 0.001, **p < 0.01, *p < 0.05. Black lines: PM condition, PMEX condition; gray lines: GR condition, GREX condition
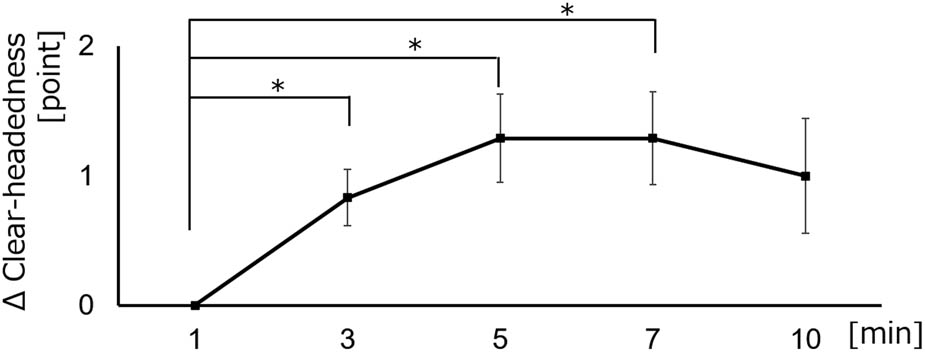
Figure 2
Changes in clear-headedness in the PMEX condition. Clear-headedness increased significantly beginning at the 3-min time point and remained elevated through 7 min (3 min: p = 0.01; 5 min: p = 0.01; 7 min: p = 0.02). Data are presented as means ± SE. ***p < 0.001, **p < 0.01, *p < 0.05
Source: Authors’ contribution.
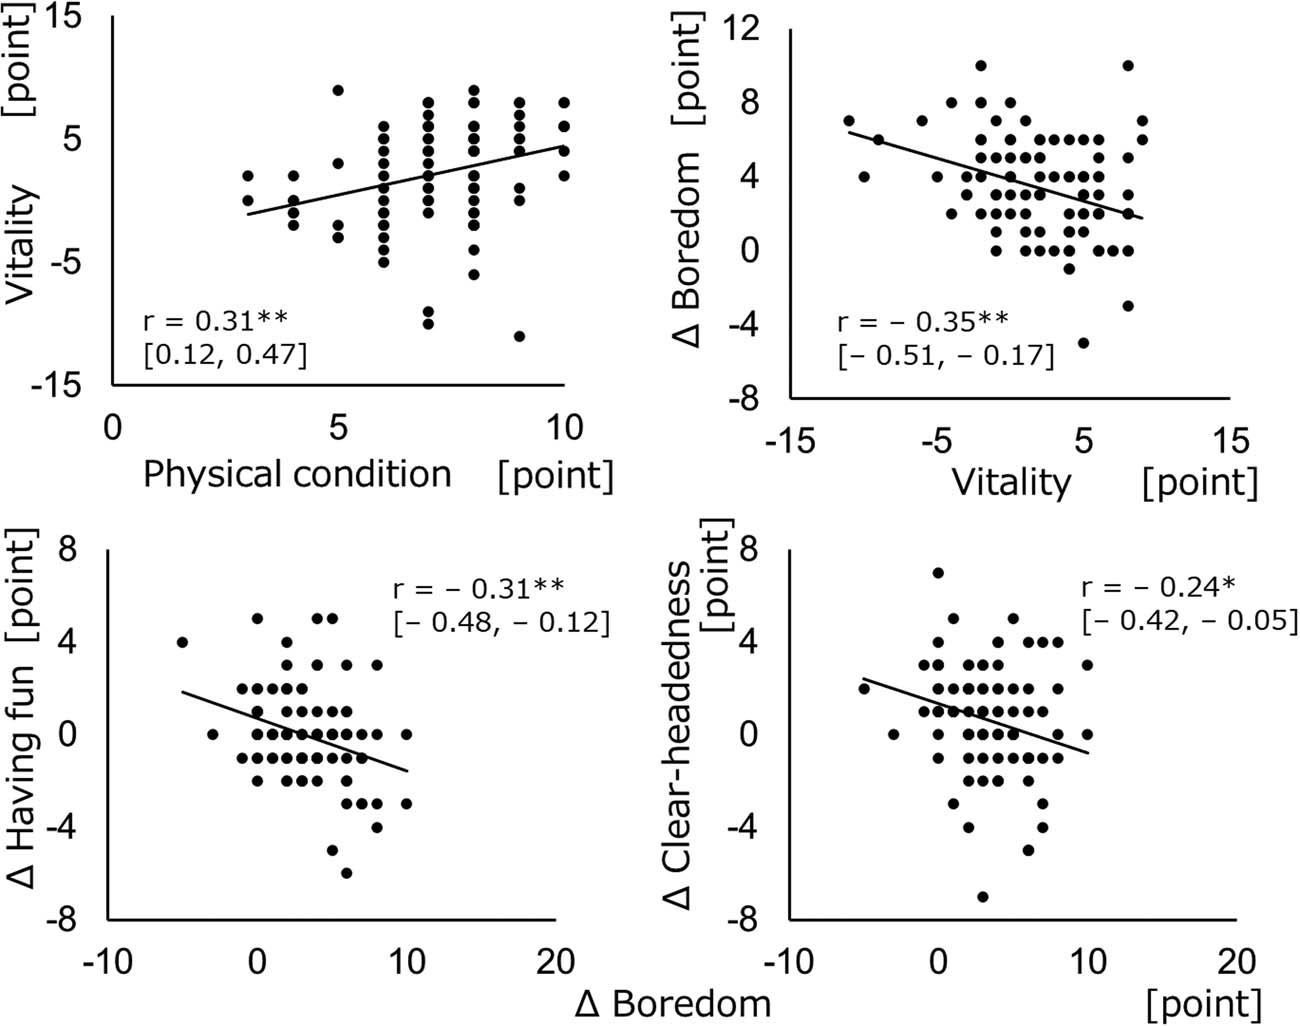
Figure 3
Correlations among baseline state, boredom, positive affect, and arousal. Baseline physical condition was significantly correlated with vitality mood (r = 0.31, p = 0.002). There was a significant negative correlation between vitality mood and Δboredom during exercise (r = −0.35, p < 0.001). As boredom during exercise increased, feelings of fun (r = −0.31, p = 0.001) and clear-headedness (r = −0.24, p = 0.01) decreased. ***p < 0.001, **p < 0.01, *p < 0.05. 95% confidence interval [lower, upper]
Source: Authors’ contribution.