
1. Introduction
The positive effects of additional physical activity on the human body are well established. However, physical activity levels among Polish adolescents aged 11–17 years remain below the thresholds recommended by the World Health Organization (WHO) (Guthold et al., 2020). The WHO advises that children and adolescents aged 5–17 years engage in at least 60 min of moderate-intensity aerobic activity daily, which supports healthy biological development (Bull et al., 2020).
Numerous studies have shown that swimming provides measurable benefits across physiological (e.g., improved fitness), psychological (e.g., increased self-confidence), and social (e.g., peer interaction) domains (Shoemaker et al., 2019; Silva et al., 2020). Compared with many other sports, swimming carries a lower risk of injury due to reduced joint loading in a horizontal aquatic environment (Morais et al., 2021). Because it engages large muscle groups while minimizing stress on the joints and spine, it is also widely used in rehabilitation, making it a highly recommended lifelong physical activity (Barker et al., 2014a). Its simultaneous involvement of multiple muscle groups contributes to the development of overall muscular strength (Belfry et al., 2016). In scientific research, the role of biological maturity in relation to body parameters is shown to be complex and sometimes contradictory, particularly in its associations with motor skills (Katzmarzyk et al., 1997).
Anaerobic power development in children is limited due to their lower body mass. Glycolytic efficiency improves only after puberty, at which point the ability to substantially elevate blood lactate levels during exercise emerges (Enríquez-del-Castillo et al., 2022; Kuberski et al., 2022; Tortu & Deliceoglu, 2024). Peak power output during short supramaximal efforts is significantly lower in children than in adults; at age 10, maximum power output reaches only about 30% of adult values (or ∼60% when normalized to body mass). As children grow, power output increases mainly through gains in muscle mass, particularly in the working limbs. Maximum power values continue to rise until puberty (Gaul et al., 1995). In girls, full development of phosphagen power occurs around age 16, while in boys it occurs around age 19. During this stage, sex differences in anaerobic performance become more pronounced, primarily due to greater muscle mass development in boys, mediated by growth hormone and superior neuromuscular coordination (Tonson et al., 2010). Anaerobic capacity is a key determinant of swimming performance (Duché et al., 1993). Yet, research comparing the anaerobic power of young swimmers with non-athletic peers has produced inconclusive findings. Some studies observed no significant differences between 11-year-old male swimmers and their non-swimming counterparts (Falgairette et al., 1993; Lehmann et al., 1981), while others reported higher anaerobic performance in 12-year-old swimmers of both sexes compared with untrained peers, suggesting a possible age threshold beyond which improvements become more evident. However, longitudinal evidence is still needed (Krivolapchuk, 2011). One indicator of increased aerobic capacity is a higher anaerobic threshold (Jaskólski & Jaskólska, 2006). Aerobic training reduces blood lactate concentration during submaximal exercise, raising the anaerobic threshold and allowing for more intense workloads without disproportionate lactate accumulation. While this phenomenon is well-documented in adults, findings in prepubertal children remain controversial.
Motor skill development depends on the proper structure and function of the musculoskeletal system and the regulatory influence of the nervous system. Key factors include the functional anatomy of bones, joints, muscles, spine, torso, and limbs. In addition, genetic predisposition and environmental influences (such as cognitive abilities, socioeconomic background, and parental education) play important roles (Hestbaek et al., 2017). The period between ages 9 and 12 is considered optimal for the development of motor abilities – particularly speed, agility, and power (Bolger et al., 2021). This stage, often described as a “period of motor harmony,” allows for enhanced coordination and movement accuracy. During puberty, muscular strength continues to develop, although a temporary decline in motor ability may occur; typically, high performance levels are restored between ages 13 and 15. At this stage, boys and girls begin to exhibit distinct movement patterns and motor profiles (Bossavit & Arnedillo-Sánchez, 2023).
Studies investigating the effects of additional physical activity on the motor development of young athletes, including swimmers, generally indicate positive outcomes, with improvements in endurance, strength, power, and flexibility (Lubans et al., 2010). However, most existing evidence comes from cross-sectional designs that group children involved in different sports. A notable 1.5-year longitudinal study of 9–10-year-old girls engaged in regular swimming reported no significant differences between swimmers and controls in power, speed, or endurance, though swimmers showed greater strength, agility, and flexibility. Other studies similarly observed gains in strength, agility, and endurance among child swimmers but found no differences in speed compared with controls (Arsoniadis et al., 2024; Sokołowski et al., 2023). Furthermore, research indicates that swimming enhances abdominal muscle strength, which is critical for effective lower-limb propulsion, dive starts, and flip turns (Tsalis et al., 2012). However, because participants in many of these studies were pre-selected for competitive swimming, the findings may be biased; it remains uncertain to what extent observed improvements result from structured training versus natural developmental trajectories.
Although the available literature highlights the potential benefits of swimming for physical development in children, there is no clear consensus regarding its specific effects on motor abilities and anaerobic capacity in prepubescent individuals (Kuberski et al., 2024). Therefore, this study aimed to evaluate the impact of a three-year swimming training program on selected motor abilities and anaerobic performance in girls, compared with peers who only participated in compulsory physical education classes. The training undertaken by the swimmers was assumed to be predominantly aerobic in nature.
This study sought to address two research questions: (1) Does 3 years of aerobic swimming training improve anaerobic capacity in prepubescent girls?; (2) Are there measurable differences in selected motor abilities between swimmers and controls after the training period?
Accordingly, two hypotheses were proposed: (1) aerobic swimming training enhances anaerobic performance in prepubescent girls; (2) after 3 years of training, swimmers will demonstrate superior performance in motor ability tests compared with controls.
Confirmation of these hypotheses would suggest that long-term aerobic swimming training effectively supports both anaerobic capacity and motor ability development in prepubescent girls. Such findings would reinforce swimming as a safe, comprehensive form of physical activity suitable for school curricula and youth sports programs, while also providing a foundation for later specialization in endurance sports. Moreover, the results may help optimize training protocols and address gaps in current scientific knowledge.
2. Materials and methods
2.1. Participants
The experimental group comprised 14 female swimmers (baseline mean biological age: 10.52 ± 0.37; mean body mass: 34.99 ± 2.77 kg; mean height: 146.00 ± 3.05 cm) training in School Sports Clubs located in Częstochowa, Poland. Inclusion criteria were as follows: age of 10 years at study entry, initiation of formal swimming training within a student sports club during the study year, medical certification confirming no contraindications for swimming (approved by the bioethics committee), and written informed consent from legal guardians. Although the participants began structured training at the start of the study, all already possessed basic swimming skills acquired through twice-weekly swimming lessons conducted before enrollment. According to the Participant Classification Framework proposed by McKay et al. (2022), this group was classified as Tier 2: Trained/Developmental.
The control group comprised 14 girls (baseline mean biological age: 10.74 ± 0.62 years; mean body mass: 37.93 ± 6.02 kg; and mean height: 145.55 ± 3.88 cm) who participated only in compulsory school-based physical education classes. Importantly, beyond these lessons, they did not engage in any additional organized physical activity throughout the study.
Based on information provided by legal guardians, neither the swimmers nor the control participants participated in any sports training outside of the described activities. Furthermore, all girls from both groups remained in the pre-menarcheal stage across the six phases of the study.
2.2. Ethics
In accordance with the Declaration of Helsinki, all participants, in the presence of their legal guardian, were informed of the study’s purpose and procedures. They were also informed that they could withdraw from the study at any time without providing a reason. The participants’ guardians provided written consent for their child to participate in the study. The research protocol was approved by the Bioethics Committee for Scientific Research at the Jan Długosz University in Częstochowa (approval no. KB-2/2012).
2.3. Longitudinal study design
This research was an experimental longitudinal study. The study was conducted over three consecutive years, from autumn 2011 to spring 2014, with measurements taken every 6 months (Figure 1; Kuberski et al., 2025).

Figure 1
Study design diagram
Source: Author’s contribution.
The swimmers’ training macrocycle was developed in accordance with the British Swimming Federation guidelines for girls aged 9–12 years (Lang & Light, 2010).
Training was conducted four times per week in morning sessions (6:30–7:40 AM), each lasting 70 min, with an approximate aerobic-to-anaerobic ratio of 80:20. The average daily swimming distance progressed from ∼1,500 m in the first year, to ∼2,000 m in the second year, and ∼2,500 m in the third year.
Each session began with a 10-min land-based warm-up, followed by a 200–400-m in-water warm-up (front crawl or back crawl). The main training component (approximately 30 min) focused on perfecting technique in all strokes while developing endurance through structured sets (Table 1; Kuberski et al., 2025). Particular emphasis was placed on body alignment, efficiency of arm strokes and leg kicks, and maintaining correct stroke rhythm. Technical elements such as turns and underwater phases were also systematically refined. To support skill acquisition, swimmers used specialized equipment, including short and long fins, paddles, and resistance bands. Aerobic capacity was primarily trained through front crawl.
Table 1
Swimmers’ training macrocycle structured according to British Swimming Federation Guidelines (Girls, 9–12 years)
| Research time | Number of trainings | Training unit diagram | Average distance |
|---|---|---|---|
| 1 Year (35 weeks) | Four training sessions per week | Warm up: 200–300 m | 1,500 m in 1 training session |
| Main part: 5 × 50 m only arms | |||
| 5 × 50 m only legs | |||
| 5 × 50 m coordination arms/legs | |||
| Cool down: 200–300 m | |||
| 2 × 100 m full style | |||
| 2 Year (35 weeks) | Four training sessions per week | Warm up: 30–400 m | 2,000 m in 1 training session |
| 6 × 50 m only arms | |||
| 6 × 50 m only legs | |||
| 6 × 50m coordination arms/legs | |||
| 5 × 100 m full style | |||
| Cool down: 200–300 m | |||
| 3 Years (35 weeks) | Four training sessions per week | Warm up: 300–400 m | 2,500 m in 1 training session |
| 5 × 100 m only arms | |||
| 5 × 100 m only legs | |||
| 5 × 100 m coordination arms/legs | |||
| 4 × 100 m full style | |||
| Cool down: 200–300 m |
Source: Author’s contribution.
Sessions concluded with ∼7 min of land-based stretching, targeting the shoulder girdle and ankle joints to improve flexibility and mobility. Measurements were performed at six time points at six-month intervals, allowing for the assessment of longitudinal changes in motor performance over the three-year period.
2.4. Measurements
Body weight and height were measured in both groups using a scale and stadiometer (WPT 150.0; RadWag, Poland) with a measurement accuracy of 0.1 kg and 0.5 cm, respectively. The scale was CE (Conformité Européenne) certified and regularly calibrated by a specialized laboratory technician. Biological age was determined using the following formula (Przewęda, 1971):
where body mass age and body height age were estimated using Pirquet’s tables for females from the Lubusz region (Malinowski et al., 2005), and chronological age was calculated as the time between the date of birth and the date of measurement, according to Jopkiewicz & Suliga (1998).The following tests were performed in both the experimental and control groups:
2.4.1. Vertical jump (reach jump)
Participants stood sideways to a wall (right or left side, depending on hand dominance) and marked their maximal reach height with the arm extended vertically. The measurement was performed only manually without the use of a standard mat or contact platform. From a squat at approximately 90° knee flexion, they performed a maximal vertical jump using arm swing for momentum, marking the highest reach point. Knee flexion angle was monitored visually by the investigator based on a standard half-squat position, without the use of a goniometer. The test was performed three times barefoot, and the best result was recorded. Jump height (difference between standing reach and jump reach) was then used to calculate maximal anaerobic power (MPA), an indicator of anaerobic performance (Praagh, 2007):
where m is the body mass (kg), g is the gravitational acceleration (9.81 m/s²), and h is the jump height (m).2.4.2. Explosive lower limb strength (standing long jump)
Starting behind a marked take-off line, with feet parallel, participants bent their knees, swung their arms backward, and performed a maximal forward jump. The distance from the take-off line to the rear edge of the heel at landing was measured in centimeters (Wang et al., 2023).
2.4.3. Speed and coordination (sprint with knee clapping)
From a standing start, participants ran in place for 10 seconds, lifting the knees high and clapping the hands underneath each raised knee. The number of claps completed was recorded as the result.
2.4.4. Abdominal muscle strength (horizontal scissors)
From a supine position with arms alongside the torso, participants lifted both legs just above the ground and performed alternating horizontal leg movements (“scissors”) for as long as possible. The duration of performance, in seconds, was recorded.
The order of motor tests (reach jump, standing long jump, sprint with knee clapping, horizontal scissors) was randomized across participants. Only one test was performed per day, with a minimum interval of one day between consecutive tests. The tests were performed in closed conditions (gym).
2.5. Statistical analyses
Statistical analyses were conducted using Statistica 13 software (TIBCO Statistica™, Version 13, TIBCO Software Inc., USA). Descriptive statistics were calculated for all variables, and the Shapiro–Wilk test was used to assess the normality of distributions. As the results indicated deviations from a normal distribution, the Kruskal–Wallis test was applied to compare groups. The following note has been added to the Materials and Methods section: Due to multiple comparisons, a Bonferroni correction was applied to avoid type I error, and the level of statistical significance was set at p < 0.008. Effect sizes were computed to evaluate the magnitude of the observed differences. For the Kruskal–Wallis test, effect size was determined using eta-squared (η²). Effect size interpretation followed commonly accepted guidelines: η² = 0.01 indicates a small effect, η² = 0.06 a medium effect, and η² ≥ 0.14 a large effect (Cohen, 2013).
In order to assess the collinearity between predictor variables, VIF (Variance Inflation Factor) values were calculated for all analyzed motor parameters.
Specifically, prior to study initiation, we estimated the required sample size using G*Power 3.1.9.2 (Heinrich-Heine-Universität Düsseldorf, Niemcy) assuming a significance level of α = 0.05, power = 0.95, and effect size f = 0.6. This effect size was based on previously reported substantial differences between trained and untrained children in motor performance variables. However, it should be noted that this represents a relatively large and optimistic estimate. A more conservative effect size would require a larger sample size; therefore, the present study may be sufficiently powered to detect large effects, but underpowered for small-to-moderate effects. This analysis indicated that a minimum of 12 participants per group would be sufficient.
It should be noted that the dataset included repeated measurements from the same participants across six time points (14 participants × 2 groups × 6 measurements). Therefore, the assumption of independence required for the Kruskal–Wallis test was not fully met. The test was applied as an exploratory approach to assess overall group differences. More appropriate methods for repeated-measures designs, such as the Friedman test or mixed-effects models, should be considered in future studies.
3. Results
3.1. Descriptive statistics
See Table 2.
Table 2
Descriptive statistics of motor performance tests conducted in both groups
| Group | Variable | Median | Min | Max | Q1 | Q3 |
|---|---|---|---|---|---|---|
| Control | Biological age (year) | 12.29 | 9.86 | 16.44 | 11.41 | 13.45 |
| Reach jump (m) | 0.28 | 0.13 | 0.42 | 0.24 | 0.30 | |
| MPA (J) | 128.28 | 44.13 | 197.43 | 95.79 | 147.83 | |
| Run with claps test | 24.00 | 16.00 | 31.00 | 21.00 | 27.00 | |
| Standing long jump (cm) | 125 | 94 | 191 | 118 | 142 | |
| Horizontal scissors execution time (s) | 26.36 | 6.17 | 69.08 | 18.46 | 39.18 | |
| Swimmers | Biological age (year) | 11.70 | 9.98 | 16.37 | 11.06 | 12.70 |
| Reach jump (m) | 0.31 | 0.18 | 0.42 | 0.27 | 0.35 | |
| MPA (J) | 112.92 | 62.12 | 194.59 | 93.38 | 133.56 | |
| Run with claps test | 27.00 | 20.00 | 33.00 | 25.00 | 29.00 | |
| Standing long jump (m) | 1.59 | 1.16 | 1.89 | 1.45 | 1.68 | |
| Horizontal scissors execution time (s) | 51.84 | 8.89 | 142.02 | 37.16 | 65.95 |
Min – Minimum; Max – Maximum; Q1 – Lower quartile; Q3 – Upper quartile.
Source: Author’s contribution.
3.2. Group differences (Boxplot analysis)
Although measurements were collected at six time points over the three-year period, Figure 2 presents the results of the final measurement to highlight the cumulative effects of long-term training and facilitate clear between-group comparisons. Boxplot analysis revealed statistically significant differences between the control group and the swimmers in six aspects of motor performance (Figure 2). During the first measurement, the medians of the analyzed variables were relatively similar between the groups. After 3 years of training, differences were noted. In the case of biological age (Figure 2b), swimmers had a lower median compared to the control group, and this difference was not statistically significant (KW-H(1,168) = 4.742; p = 0.029), suggesting that physical activity may be associated with a lower biological age. For muscle power output (MPA) (Figure 2c), the control group showed a higher median; this difference was not statistically significant after Bonferroni correction (KW-H(1,168) = 4.15; p = 0.029)
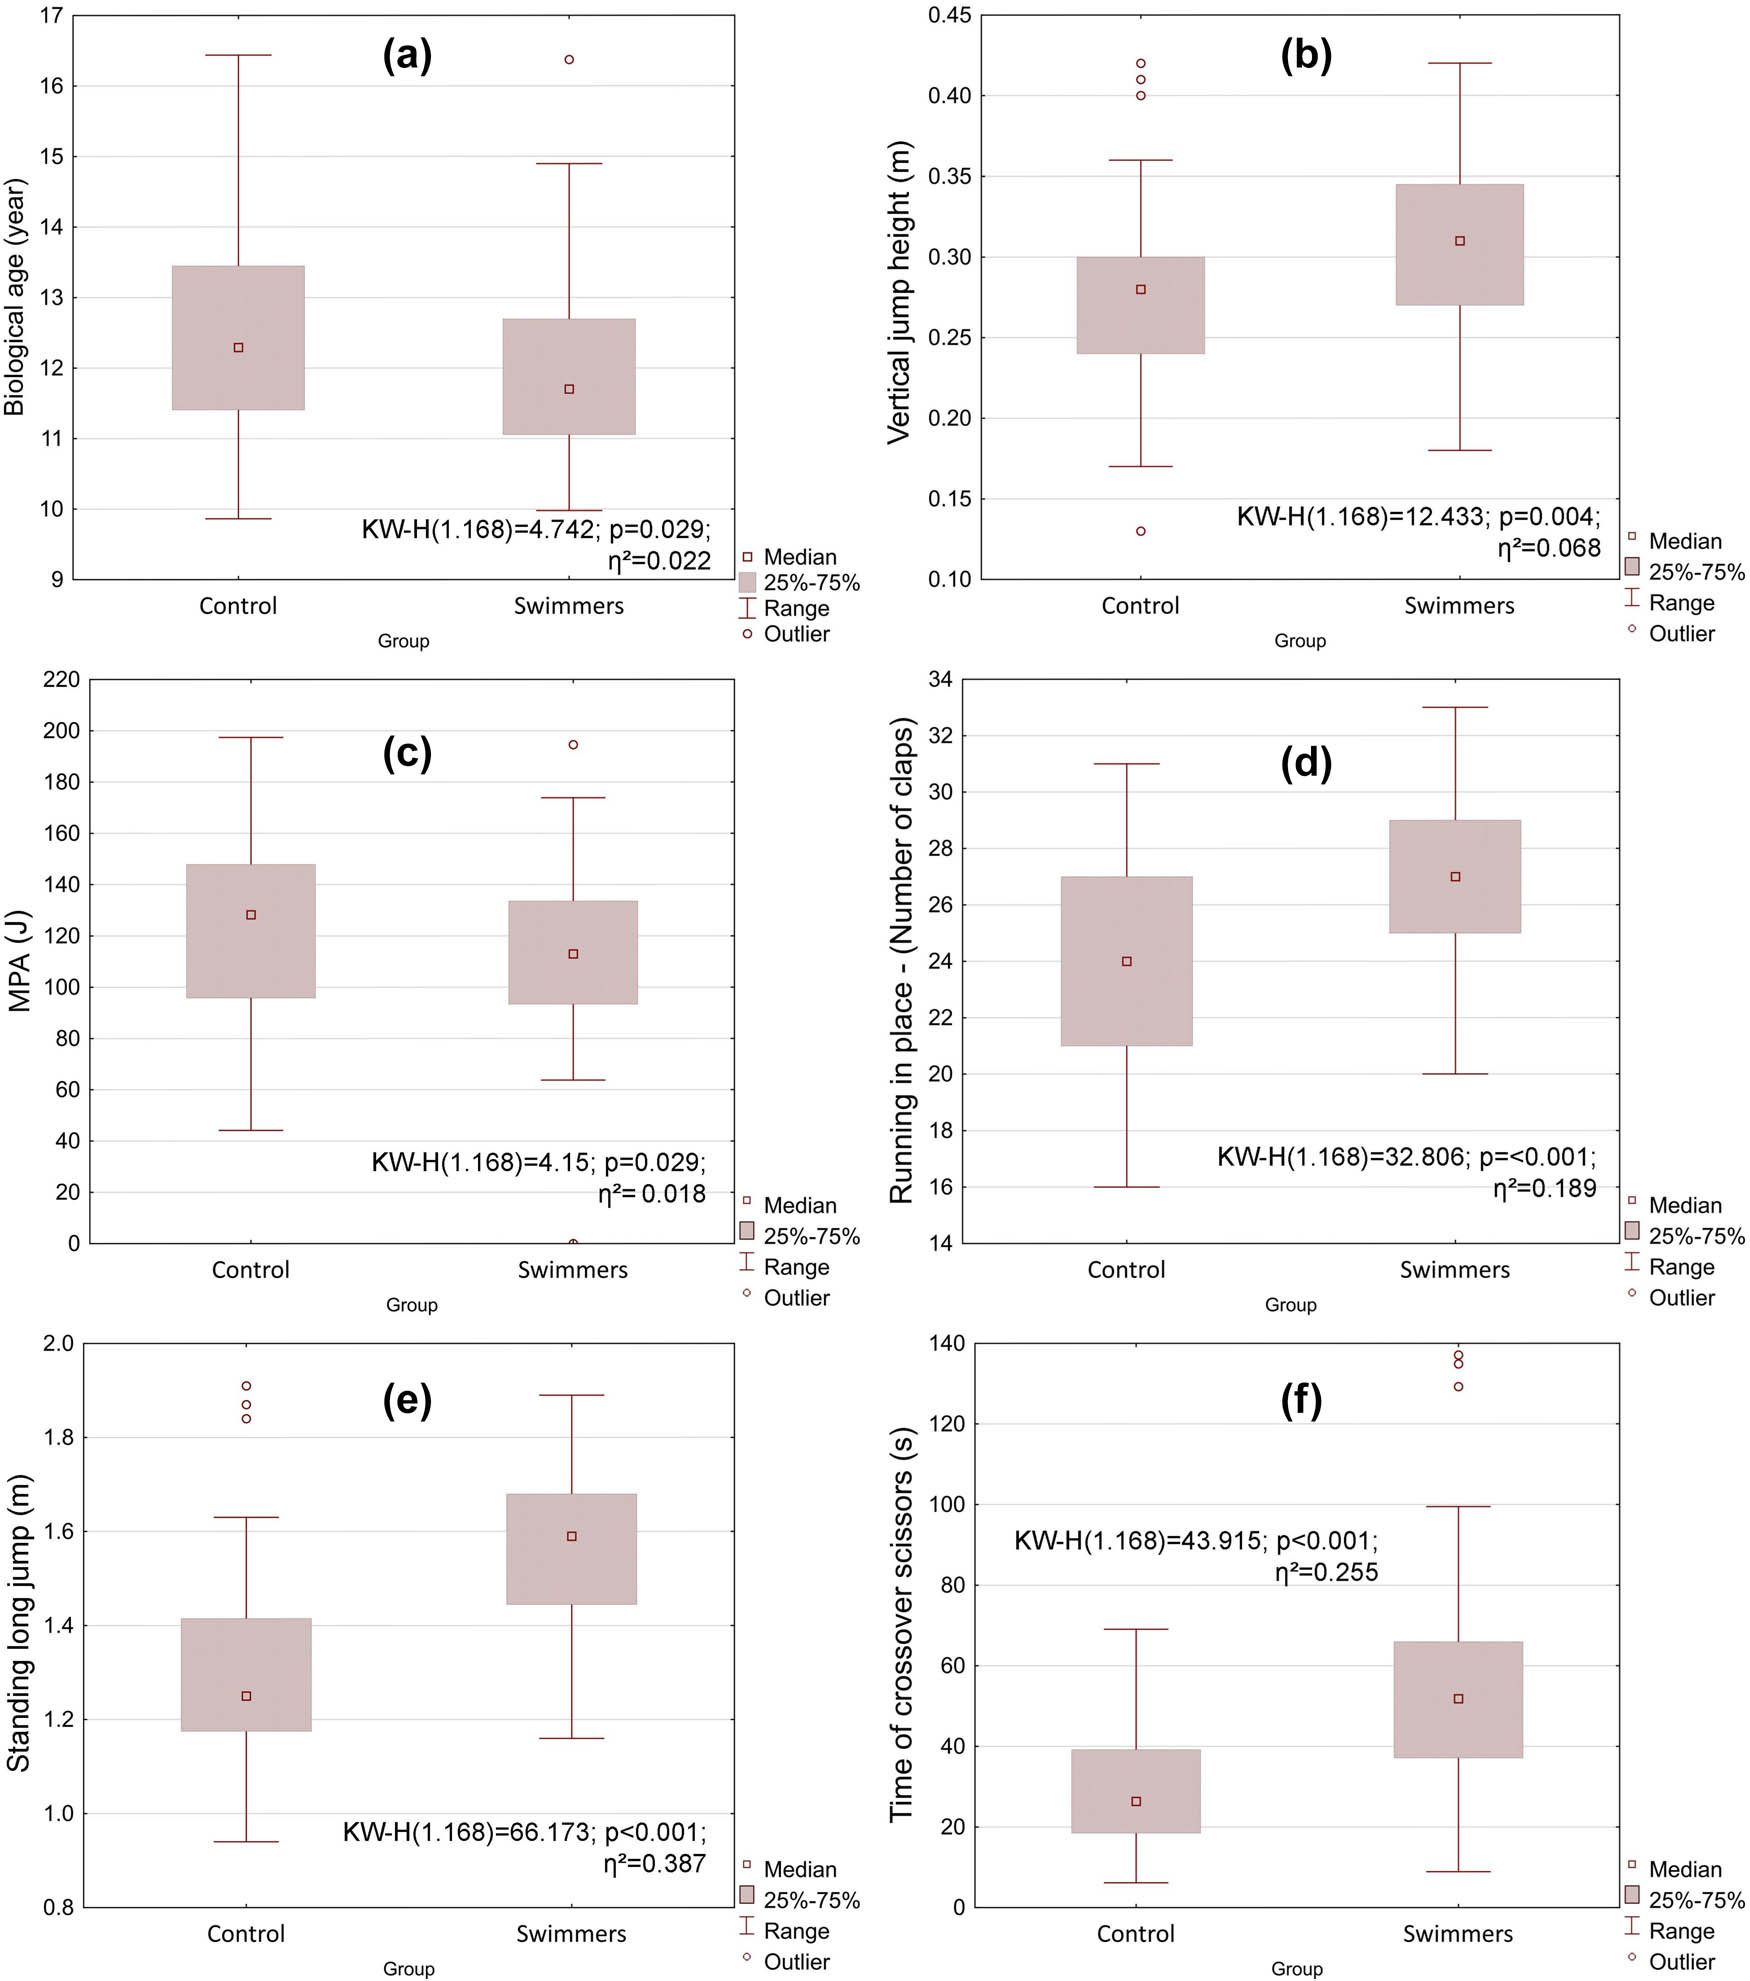
Figure 2
Changes in selected variables in the final measurements: (a) biological age (years); (b) vertical jump height (m); (c) Maximal anaerobic power (MPA) (J); (d) running in place with knee clapping (number of claps); (e) standing long jump (m); (f) duration of horizontal scissors (s)
Source: Author’s contribution.
For the reach jump (Figure 2b), swimmers achieved significantly better results than the control group, supported by a statistically significant difference (KW-H(1,168) = 12.433; p = 0.004), indicating higher explosive power.
In the clap test (Figure 2d), swimmers scored markedly higher, indicating better coordination and movement speed, with this difference being highly statistically significant (KW-H(1,168) = 32.806; p < 0.001). An even more pronounced difference was observed in the standing long jump test (Figure 2e), where swimmers significantly outperformed the control group. The Kruskal–Wallis test revealed a strong difference (KW-H(1,168) = 66.173; p < 0.001), highlighting explosiveness and dynamic movement. A similar trend was noted in the horizontal scissors execution time (Figure 2f), where swimmers achieved longer time work than the control group. This may indicate higher efficiency in this specific movement among swimmers, and the difference was also statistically significant (KW-H(1,168) = 43.915; p < 0.001). It should be emphasized that results with p-values above the Bonferroni-adjusted threshold (p < 0.008) were considered not statistically significant.
It should be noted that the presented boxplots summarize only the final measurement, while the study design was longitudinal. The analysis across successive time points was considered in the interpretation of results, although not visualized in a time-series format.
3.3. Multiple regression analysis
In this analysis, the measurement number (1–6) was treated as a proxy for time and training exposure, allowing the assessment of associations between motor performance variables and longitudinal progression. Variance Inflation Factor results indicate that the level of multicollinearity was low for most variables, confirming their simultaneous inclusion in multivariate models (Table 3.). The variable “Biological age (year)” demonstrated a moderate level of multicollinearity (VIF ≈ 6.88), suggesting partial dependence on other physical parameters, but not reaching a level that would indicate problematic information redundancy. All other variables, including “MPA (J),” “Running in place – number of claps,” “Standing long jump (m),” and “Time of crossover scissors (s),” had VIF values below 3, indicating their full independence and no risk of collinearity in regression analyses. In summary, VIF analysis confirmed that the key motor variables used in the regression models—specifically, “Running in place,” “Standing long jump,” “Time of crossover scissors,” and “MPA (J)” – were characterized by a lack of significant multicollinearity. This allowed their simultaneous inclusion in the predictive models without the risk of estimator variance inflation or distorting the interpretability of the results. The moderate VIF value for biological age suggests some overlap in physiological information, but not enough to require its exclusion.
Table 3
Results of variance inflation factor (VIF)
| Variable | VIF | Evaluation |
|---|---|---|
| Biological age | 6.88 | Moderate correlation |
| MPA | 2.20 | No correlation |
| Running in place | 1.82 | No correlation |
| Standing long jump | 2.17 | No correlation |
| Time of crossover scissors | 1.38 | No correlation |
Source: Author’s contribution.
Multiple regression analyses were performed separately for the control and swimmers groups, and then an interaction model was constructed to assess whether the relationships between motor test results and measurement number (measurement: 1–6) differed between groups (Table 4). In both group models, the dependent variable was measurement number, and the predictors were the result of the “Running in Place – Number of Claps” test, “Standing Long Jump (m),” and “Time of Crossover Scissors (s).”
Table 4
Regression models for Control and Swimmers
| Variable | Coefficient | p-value | CI low | CI high | R 2 | Adj R 2 |
|---|---|---|---|---|---|---|
| Control group | ||||||
| Running in place – (number of claps) | 0.190 | < 0.001 | 0.086 | 0.293 | 0.228 | 0.199 |
| Standing long jump (m) | −0.952 | 0.318 | −2.837 | 0.934 | 0.228 | 0.199 |
| Time of crossover scissors (s) | 0.037 | 0.004 | 0.012 | 0.062 | 0.228 | 0.199 |
| Swimmers group | ||||||
| Running in place – (number of claps) | 0.263 | <0.001 | 0.168 | 0.358 | 0.573 | 0.557 |
| Standing long jump (m) | 4.883 | <0.001 | 3.329 | 6.437 | 0.573 | 0.557 |
| Time of crossover scissors (s) | 0.004 | 0.352 | −0.005 | 0.013 | 0.573 | 0.557 |
Source: Author’s contribution.
In the control group, the regression model did not reach global significance. However, among the predictors, the “Running in Place” test score clearly stood out, proving to be a significant predictor of measurement number (p < 0.001). The remaining variables – “Standing long jump” and “Time of crossover scissors” – did not demonstrate a significant effect on measurement number in the control group.
In the swimmers group, two predictors were statistically significant: “Running in place – number of claps” (p < 0.001) and “Standing long jump” (p < 0.001).
To compare the nature of the relationships between groups, an interaction model was performed, including the Group × Predictor factors (Table 5). The results showed significant interactions for two predictors: “Standing long jump × Group” (p < 0.001) and “Time of crossover scissors × Group” (p < 0.01).
Table 5
Interaction Model (Group × Predictors)
| Variable | Coefficient | p-Value | CI Low | CI High | R² | Adj R² |
|---|---|---|---|---|---|---|
| Group_num | −10.651 | <0.001 | −14.982 | −6.320 | 0.401 | 0.374 |
| Running in place – (number of claps) | 0.190 | <0.001 | 0.099 | 0.280 | 0.401 | 0.374 |
| Group_num: Running in place (number of claps) | 0.073 | 0.316 | −0.071 | 0.217 | 0.401 | 0.374 |
| Standing long jump (m) | −0.952 | 0.256 | −2.600 | 0.697 | 0.401 | 0.374 |
| Group_num: Standing long jump (m) | 5.835 | <0.001 | 3.373 | 8.296 | 0.401 | 0.374 |
| Time of crossover scissors (s) | 0.037 | 0.001 | 0.015 | 0.059 | 0.401 | 0.374 |
| Group_num: Time of crossover scissors (s) | −0.033 | 0.008 | −0.057 | −0.009 | 0.401 | 0.374 |
Cl – Confidence Interval, R 2 – coefficient of determination (percentage of variance explained by the model), adj R 2 – adjusted coefficient of determination, ns – no significance.
Source: Author’s contribution.
4. Discussion
This study examined the effects of a three-year swimming training program on selected motor abilities and anaerobic performance in girls, in comparison with peers who participated only in compulsory physical education classes. Since the training regimen of the swimmers was predominantly aerobic in nature, it provided an opportunity to assess how long-term engagement in such activity influences both biological development and motor performance.
The findings demonstrated clear differences between swimmers and the control group, particularly with respect to biological age and several motor characteristics, suggesting that systematic swimming training may shape developmental trajectories beyond what is achieved through standard school-based physical education.
4.1. Biological age
The female swimmers were characterized by a lower biological age, which may indicate delayed puberty due to regular training. However, this should be considered with caution. In this study, the delayed biological age in the girls studied may be due to selection bias, as less mature girls may be more likely to continue swimming, and a measurement effect in the biological age formula. The cross-sectional nature of the study may also complicate cross-sectional inferences. In another study, the authors examined the relationship between bone mineral density and body composition, strength, type of athletic competition, vitamin D, and birth-related factors in elite Polish track and field athletes (Bałdyka & Kopiczko, 2024). The results of this study highlight the complexity of the interaction between puberty and training. Similar results have been reported previously, suggesting that long-term swimming training in girls promotes favorable anthropometric changes and slower biological maturation (Kuberski et al., 2024). According to scientific reports, the degree of biological maturity influences almost every aspect of a young athlete’s physical performance, including aerobic and anaerobic capacity, strength, and other physiological characteristics (Abbott et al., 2021). This study showed that despite the lack of preselection, the female swimmers had a lower biological age than the untrained group, suggesting that they should perform worse than individuals with higher biological maturity (Beunen & Malina, 2007). Therefore, it is particularly noteworthy that the girls in the swimming group achieved better results in tests such as the standing long jump, the clap run, and the long jump. Thus, girls who practiced swimming demonstrated better lower limb explosive strength, better motor coordination, and better jumping ability than their biologically older peers. The results regarding the effect of physical activity on biological age are not entirely clear. Wawrzyniak’s study showed that children who practiced swimming demonstrated a higher degree of biological maturity (Wawrzyniak, 2001) where the study included children enrolled in swimming lessons, while observations of girls aged 11–12 years revealed no significant differences in biological development between those who practiced swimming and those who did not (Barker et al., 2014b; Morais et al., 2024).
4.2. Explosive lower limb strength – standing long jump
In the present study, swimmers also performed better in explosive strength tests, indicating that swim training positively influences lower limb dynamic strength. Significant improvements were observed with each subsequent measurement in our study. Numerous studies have emphasized the beneficial impact of swimming training on enhancing lower limb strength; however, it is important to note that most of these investigations were conducted on elite adult swimmers or children engaged in multiple sports disciplines (Barbosa et al., 2019). Explosive strength is composed of both speed and muscular power. The work of the lower limbs and the hip girdle muscles represents a key driving force in swimming, making these muscle groups more stimulated for development in children who train in swimming (Sayers et al., 1999). A significant portion of training sessions is often devoted by coaches to leg work for front crawl and backstroke, which in turn promotes the development of the hip region and explosive strength in the lower limbs (Guignard et al., 2017). Additionally, improvements in explosive strength in young swimmers may be attributed to the push-off during turns and the start jump. During a turn, swimmers utilize the power of the lower limbs to push off the wall as effectively as possible. Similarly, in the start jump, explosive lower-limb strength plays a critical role, especially in sprint events (Kilduff et al., 2011). The findings of our study suggest that swim training in young swimmers has a positive impact on the explosive strength of the lower limbs. This is a factor that swimming instructors and coaches should be aware of, as continuously developing this attribute may contribute to improved performance during competitions. The observed improvement in explosive lower-limb strength among young swimmers may also be attributed to the greater involvement of anaerobic processes in short-duration, high-intensity swimming events (Bencke et al., 2002).
4.3. Maximal anaerobic power – reach jump
Interestingly, in terms of maximal anaerobic power, used in this study as an indicator of anaerobic capacity, the non-swimming group performed better. However, this should be approached with caution because power calculations are derived from the vertical jump, which is strongly influenced by the subjects’ body mass. Therefore, anaerobic capacity cannot be interpreted solely based on the effects of swimming training. Other studies have shown increased anaerobic capacity in trained swimmers compared to their untrained peers (Weber et al., 2006). However, it should be noted that these results were based on adult swimmers. Among younger swimmers, the research remains inconclusive. For example, in a study using the 30-second Wingate test to assess anaerobic capacity, no significant differences in anaerobic capacity were found between 11-year-old boys who trained in swimming and those in a control group (Falgairette et al., 1993). Another study in older girls showed significantly higher anaerobic capacity in 12-year-old swimmers compared to their untrained peers (Zacca et al., 2010). In our study, the better anaerobic capacity observed in the non-swimming group may be explained by the underdeveloped anaerobic energy system in children in this age group. In our study, maximal anaerobic power was estimated using the jump test. Although widely used, its validity as an indicator of anaerobic capacity remains controversial. Some studies suggest a direct relationship between vertical jump capacity and explosive speed, particularly in trained athletes (Bartosz et al., 2024). Therefore, the obtained results should be interpreted with caution, taking into account metabolic efficiency, as existing evidence indicates a low or even negligible correlation between power generated during jumping and muscle phosphagen content (Sayers et al., 1999).
4.4. Speed and coordination
Better performance by swimmers in the clap-in-place test indicates higher coordination efficiency and movement speed, both of which are intensively developed during swim training. Regression analysis showed that the swimmers’ test results significantly increased with each subsequent measurement. Silva et al. observed that young swimmers demonstrate good synchronization and movement rhythm. The authors of other studies suggest that the poorer results in the control group may be partially attributed to a higher proportion of children who are overweight or obese, which can significantly impair performance in tasks requiring speed and coordination (Boyer et al., 2013; Ružbarská, 2024). However, obesity was not addressed in this study. Scientific research indicates that motor coordination results from the interaction between organismic constraints, such as physical and psychological factors, task-specific demands, and environmental constraints such as lighting, temperature, or altitude (Bakalár et al., 2024). Therefore, achieving a desired movement goal requires ongoing management of these constraints (Rossi et al., 2024). According to the ecological dynamics framework, there is no universal “ideal” solution to movement coordination that all learners should pursue. Instead, functional coordination patterns emerge through self-organization (Tan et al., 2023). Variability in movement caused by the constant interaction of constraints leads to the development of more functional movement patterns. These patterns promote deeper exploration of movement, allowing athletes to discover more diverse and effective solutions tailored to the task dynamics (Cappellini et al., 2006). In swimming, particularly in front crawl, researchers have analyzed various constraints affecting coordination. These include variations in swimming speed and the use of equipment such as paddles, drag suits, and parachutes, all of which introduce varying degrees of resistance (Lehmann et al., 1981). However, most of these studies have been conducted on elite adult swimmers. It has been shown that age significantly affects physical capabilities and, consequently, performance outcomes, with only a slight increase in coordination observed after the onset of puberty. It remains difficult to determine the optimal age for coordination development, although it appears that the greatest potential exists until early adulthood (Fernandes et al., 2024). Among young swimmers, it has been observed that as stroke frequency increases, coordination may become unstable, only to be replaced by a more stable mode, potentially resulting in suboptimal technique for a given stroke or distance (Sanders et al., 2020). In our study, the superior coordination in swimmers compared to the control group may be attributable to the three-year swim training program implemented. The training protocol, as recommended by the British Swimming Federation, involved tasks limited to 100-meter distances, with most performed over 50 m. This may have allowed children to perform propulsion movements with greater precision and reduced the likelihood of adopting patterns that deviate from proper swimming technique. However, these assumptions should be made cautiously, as swimming technique was not directly assessed in our study. Nevertheless, we may reasonably infer that the complex movements involved in swimming, performed in an aquatic environment, likely enhance coordination, even in land-based motor tests.
It should be noted that using measurement number as a dependent variable is a non-standard approach and serves as a simplified representation of temporal progression. More advanced longitudinal modeling techniques (e.g., mixed-effects models) would provide a more robust analytical framework.
4.5. Abdominal muscle strength – horizontal scissors
In our study, the swimmers group performed better than the control group in the crossed scissors test. This test showed no correlation with the measurement number, suggesting greater stability of this skill in the swimmers group. This may be related to the specific movements of swimmers in the water, which strongly engage, among other things, the abdominal and back muscles. Therefore, it can be assumed that the swimming training used in this study contributed to improved abdominal muscle strength in the training girls. However, it should be noted that the test did not assess the core strength of the swimmers. Several authors emphasize the limited transferability of motor skills across different sports (Gourgoulis et al., 2009). Other researchers studying elite adult swimmers have emphasized the importance of abdominal muscle strength, particularly in the underwater butterfly stroke (Hsu et al., 2024). Elite swimmers devote significant time to training their hip and core muscles, both in the water and especially on land. However, in our study of young non-elite swimmers, abdominal muscle strength training was not performed on land. However, future research should examine abdominal muscle strength in young swimmers using tests that better reflect movement patterns in the water.
The anaerobic capacity hypothesis was not confirmed. Aerobic swimming training did not improve anaerobic capacity in 10- to 12-year-old girls. The motor skills hypothesis was confirmed. Swimming training improved lower limb explosive strength, speed and coordination, and abdominal muscle strength in prepubertal swimmers. Although the study was based on repeated measurements, the graphical presentation focused on the final time point in order to clearly demonstrate the overall effect of the three-year training intervention. While longitudinal visualizations could provide additional detail, the adopted approach was intended to maintain clarity and emphasize the primary outcome of the study.
5. Limitations
The small sample size may result in some limitations. Aerobic capacity was assessed using a running test rather than a swimming test due to the low swimming skills of the control group. Factors such as diet, motivation, socio-economic status, and environmental conditions, as well as coordination tests performed on land, were not taken into account in the participants. Pubertal control, determined by biological age calculations, may introduce some confounding effects. The authors did not use accelerometric methods, which could have improved the objectivity and repeatability of the measurements. Additionally, the a priori sample size calculation was based on a relatively large assumed effect size (f = 0.6), which may limit the ability to detect smaller effects. The use of statistical methods that assume independence of observations (Kruskal–Wallis test) despite repeated measurements may limit the accuracy of the inference. The lack of graphical presentation of longitudinal trajectories across all six measurement points may limit the detailed interpretation of temporal changes.
6. Conclusions
A three-year endurance-based swimming training program can significantly improve girls’ motor skills and may also influence the pace of biological maturation. At the same time, the results highlight the importance of tailoring motor assessment tools to the specific characteristics of the sport, as well as accounting for the influence of somatic features on children’s functional abilities. Further research in this area, encompassing a larger population and including factors such as swimmers’ diet, could provide deeper insights into changes in motor characteristics and help identify which aspects should be prioritized by swimming coaches and instructors when designing training programs. It should also be emphasized that it is necessary to use reference values specific to the age of maturity in the tests of children’s performance.
Funding information
Authors state no funding involved.
Author contributions
Conceptualization; methodology; software A.M; validation, J.W. formal analysis, A.M.; investigation, M.K.; resources, M.B. data curation, A.M.; writing – original draft preparation, M.K.; writing – review and editing, J.W., M.B.; visualization, A.M.; supervision, J.W.; project administration, M.K.; funding acquisition, J.W.
Conflict of interest statement
The authors declare no conflicts of interest.