
Table 1
Participants’ baseline data, grouped by sequence
| CON-PLA-CAFF treatment order | CON-CAFF-PLA treatment order | |
|---|---|---|
| Regular CAFF consumption from foodstuffs | 0.25 ± 0.31 mg/kg/day | 0.20 ± 0.35 mg/kg/day |
| Regular CAFF consumption as an ergogenic aid | 0.00 ± 0.00 mg/kg/day | 0.00 ± 0.00 mg/kg/day |
| Sex | Male = 4 (57.14%) | Male = 7 (100%) |
| Female = 3 (42.86%) | Female = 0 (0%) | |
| Body mass | 62.31 ± 6.33 kg | 75.53 ± 8.06 kg |
| Body fat | 22.26 ± 8.88 % | 19.59 ± 4.34 % |
| Height | 1.69 ± 0.07 m | 1.76 ± 0.06 m |
| Age | 22.14 ± 3.08 years | 22.00 ± 3.32 years |
| Sport modality | Badminton = 1 (14.29%) | Basketball = 2 (28.57%) |
| Cycling = 2 (28.57%) | Football = 2 (28.57%) | |
| Running = 3 (42.86%) | Rink hockey = 1 (14.29%) | |
| Tennis = 1 (14.29%) | Running = 1 (14.29%) | |
| Triathlon = 1 (14.29%) |
Sex is presented in terms of its frequency and percentage, while the remaining variables are expressed as their mean values and standard deviations. The sport modality total percentage may slightly exceed 100% due to rounding. mg = Milligrams. kg = Kilograms. m = Meters
Source: Author’s contribution.
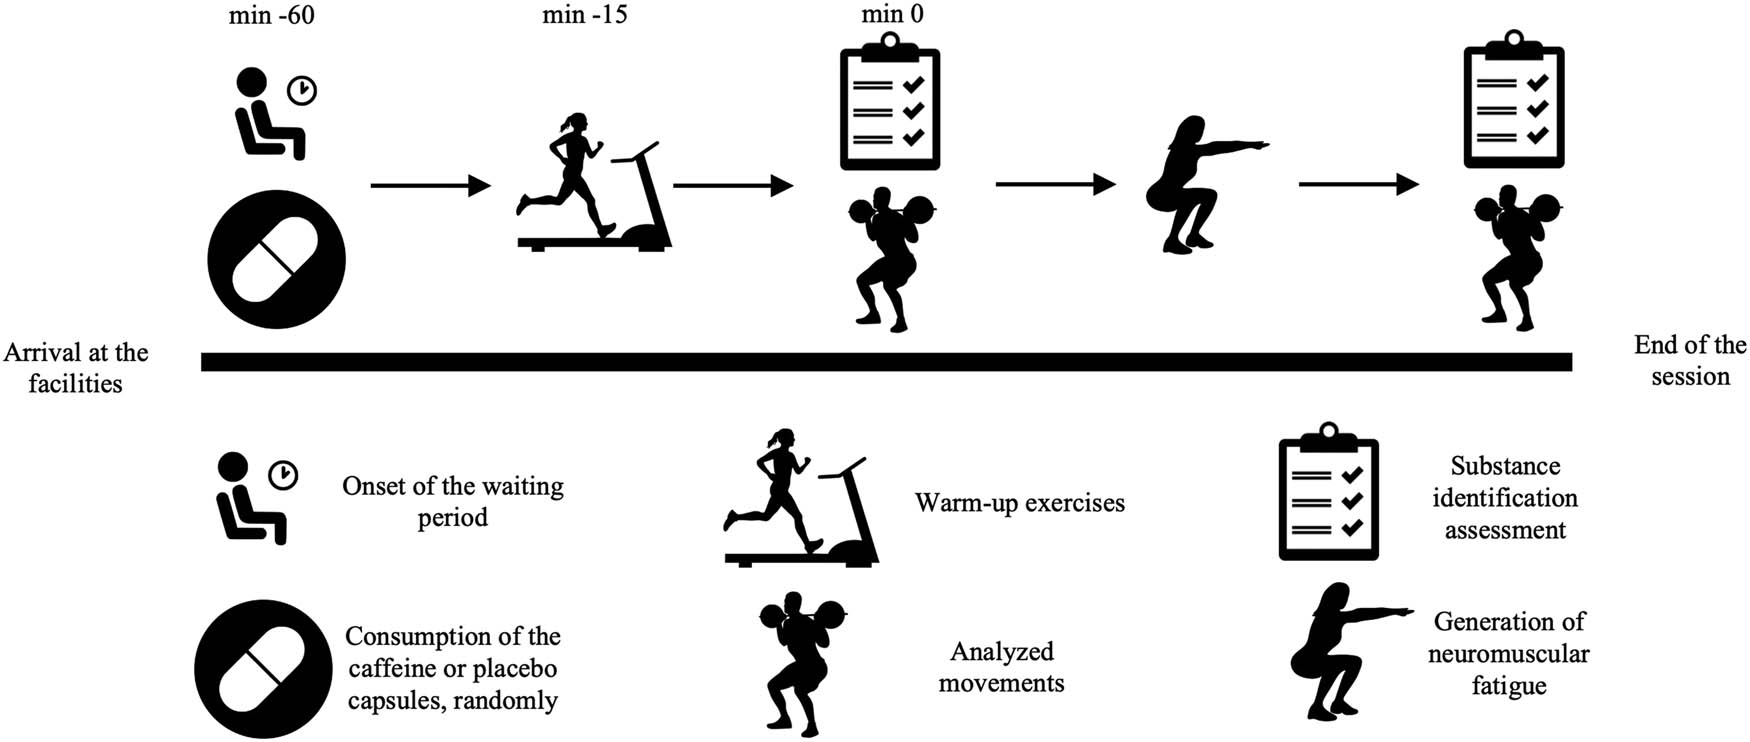
Figure 1
Organization of the assessed sessions
Source: Author’s contribution.
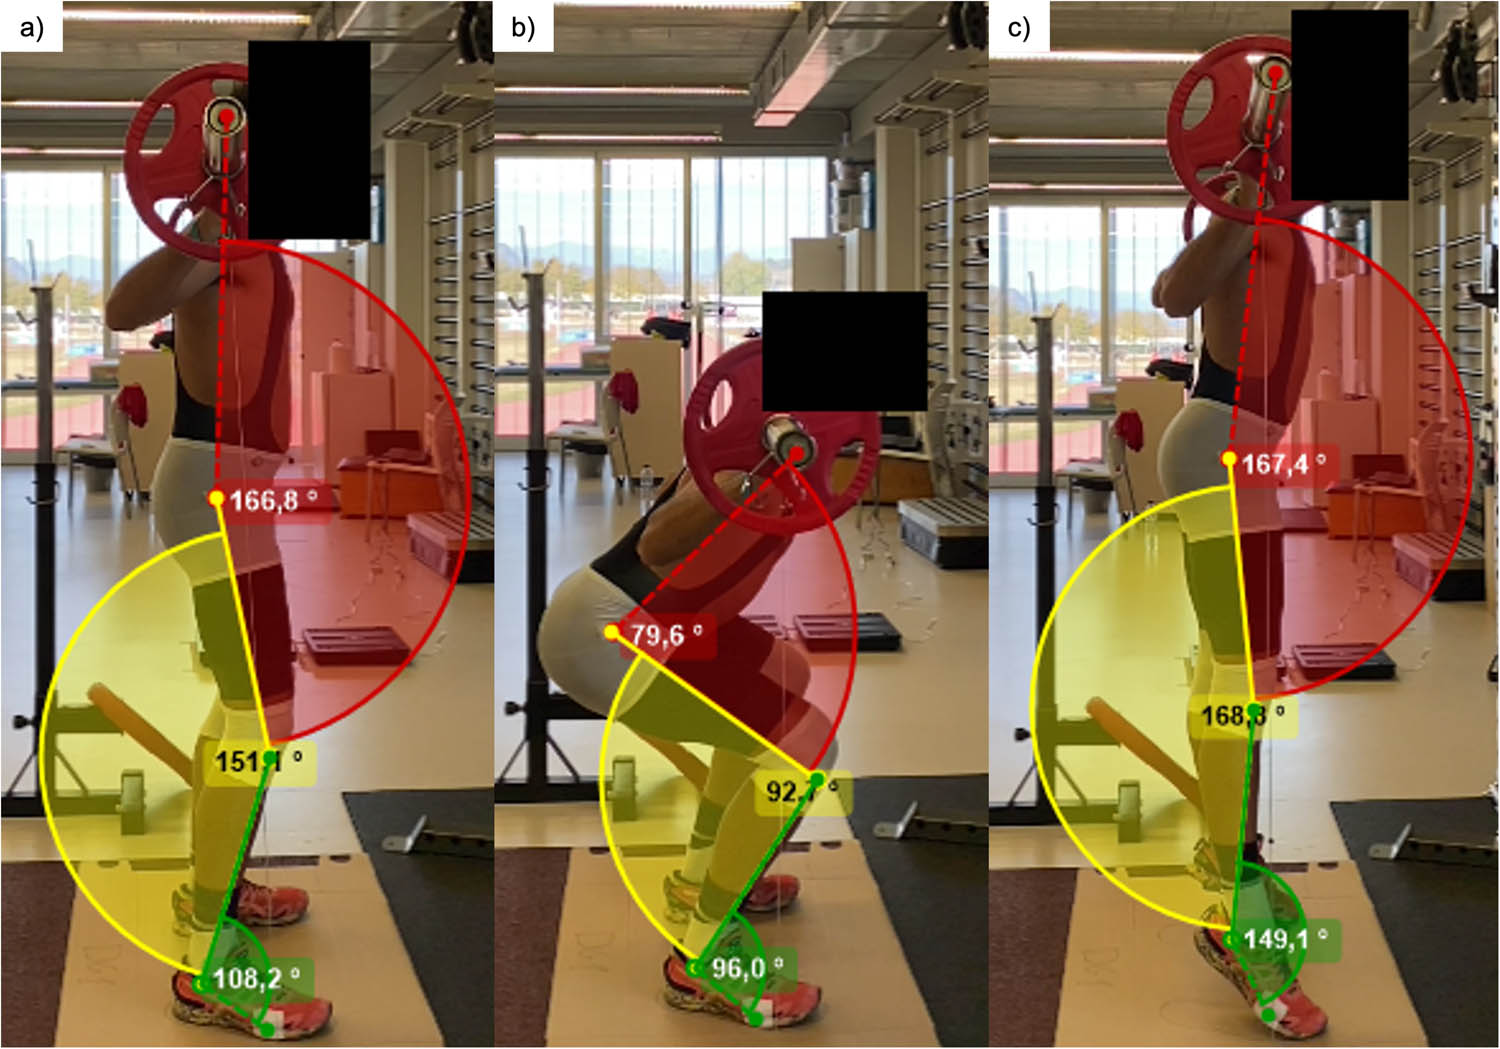
Figure 2
Hip, knee, and ankle angles, measured at the initial position (a), the bottom position (b), and the final position (c)
Source: Author’s contribution.
Table 2
Summary of significant differences from the ANOVA or ART ANOVA and the pairwise tests
| Variables | Significant comparisons of the ANOVA or ART ANOVA | Post-hoc significant results | Interpretation of the effect |
|---|---|---|---|
| Hip angle at the bottom position | Treatment (p = 0.0225, ηp2 = 0.11) | PLA – CON (p = 0.0283, d = −0.72) | ↓ hip angle (↑ hip flexion) in PLA |
| Hip angle at the final position | Fatigue (p = 0.0344, ηp2 = 0.07) | PRE – POST (p = 0.0344, d = 0.47) | ↓ hip angle (↑ hip flexion) in POST |
| Hip angle eccentric ROM | Treatment (p = 0.0001, ηp2 = 0.28) | PLA – CON (p = 0.0001, d = 1.32) | PLA ↑ hip ROM than CON |
| CAFF – CON (p = 0.0024, d = 0.94) | CAFF ↑ hip ROM than CON | ||
| Fatigue (p = 0.0082, ηp2 = 0.10) | PRE – POST (p = 0.0082, d = 0.60) | ↓ hip ROM in POST | |
| Hip angle concentric ROM | Treatment (p = 0.0013, ηp2 = 0.18) | PLA – CON (p = 0.0011, d = 1.01) | PLA ↑ hip ROM than CON |
| CAFF – CON (p = 0.0403, d = 0.68) | CAFF ↑ hip ROM than CON | ||
| Fatigue (p = 0.0003, ηp2 = 0.19) | PRE – POST (p = 0.0003, d = 0.84) | ↓ hip ROM in POST | |
| Knee angle at the bottom position | Fatigue (p = 0.0242, ηp2 = 0.33) | PRE – POST (p = 0.0242, d = −0.21) | ↑ knee angle (↓ knee flexion) in POST |
| Knee angle at the final position | Fatigue (p = 0.0182, ηp2 = 0.08) | PRE – POST (p = 0.0182, d = 0.53) | ↓ knee angle (↑ knee flexion) in POST |
| Knee angle eccentric ROM | Treatment (p = 0.0153, ηp2 = 0.12) | PLA – CON (p = 0.0135, d = 0.79). | ↑ knee ROM in PLA |
| Knee angle concentric ROM | Fatigue (p = 0.0001, ηp2 = 0.22) | PRE – POST (p = 0.0001, d = 0.94) | ↓ knee ROM in POST |
| Ankle angle at the initial position | Treatment (p = 0.0293, ηp2 = 0.10) | The differences became not significant | — |
| Ankle angle at the bottom position | Treatment (p = 0.0017, ηp2 = 0.18) | PLA – CON (p = 0.0044, d = 0.89) | PLA ↑ ankle angle (↓ dorsiflexion) than CON |
| CAFF – CON (p = 0.0067, d = 0.85) | CAFF ↑ ankle angle (↓ dorsiflexion) than CON | ||
| Ankle angle at the final position | Treatment (p = 0.0031, ηp2 = 0.16) | PLA – CON (p = 0.0141, d = 0.78) | PLA ↑ ankle angle (↓ dorsiflexion) than CON |
| CAFF – CON (p = 0.0062, d = 0.86) | CAFF ↑ ankle angle (↓ dorsiflexion) than CON | ||
| Concentric execution time of the movement | Treatment (p = 0.0007, ηp2 = 0.20) | PLA – CON (p = 0.0005, d = 1.07) | ↑ concentric time in PLA |
| Eccentric PVF | Fatigue (p = 0.0107, ηp2 = 0.10) | PRE – POST (p = 0.0107, d = 0.57) | ↓ PVF in POST |
| Concentric PVF | Treatment (p = 0.0233, ηp2 = 0.11) | PLA – CON (p = 0.0214, d = −0.74) | ↓ PVF in PLA |
| Fatigue (p = 0.0022, ηp2 = 0.14) | PRE – POST (p = 0.0022, d = 0.70) | ↓ PVF in POST | |
| Concentric RFD | Treatment (p = 0.0067, ηp2 = 0.14) | PLA – CON (p = 0.0049, d = −0.88) | ↓ RFD in PLA |
| Fatigue (p = 0.0363, ηp2 = 0.07) | PRE – POST (p = 0.0363, d = 0.47) | ↓ RFD in POST | |
| MPBV | Fatigue (p = 0.0037, ηp2 = 0.12) | PRE – POST (p = 0.0037, d = 0.66) | ↓ MPBV in POST |
Abbreviations: PLA = Placebo session. CON = Control Session. CAFF = Caffeine session. PRE = Values before fatigue. POST = Values after fatigue. ROM = Range of Motion. PVF = Peak Vertical Force. RFD = Rate of Force Development. MPBV = Mean Propulsive Bar Velocity. ηp2 = Partial eta squared. d = Cohen’s d. ↑ = More. ↓ = Less.
Source: Author’s contribution.
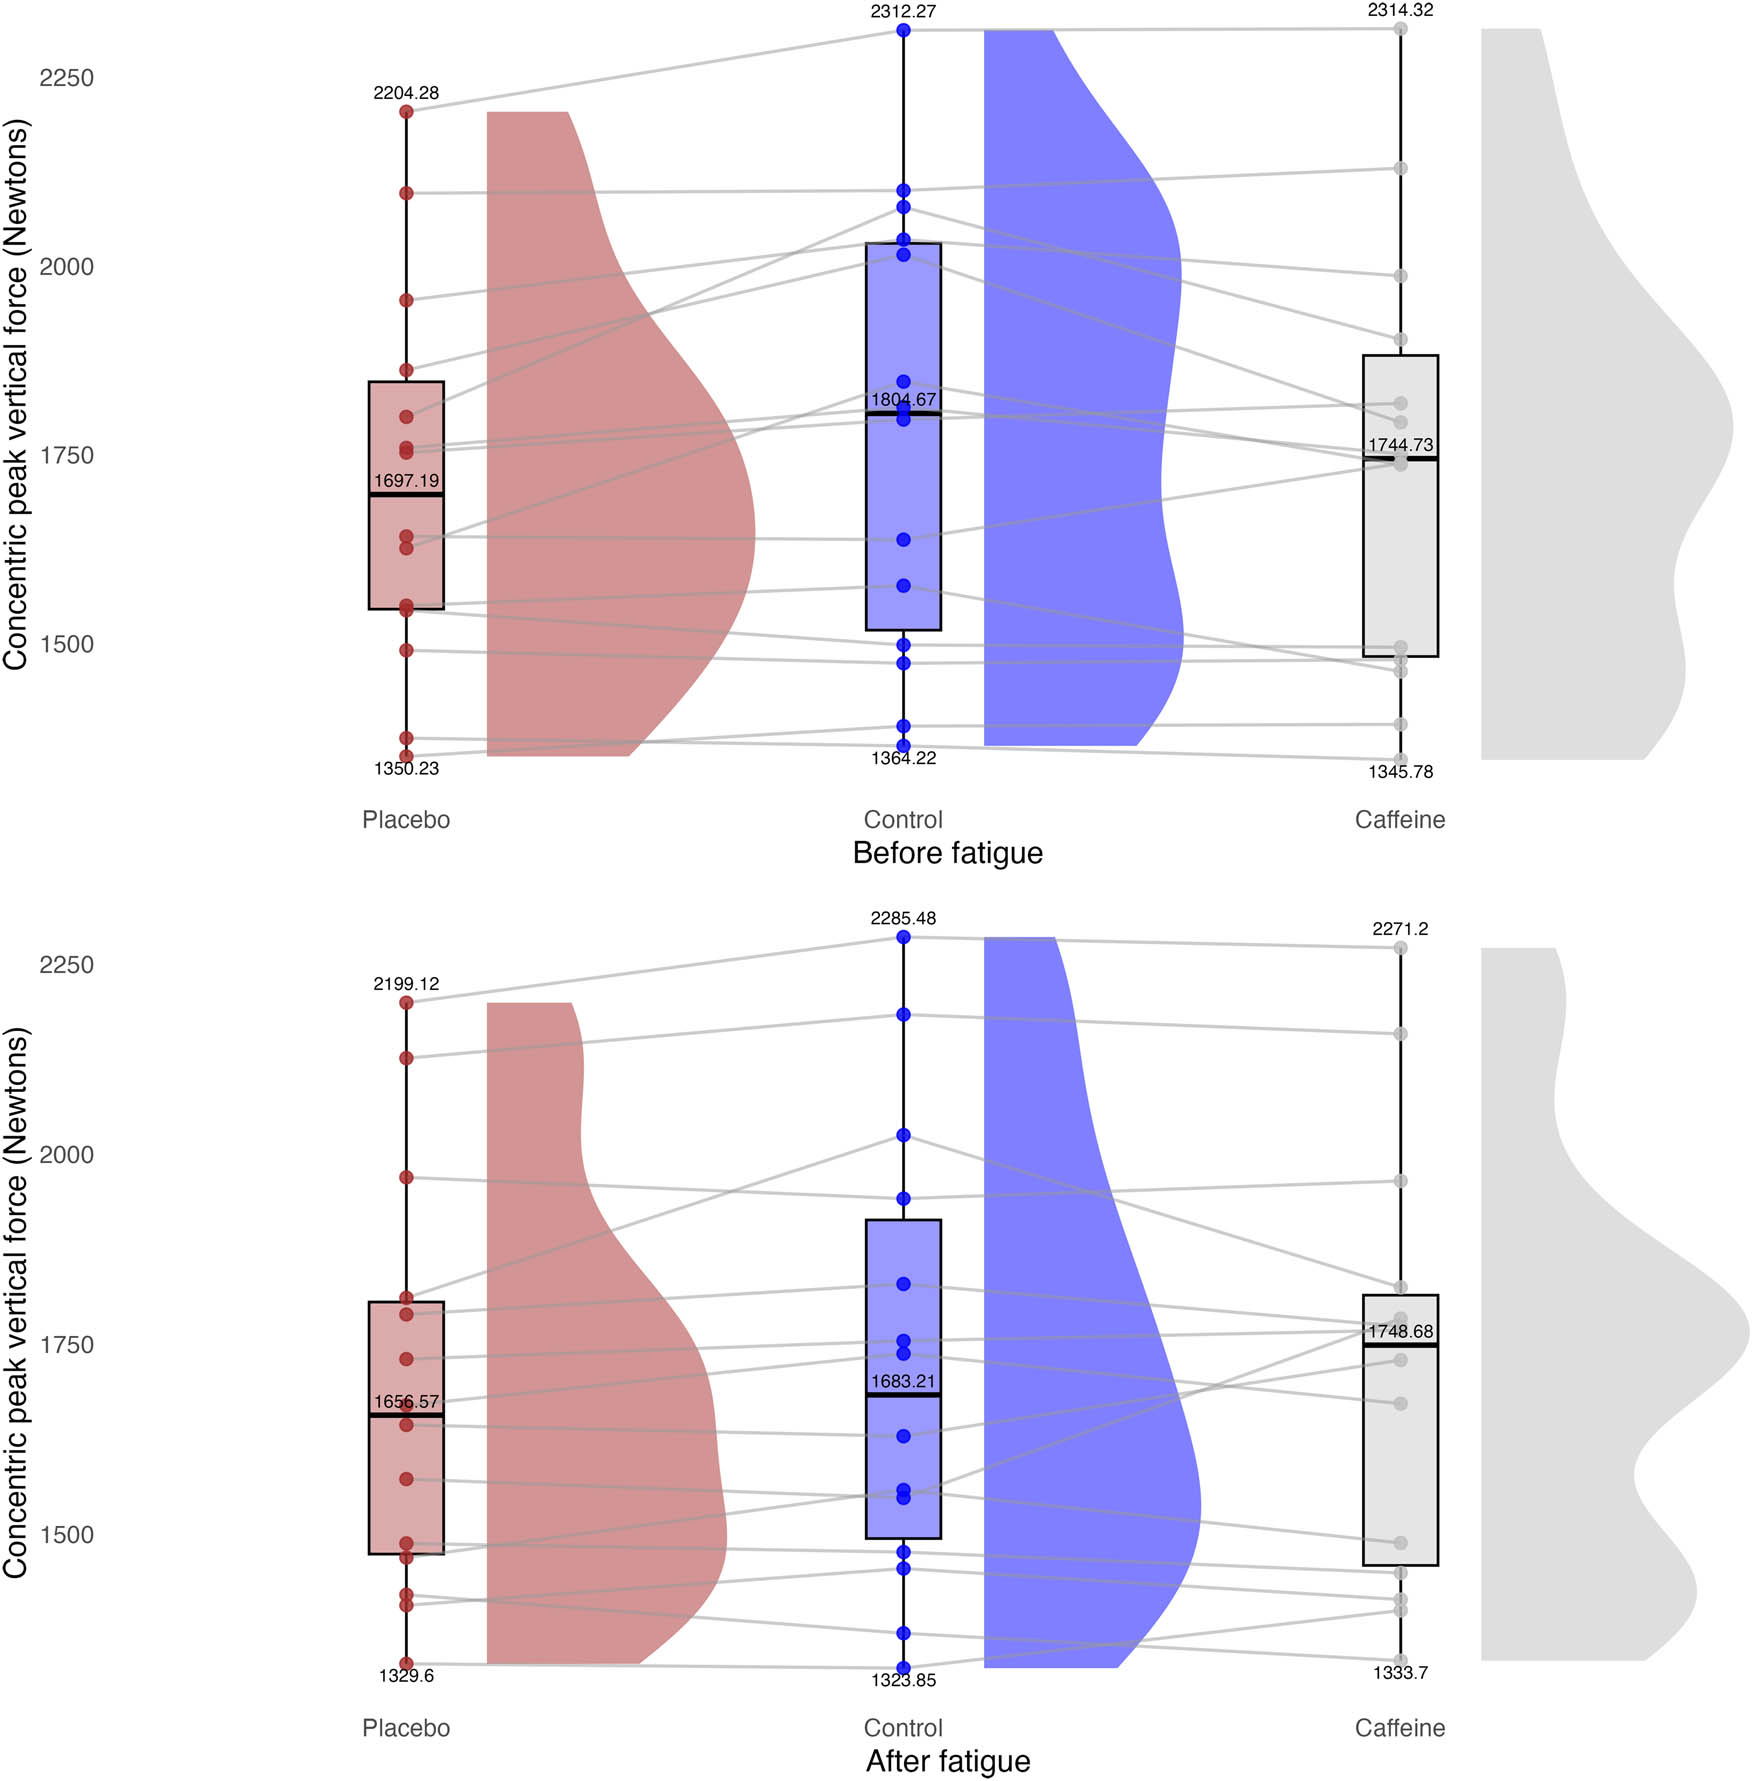
Figure 3
Comparison of the concentric PVF in N across the PLA, CON, and CAFF sessions, before (top) and after (bottom) the fatiguing protocol. The connected dots represent individual participant data
Source: Author’s contribution.
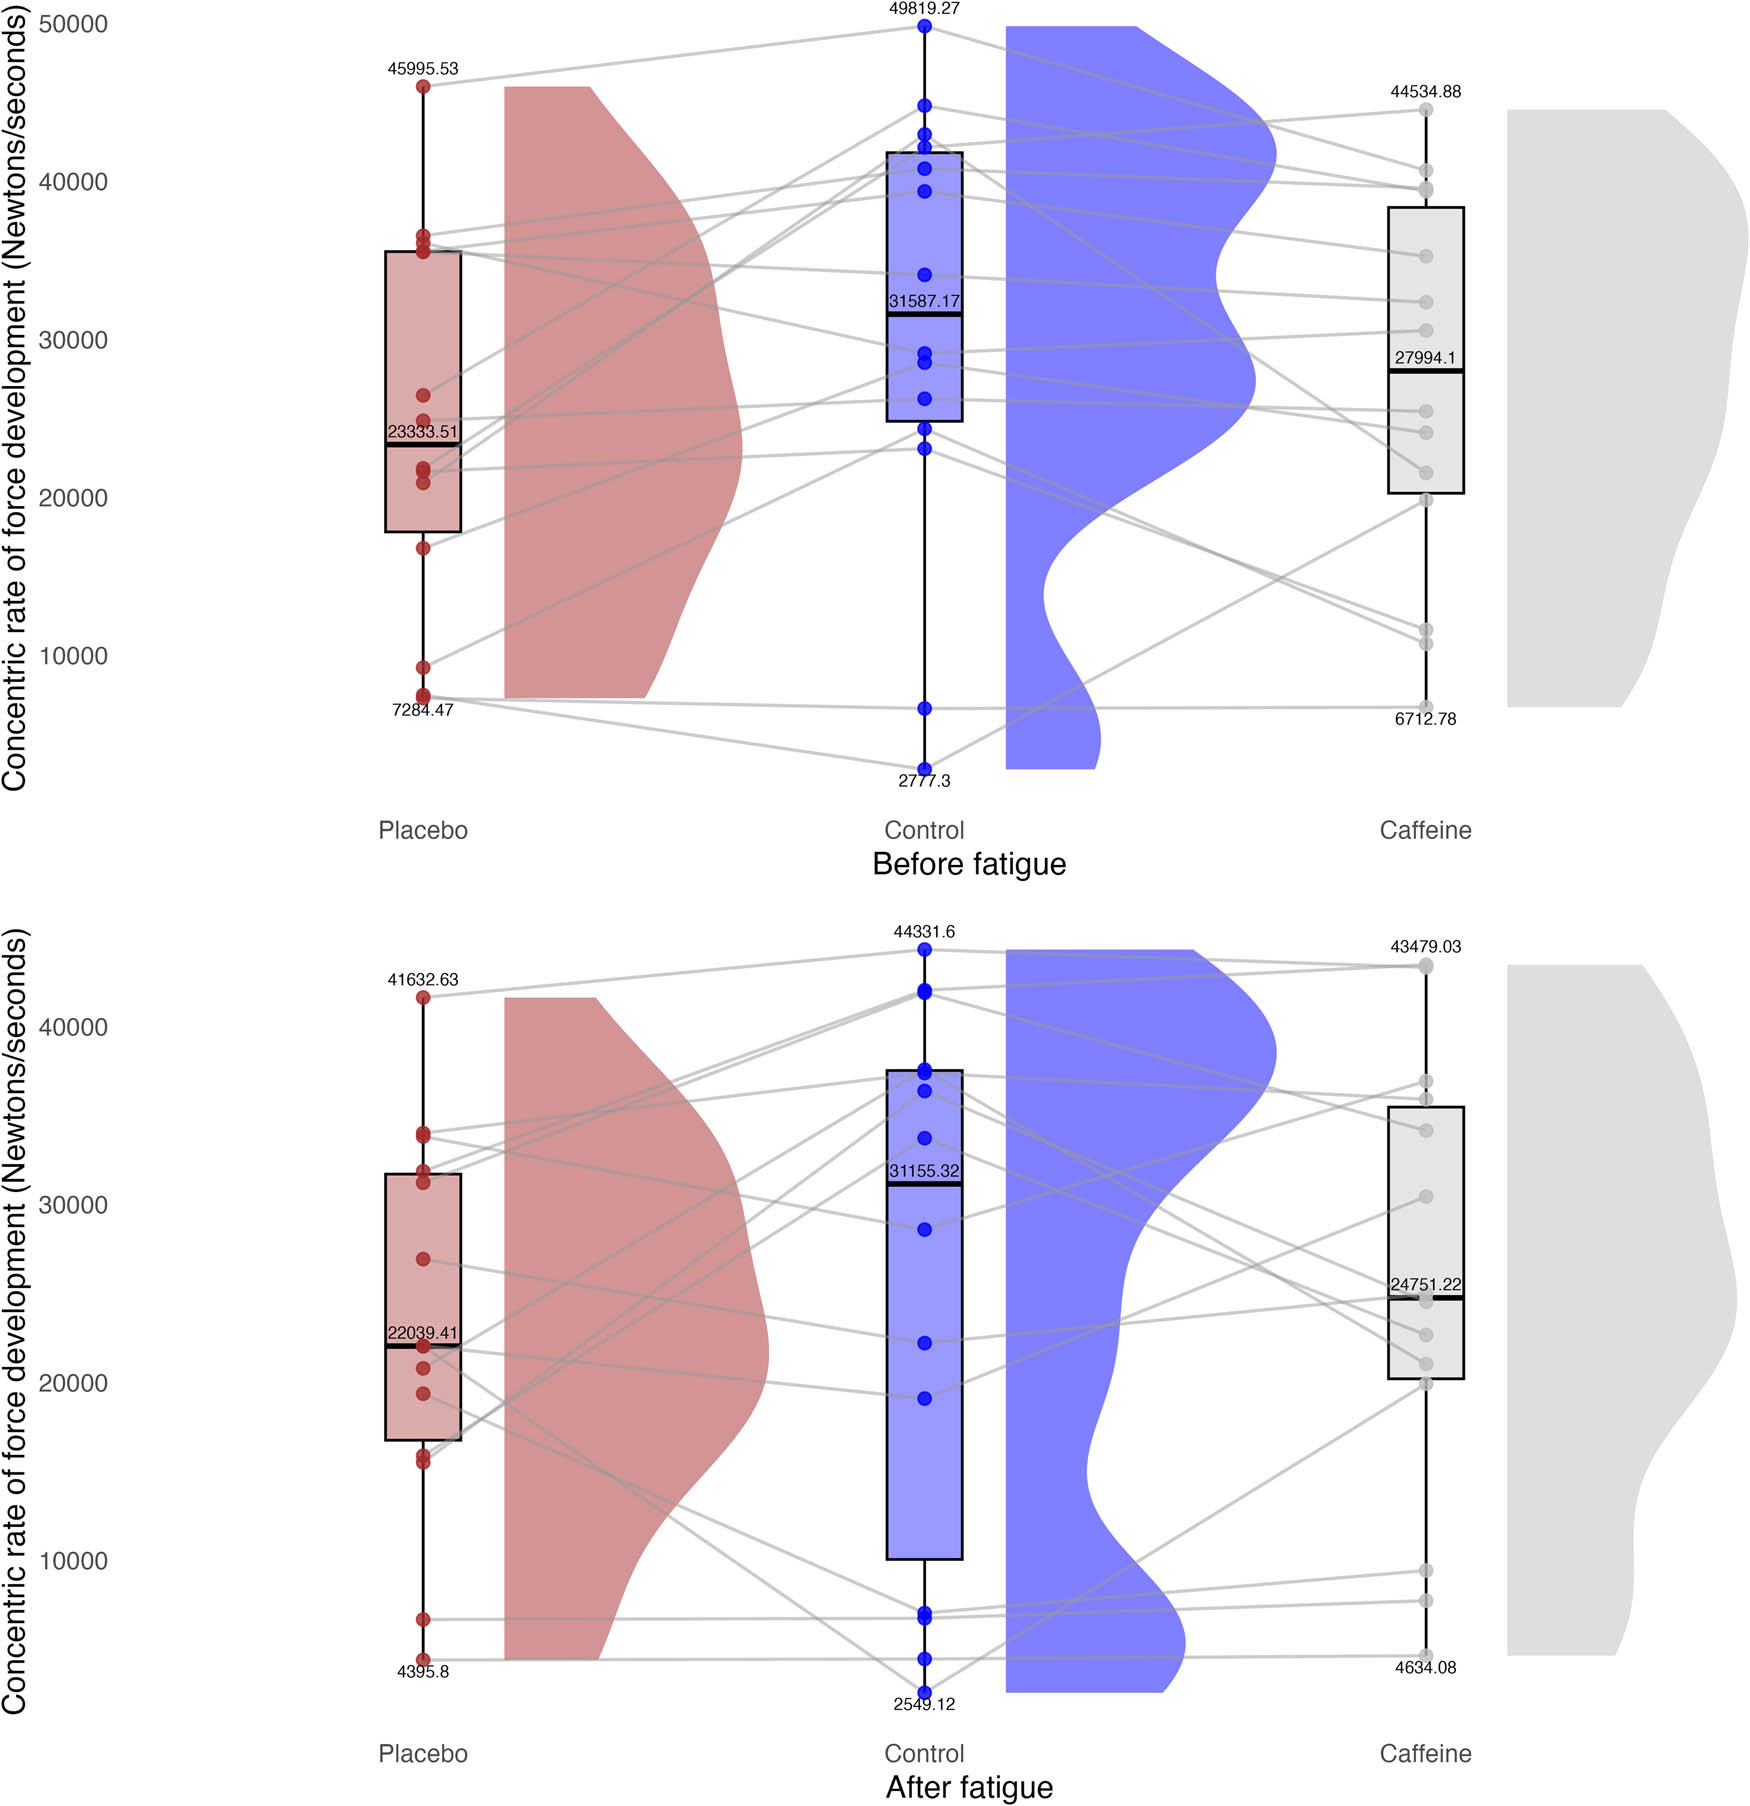
Figure 4
Comparison of the concentric RFD in N/s across the PLA, CON, and CAFF sessions, before (top) and after (bottom) the fatiguing protocol. The connected dots represent individual participant data
Source: Author’s contribution.
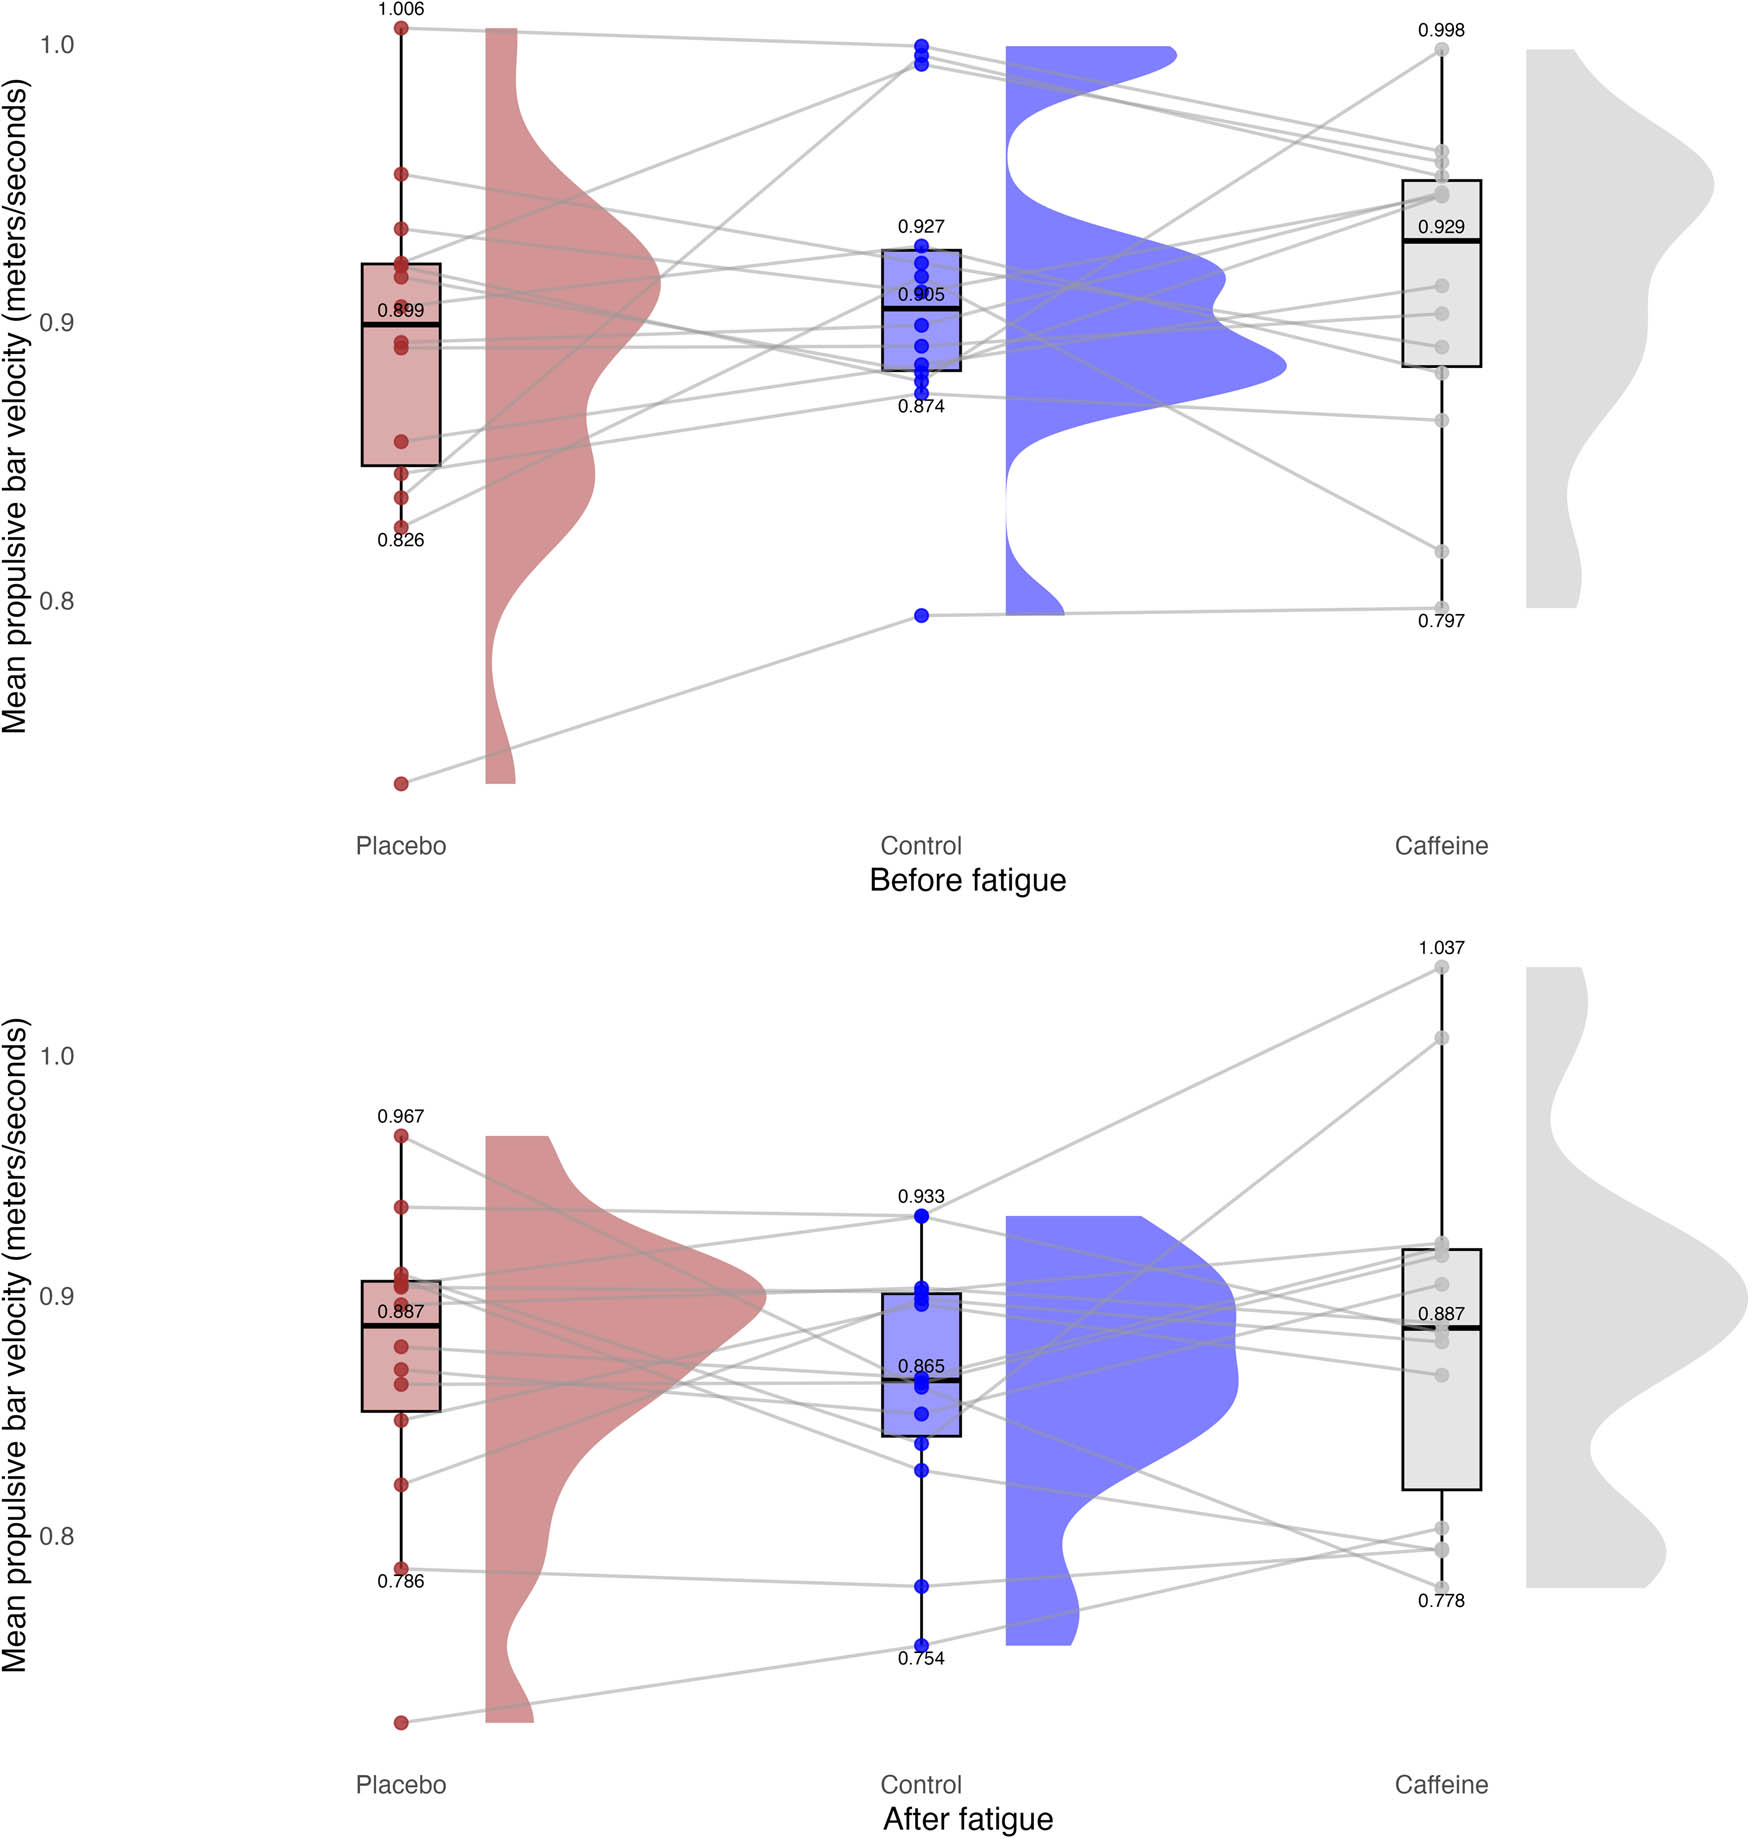
Figure 5
Comparison of the MPBV in m/s across the PLA, CON, and CAFF sessions, before (top) and after (bottom) the fatiguing protocol. The connected dots represent individual participant data
Source: Author’s contribution.