
Table 1.
Technical specifications and processing capabilities of the GNSS post-processing software used in this study
| Characteristics | Software | |||||
|---|---|---|---|---|---|---|
| GNSS solution | WayPoint GrafNav | Magnet Office Tools | Leica Geo-Office | Justin | Trimble B C | |
| Developer | Spectra Precession | NovAtel, Inc | Topcon | Leica Geosystems | Javad | Trimble |
| Versions | v3.x | v8.x | v6.x | v8.x | v3.x | v5.x |
| Processing mode | Relative (static) | Relative + PPP | Relative (static) | Relative (static/kinematic) | Relative + PPP | Relative + ppp |
| Supported GNSS | GPS, GLONNAS | GPS, GLONASS, Galileo | GPS, GLONASS, Galileo, BeiDou | GPS, GLONASS | GPS, GLONASS, Galileo, BeiDou | GPS, GLONASS, Galileo, BeiDou |
| Ambiguity resolution | Yes (L1, L2) | Advanced (AR) | Yes | Yes | Advanced | Advanced |
| Atmospheric modeling | Standard (default) | Advanced models | Standard | Standard | Advanced models | Advanced models |
| Network adjustment | Yes | Limited | Yes | Yes | Yes | Yes |
| References | International GNSS Service (2023) | NovAtel (2023) | Topcon (2022) | Leica Geosystems (2022) | Javad GNSS (2023) | Trimble (2023) |
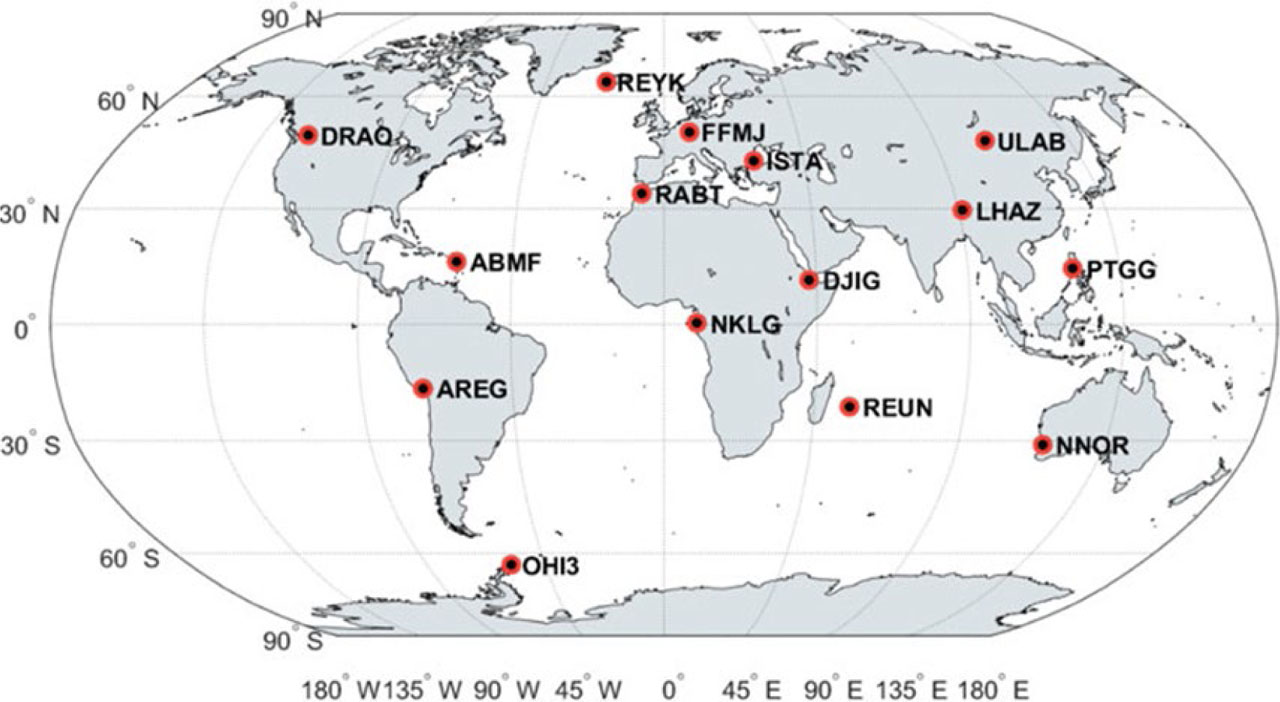
Figure 1.
Geographical distribution of IGS stations used in this study (Bahadur, 2021)
Table 2.
Characteristics of selected IGS/MGEX stations used in the study (Elrewiny MF et al., 2024)
| Station | Country | Receiver | Antenna | Satellite systems | Latitude (°) Longitude (°) | Ellipsoidal Height (m) |
|---|---|---|---|---|---|---|
| DRAO | Canada | SEPT POLARX5 | TWIVC6050 SCIS | GPS+GLO+GAL | 49.323 −119.625 | 542.00 |
| ABMF | Guadeloupe | SEPT POLARX5 | TRM57971.00 NONE | GPS+GLO+GAL+BDS+ SBAS | 16.262 −61.528 | −25.00 |
| AREG | Peru | SEPT POLARX5 | TRM59800.00 NONE | GPS+GLO+GAL+BDS+SBAS | −16.465 −71.493 | 2489.337 |
| OHI3 | Antarctica | LEICA GR50 | LEIR25.R4 LEIT | GPS+GLO+BDS+SBAS | −63.3215 −57.901 | 32.15 |
| REYK | Iceland | LEICA GR50 | LEIR25.R4 LEIT | GPS+GLO+GAL+BDS+IRNSS+SBAS | 64.139 −21.955 | 93.00 |
| FFMJ | Germany | JAVAD TRE_3DEI.TA | LEIAR25.R3 LEIT | GPS+GLO+GAL+BDS+SBAS | 50.091 8.664 | 112.00 |
| ISTA | Turkey | LEICA GR25 | LEIAR25.R4 LEIT | GPS+GLO+GAL+BDS+SBAS | 41.104 29.019 | 147.20 |
| RABT | Morocco | JAVAD TRE_3DELTA | TRM29659.00-SCIS | GPS+GLO+GAL+BDS+IRNSS | 33.998 −6.850 | 90.100 |
| NKLG | Gabon | SEPT POLARX5 | TRM59800.00-SCIS | GPS+GLO+GAL+BDS+IRNSS+SBAS | 0.354 9.672 | 31.496 |
| DJIG | Djibouti | SEPT POLARX5 | TRM59800.00-NONE | GPS+GLO+GAL+BDS+IRNSS+SBAS | 11.526 42.847 | 711.409 |
| REUN | France | SEPT POLARX5 | TRM 559710 | GPS+GLO+GAL+BDS+SBAS | −21.208 55.572 | 1558.40 |
| ULAB | Mongolia | JAVAD TREI3 | JAVRINGANT. GST_NONE | GPS+GLO+GAL+BDS+QZSS+IRNSS+SBAS | 47.865 107.052 | 1575.70 |
| LHAZ | China | LEICA GR25 | LEIAR25.R4_LEIT | GPS+GLO+GAL+BDS+SBAS | 29.657 91.104 | 3622.00 |
| PTGG | Philippines | SEPT POLARX5 | TRM 59800.00-SCIS | GPS+GLO+GAL+BDS+QZSS+IRNSS+SBAS | 14.535 121.041 | 84.900 |
| NNOR | Australia | SEPT POLARX5TR | SEPCHOKE_B3E6-NONE | GPS+GLO+GAL+ BDS+QZSS+IRNSS+SBAS | −31.049 116.193 | 234.984 |
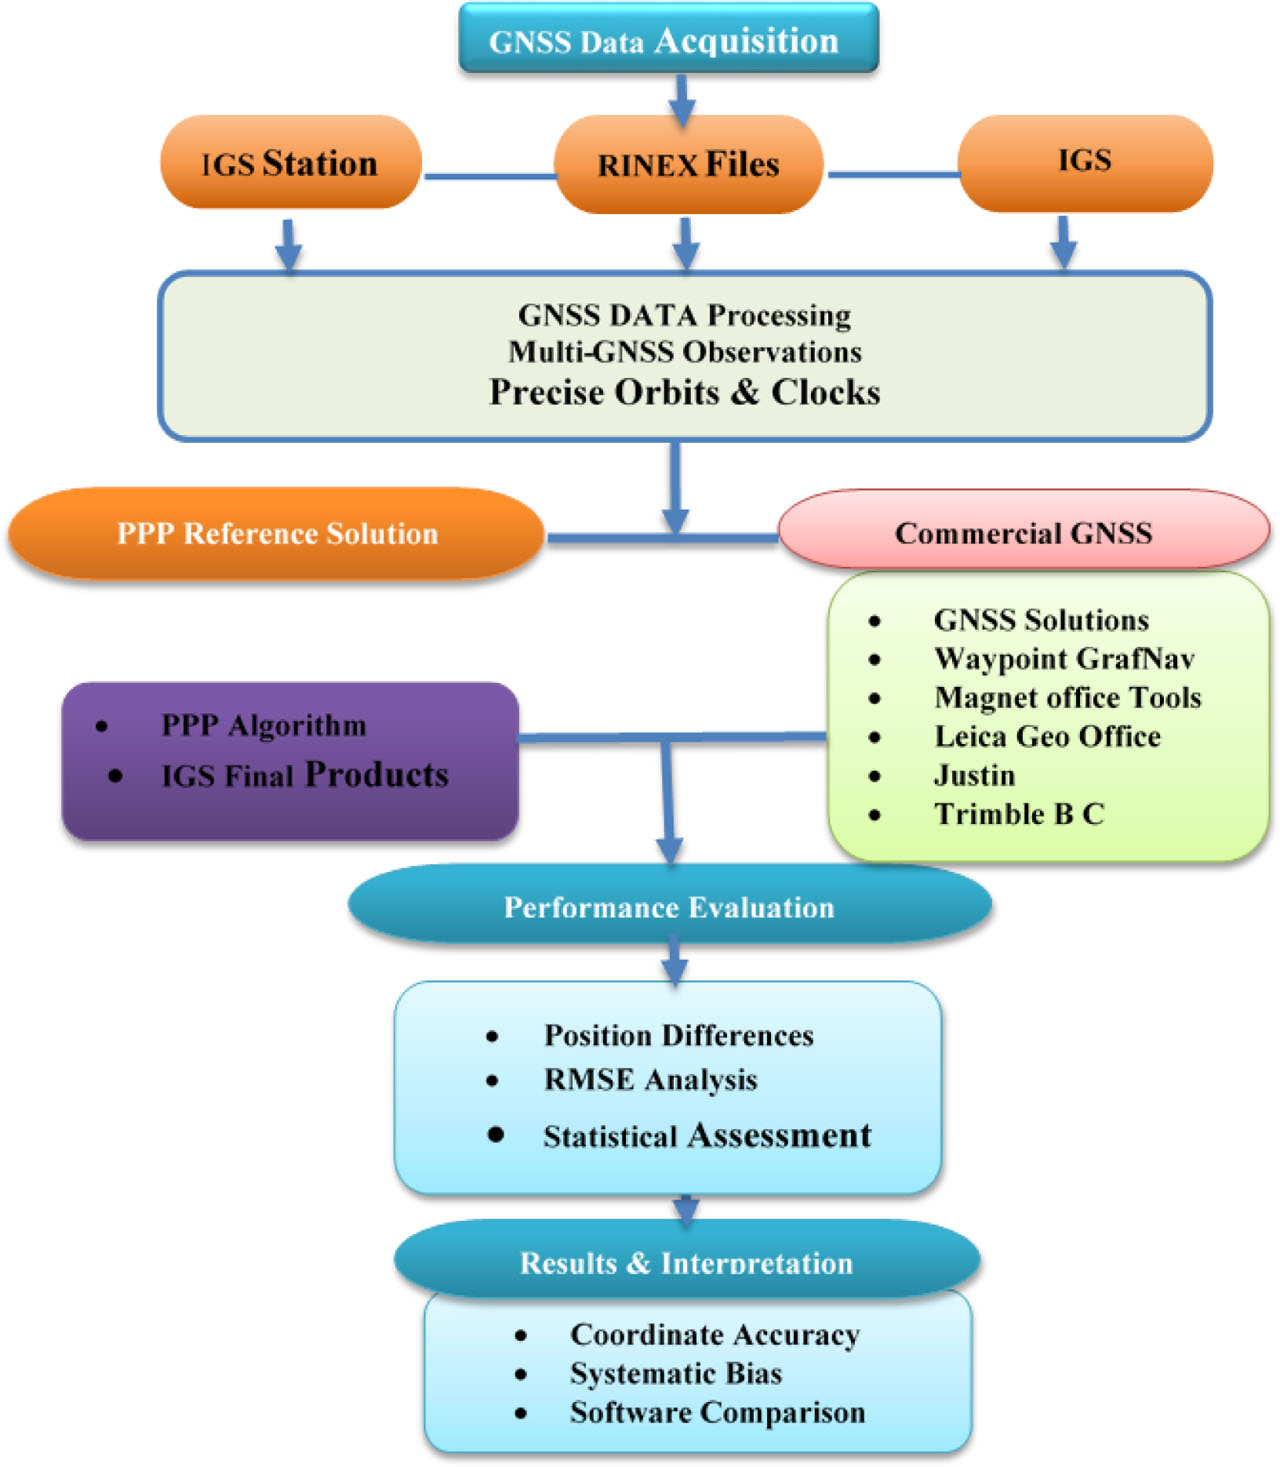
Figure 2.
GNSS data processing workflow
Table 3.
The statistics of differences between IGS station coordinates and those obtained by various software programs
| Program | East (m) | North (m) | Height (m) | |||||||||
|---|---|---|---|---|---|---|---|---|---|---|---|---|
| Min. | Max. | Mean | RMSE | Min. | Max. | Mean | RMSE | Min. | Max. | Mean | RMSE | |
| GNSS solution | −0.021 | 0.026 | 0.020 | 0.016 | −0.013 | 0.025 | 0.018 | 0.014 | −0.013 | 0.025 | 0.017 | 0.018 |
| WayPoint GrafNav | −0.002 | 0.015 | 0.010 | 0.008 | −0.006 | 0.012 | 0.008 | 0.007 | −0.009 | 0.031 | 0.025 | 0.024 |
| Magnet Office Tools | −0.003 | 0.018 | 0.012 | 0.010 | −0.002 | 0.016 | 0.010 | 0.009 | −0.005 | 0.028 | 0.022 | 0.025 |
| Leica Geo-Office | −0.026 | 0.034 | 0.022 | 0.025 | −0.030 | 0.028 | 0.020 | 0.023 | −0.035 | 0.028 | 0.021 | 0.027 |
| Justin | −0.016 | 0.024 | 0.018 | 0.012 | −0.012 | 0.022 | 0.016 | 0.016 | −0.010 | 0.0300 | 0.018 | 0.020 |
| Trimble B C | −0.043 | 0.042 | 0.027 | 0.034 | −0.400 | 0.049 | 0.031 | 0.037 | −0.071 | 0.039 | 0.035 | 0.041 |
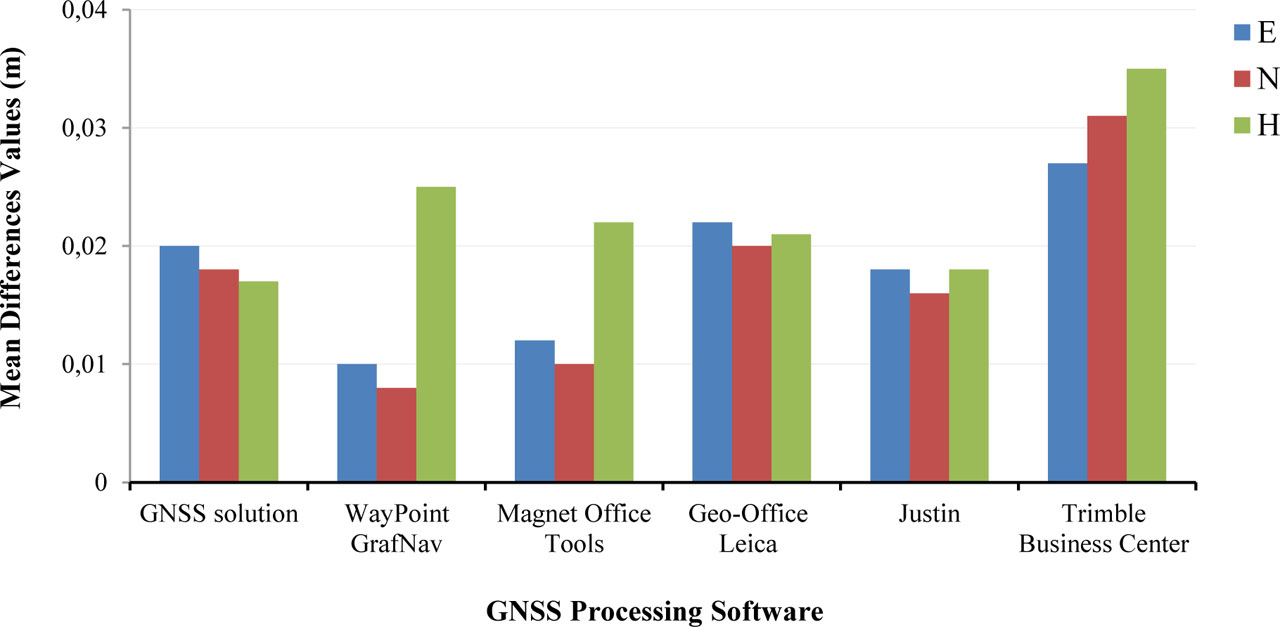
Figure 3.
Mean difference values in coordinates (East, North, and Height) for different GNSS software programs processing used at IGS stations on all days in (m)
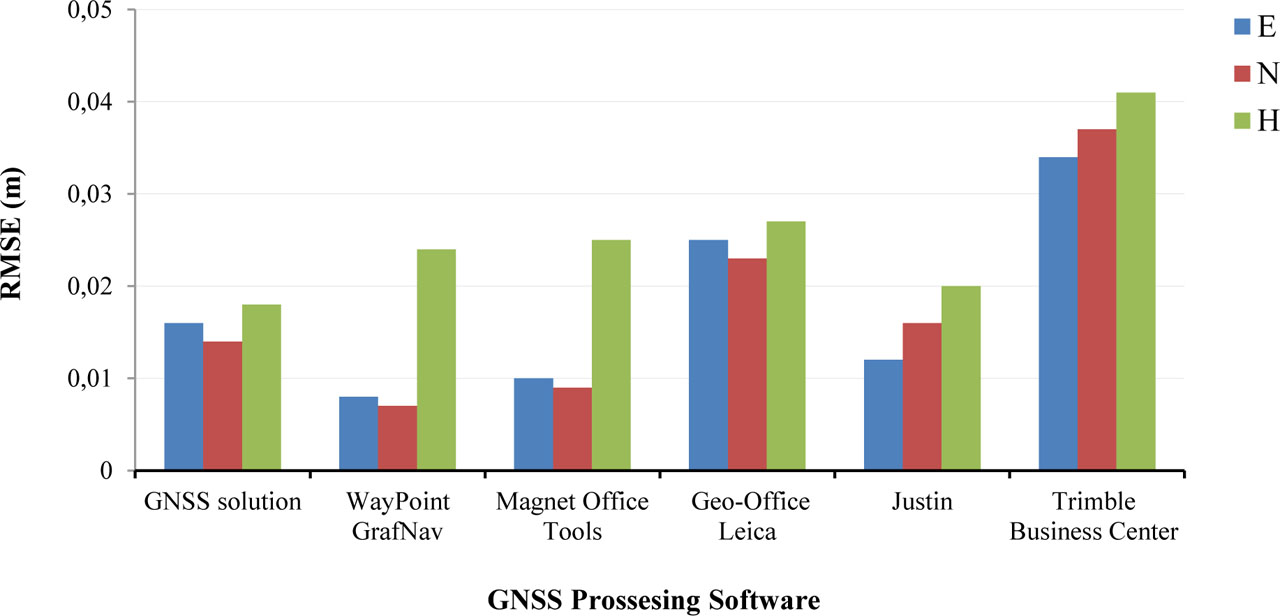
Figure 4.
RMSE in coordinates (East, North, and Height) for different GNSS software programs processing used at IGS stations on all days in (m)
Table 4.
Results of comparing the coordinates of corresponding points obtained through processing in different software
| Software | GNSS solution | Waypoint GrafNav | Magnet Office Tools | Justin | ||||
|---|---|---|---|---|---|---|---|---|
| mXY (m) | mH (m) | mXY (m) | mH (m) | mXY (m) | mH (m) | mXY (m) | mH (m) | |
| GNSS solution | 0.020 | 0.040 | 0.018 | 0.045 | 0.017 | 0.032 | ||
| Waypoint GrafNav | 0.020 | 0.040 | 0.015 | 0.040 | 0.018 | 0.045 | ||
| Magnet Office Tools | 0.018 | 0.045 | 0.015 | 0.040 | 0.019 | 0.055 | ||
| Justin | 0.017 | 0.032 | 0.018 | 0.045 | 0.019 | 0.055 | ||
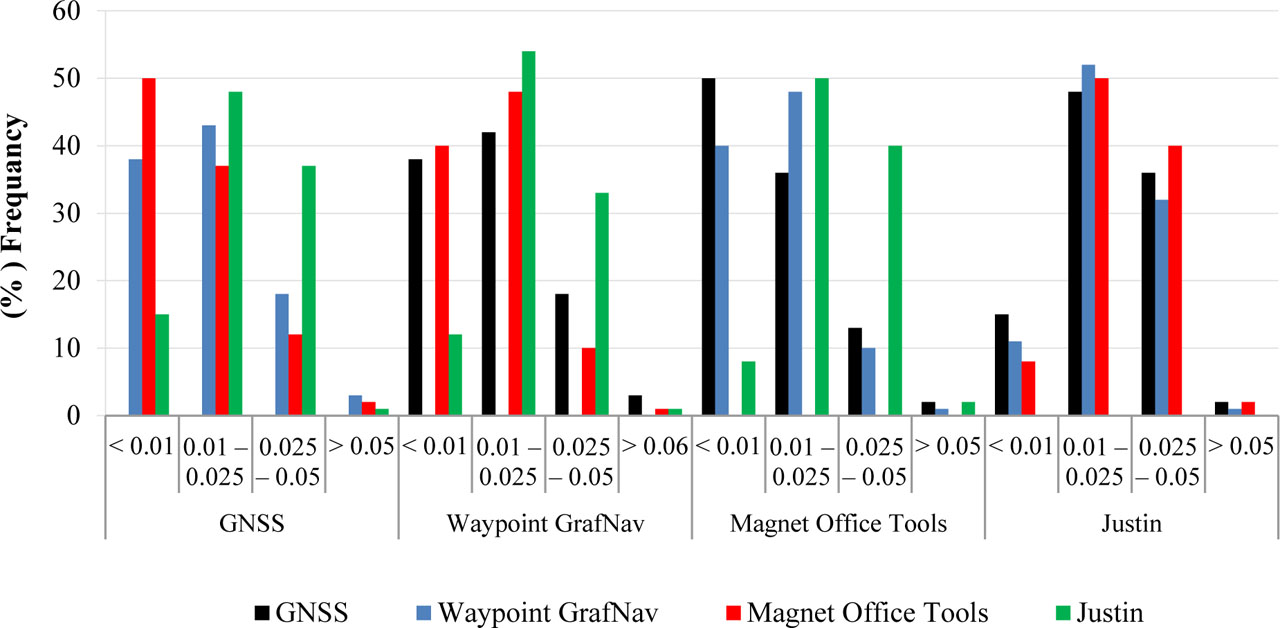
Figure 5.
Statistical distribution of the mean difference values of the station’s coordinates in the horizontal plane of the points processed using different software
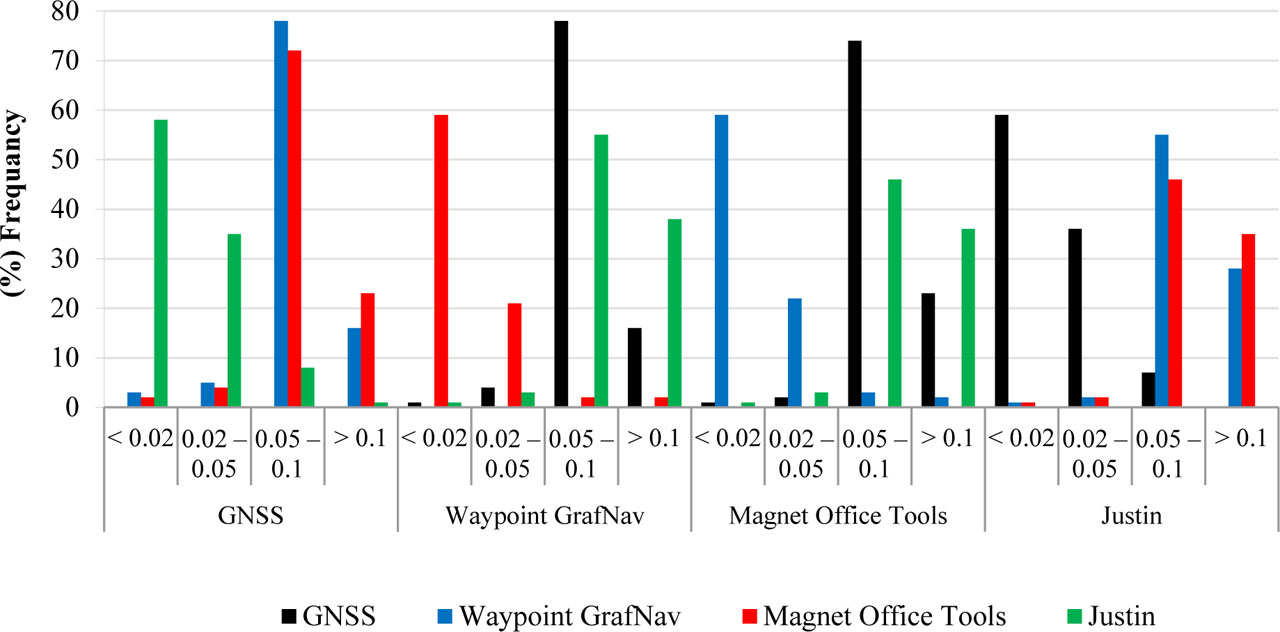
Figure 6.
Histogram of the mean difference values of the station’s coordinates in the heights of the points processed using different software
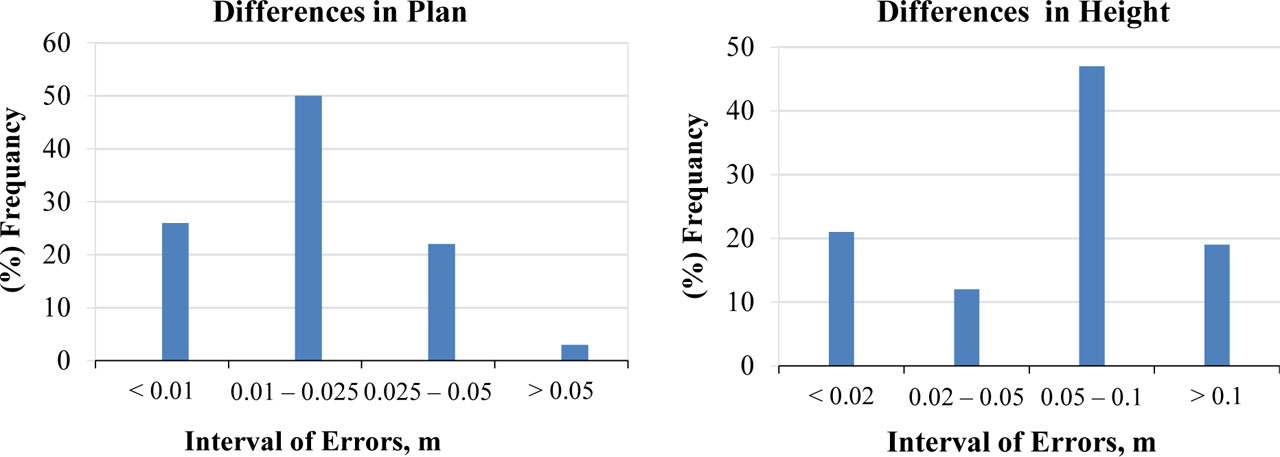
Figure 7.
Summary histograms of the mean difference values in horizontal coordinates and heights of the points processed in the tested software