
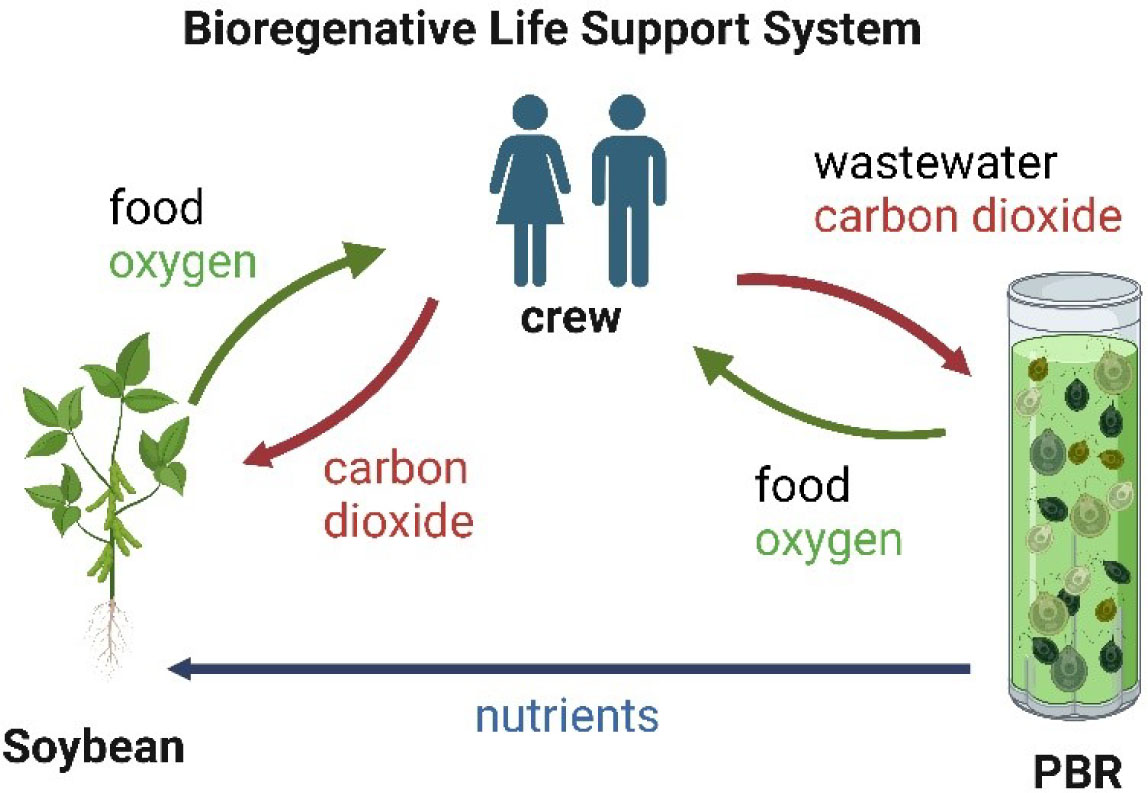
Figure 1.
The BLSS scheme includes the cultivation of microalgae in PBR and soybeans in the greenhouse as an oxygen source as well as food. Red arrows indicate waste generated during the mission from the crew (wastewater, carbon dioxide). Green arrows are goods like oxygen and food which are obtained from microalgae and plant cultivation. The blue arrow indicates nutrients provided from microalgae biomass (nitrogen, phosphorus) to plant cultivation. Created with BioRender.com
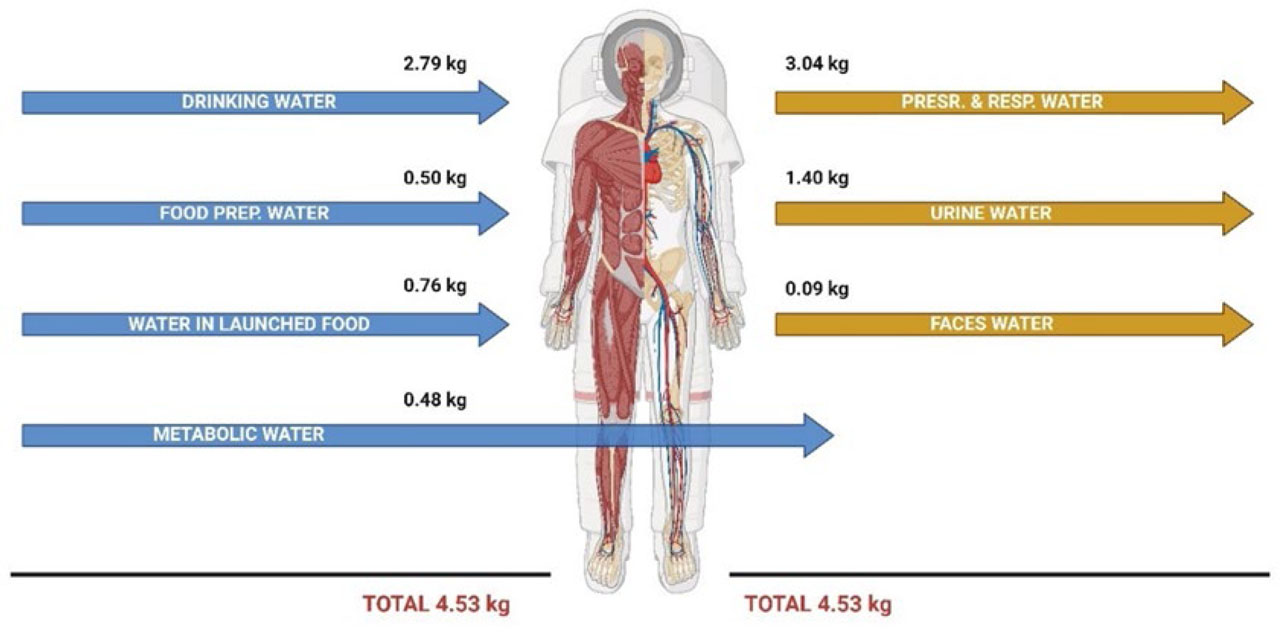
Figure 2.
Reference astronaut’s daily water mass balance takes into account water demand and the source of water from the human body. Blue arrows indicate drinking water, food preparation water, water in launched food, and metabolic water. Yellow arrows are perspiration and respiration water vapor, urine, and feces water. Data are taken from Ewert et al. (2019). Created with BioRender.com.
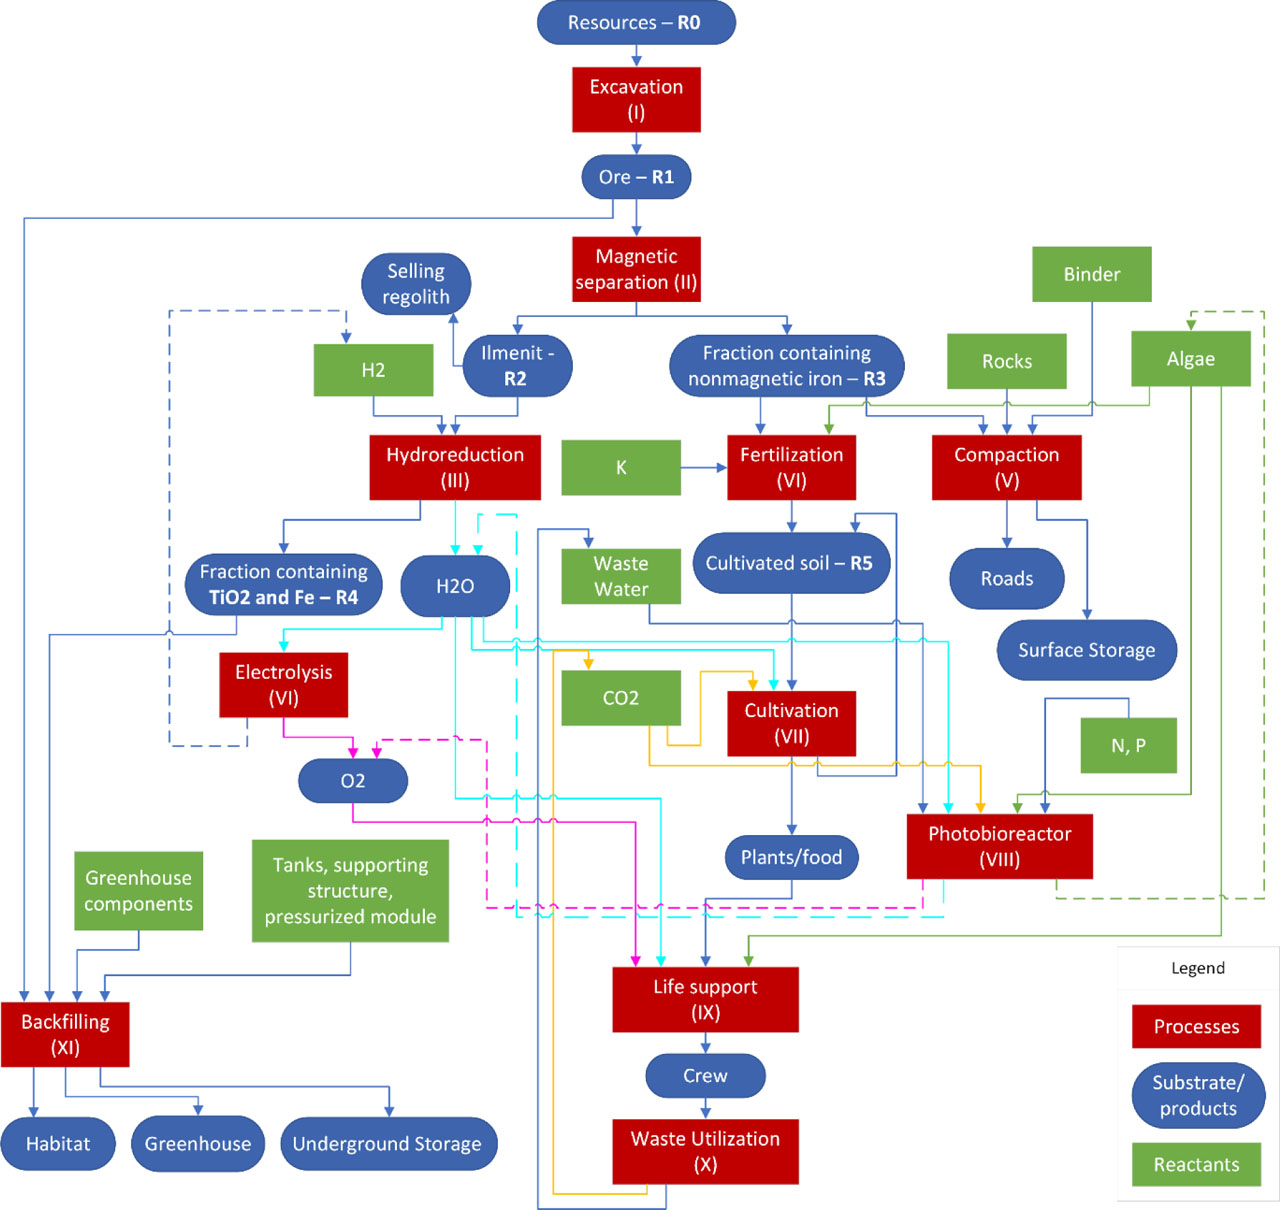
Figure 3.
Open pit mine block diagram describing the flow of lunar regolith, products, and reactants between processes
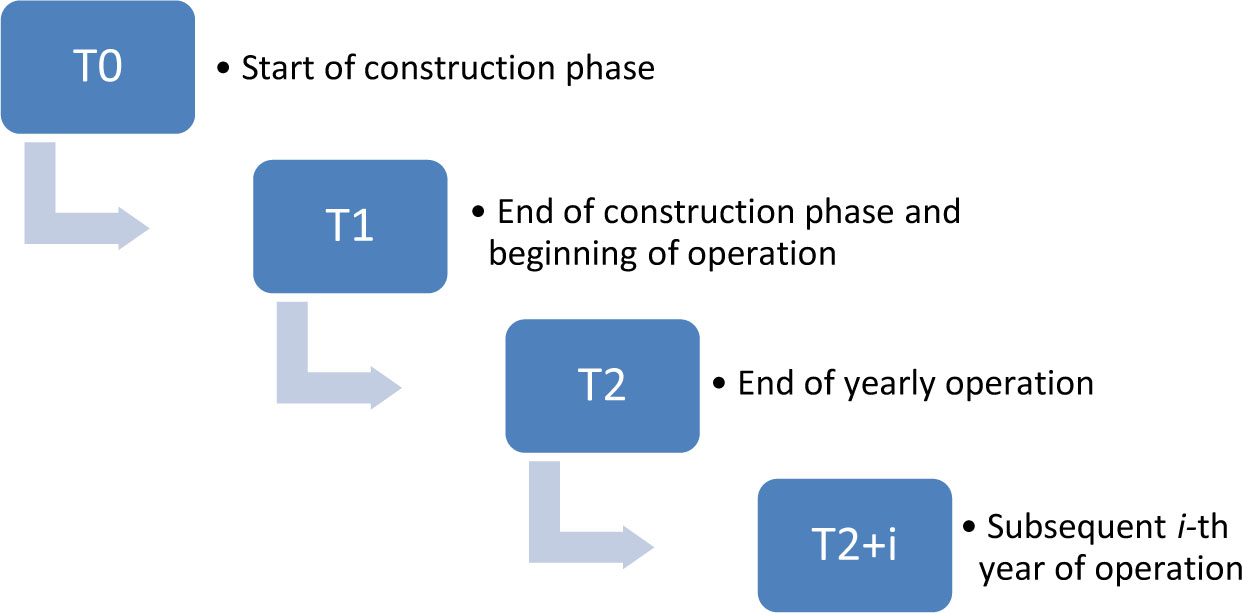
Figure 4.
Timeframe of critical phases of an open pit mine development and operation
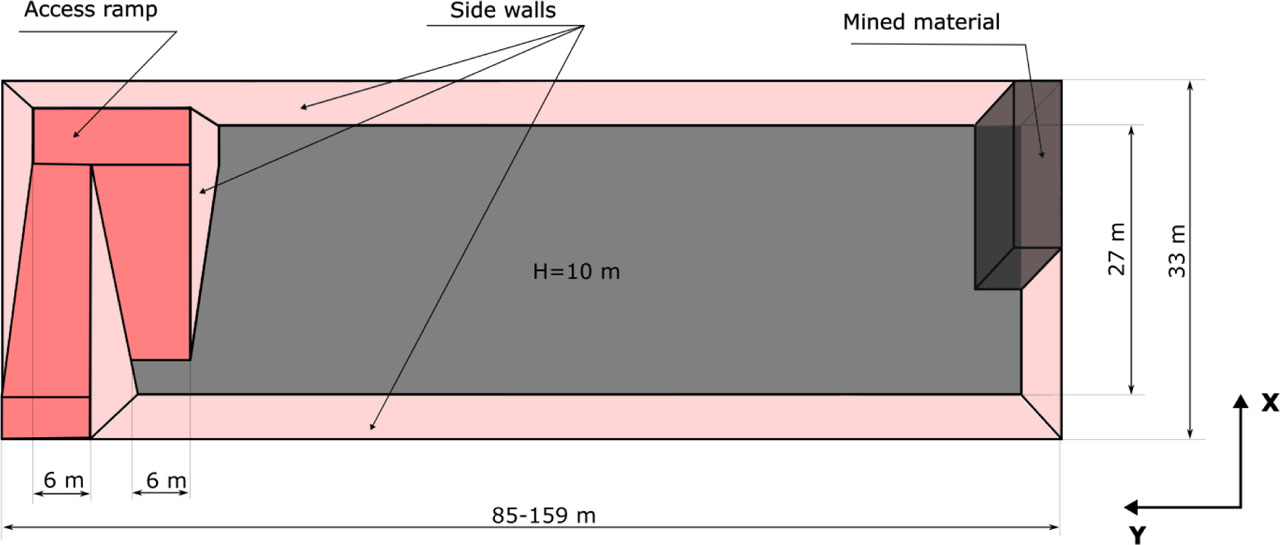
Figure 5.
A schematic view of the proposed mining site. The site's vertical boundary is set at a depth of 10 m, based on average regolith layer estimates. The pit's average width is 30 m, with lengths determined by regolith mass requirements: 49.9 m during construction and 158.6 m (annually) during exploitation. The pit walls have a slope angle of 60°, chosen for safety despite the Moon's lower gravity. The haul road has a grade of 20%, with an elevation spread over a distance of 50 m, split into two 25-m sections on the pit's narrower side.
Table 1.
Demand for tonnes of regolith (substrate) in different states to carry out the selected processes
| Regolith mass, t/year | Process | R0 | R1 | R2 | R3 | R4 | R5 |
|---|---|---|---|---|---|---|---|
| Selling regolith | Excavation | 68,959 | |||||
| Magnetic separation | 68,959 | ||||||
| Construction of habitat | Excavation | 6,662 | |||||
| Magnetic separation | 4,168 | ||||||
| Hydrogen reduction | 375 | ||||||
| Backfilling | 2,495 | 340 | |||||
| Construction of roads | Excavation | 1,780 | |||||
| Magnetic separation | 1,780 | ||||||
| Compaction | 1,620 | ||||||
| Greenhouse construction | Excavation | 19,987 | |||||
| Magnetic separation | 12,503 | ||||||
| Hydrogen reduction | 1,125 | ||||||
| Backfilling | 7,484 | 1,021 | |||||
| Construction of storage | Excavation | 5,376 | |||||
| Magnetic separation | 5,376 | ||||||
| Compaction | 4,789 | ||||||
| Backfilling | 103 | ||||||
| Recultivation | 60,000 | ||||||
| Crew | Excavation | 440 | |||||
| Magnetic separation | 440 | ||||||
| Fertilization | 400 | ||||||
| Cultivation | 400 | ||||||
| Sum | Construction | 45,103 | 35,893 | 3,001 | 12,699 | 1,361 | 400 |
| Sum | Operations | 85,633 | 85,633 | 1,501 | 60,000 | 0 | 400 |
Table 2.
Demand for reactants in different states to carry out selected processes
| Mass in tonnes | Process | H2 | O2 | Algae | Plants/food | N | P | K | CO2 | H2O | Binder |
|---|---|---|---|---|---|---|---|---|---|---|---|
| Construction of habitat | Hydrogen reduction | 4.36 | |||||||||
| Construction of roads | Compaction | 270.0 | |||||||||
| Greenhouse construction | Hydrogen reduction | 13.08 | |||||||||
| Crew | Electrolysis | 0.28 | |||||||||
| Life support | 0.7 | 0.26 | 0.07 | 4 | |||||||
| Fertilization | 0.03 | ||||||||||
| PBR | 0.00 | 0.50 | 70 | ||||||||
| Cultivation | 0.001 | 0.11 | 87 | ||||||||
| Sum | Construction | 17.44 | 0.73 | 0.29 | 0.07 | 0.0013 | 0.001 | 0.001 | 0.61 | 161.28 | 270.00 |
| Sum | Operations | 0.00 | 0.73 | 0.29 | 0.07 | 0.0013 | 0.001 | 0.001 | 0.61 | 161.28 | 0.00 |
Table 3.
Products (regolith in different states) from selected processes
| Regolith mass, t/year | Process | R0 | R1 | R2 | R3 | R4 | R5 |
|---|---|---|---|---|---|---|---|
| Selling regolith | Excavation | 68,959 | |||||
| Magnetic separation | 6,206 | 62,753 | |||||
| Construction of habitat | Excavation | 6,662 | |||||
| Magnetic separation | 2,495 | 375 | 3,793 | ||||
| Hydrogen reduction | 340 | ||||||
| Construction of roads | Excavation | 297 | |||||
| Magnetic separation | 27 | 270 | |||||
| Greenhouse construction | Excavation | 19,987 | |||||
| Magnetic separation | 7,484 | 1,125 | 11,378 | ||||
| Hydrogen reduction | 1,021 | ||||||
| Construction of storage | Excavation | 5,376 | |||||
| Magnetic separation | 484 | 4,892 | |||||
| Crew | Excavation | 440 | |||||
| Magnetic separation | 40 | 400 | |||||
| Fertilization | 400 | ||||||
| Sum | Construction | 0 | 55,852 | 3,230 | 47,435 | 2,722 | 400 |
| Sum | Operations | 0 | 85,633 | 7,707 | 92,698 | 1,361 | 400 |
Table 4.
Products (reactants) from selected processes
| Mass in tonnes | Process | H2O | H2 | O2 | CO2 | Plants/food | Algae |
|---|---|---|---|---|---|---|---|
| Construction of habitat | Hydrogen reduction | 39.4 | |||||
| Greenhouse construction | Hydrogen reduction | 118.2 | |||||
| Crew | Electrolysis | 0.03 | 0.25 | ||||
| Life support | 0.73 | ||||||
| PBR | 0.4 | 0.29 | |||||
| Cultivation | 0.08 | 0.07 | |||||
| Sum | Construction | 157.53 | 0.03 | 0.73 | 0.73 | 0.07 | 0.29 |
| Sum | Operations | 0.00 | 0.03 | 0.73 | 0.73 | 0.07 | 0.29 |
Table 5.
Numerical values of coefficients from equations 1 to 8
| Process | Name | Symbol | Value | Process | Name | Symbol | Value |
|---|---|---|---|---|---|---|---|
| Excavation | R0 regolith | αex1 | 1 | Cultivation | R5 regolith | αct1 | 1 |
| R1 regolith | αex2 | 1 | H2O | αct2 | 0.217 | ||
| Magnetic separation | R1 regolith | αms1 | 1 | CO2 | αct3 | 0.00045 | |
| R2 regolith | αms2 | 0.090 | Plants/food | αct4 | 0.00017 | ||
| R3 regolith | αms3 | 0.910 | R5 regolith | αct6 | 1 | ||
| Hydrogen reduction | R2 regolith | αhr1 | 1 | Photobio-reactor | H2O | αpb1 | 1 |
| H2 | αhr2 | 0.012 | CO2 | αpb2 | 0.00714 | ||
| H2O | αhr3 | 0.105 | Wastewater | αpb3 | 0.05 | ||
| R4 regolith | αhr4 | 0.907 | Microalgae | αpb4 | 0.00428 | ||
| Electrolysis | H2O | αel1 | 1 | O2 | αpb5 | 0.00571 | |
| H2 | αel2 | 0.111 | H2O | αpb6 | 0.6 | ||
| O2 | αel3 | 0.889 | N | αpb7 | 0.00019 | ||
| Backfilling | R1 regolith | αbf1 | 0.880 | P | αpb8 | 0.000014 | |
| R4 regolith | αbf2 | 0.120 | Waste utilization | CO2 | αwu1 | 0.2 | |
| Shield | αbf3 | 1 | Wastewater | αwu2 | 1 | ||
| Compaction | R3 regolith | αcp1 | 0.500 | O2 | αwu3 | 0.15 | |
| Binder | αcp2 | 0.500 | H20 | αwu4 | 1 | ||
| Road | αcp3 | 1 | Life support | O2 | αls1 | 0.175 | |
| Fertilization | R3 regolith | αft1 | 0.999 | H2O | αls2 | 1 | |
| Microalgae | αft2 | 0.000075 | Plants/food | αls3 | 0.0175 | ||
| K | αft3 | 0.0000025 | Microalgae | αls4 | 0.065 | ||
| R5 regolith | αft4 | 1 | CO2 | αls5 | 0.2 | ||
| Wastewater | αls6 | 1 |
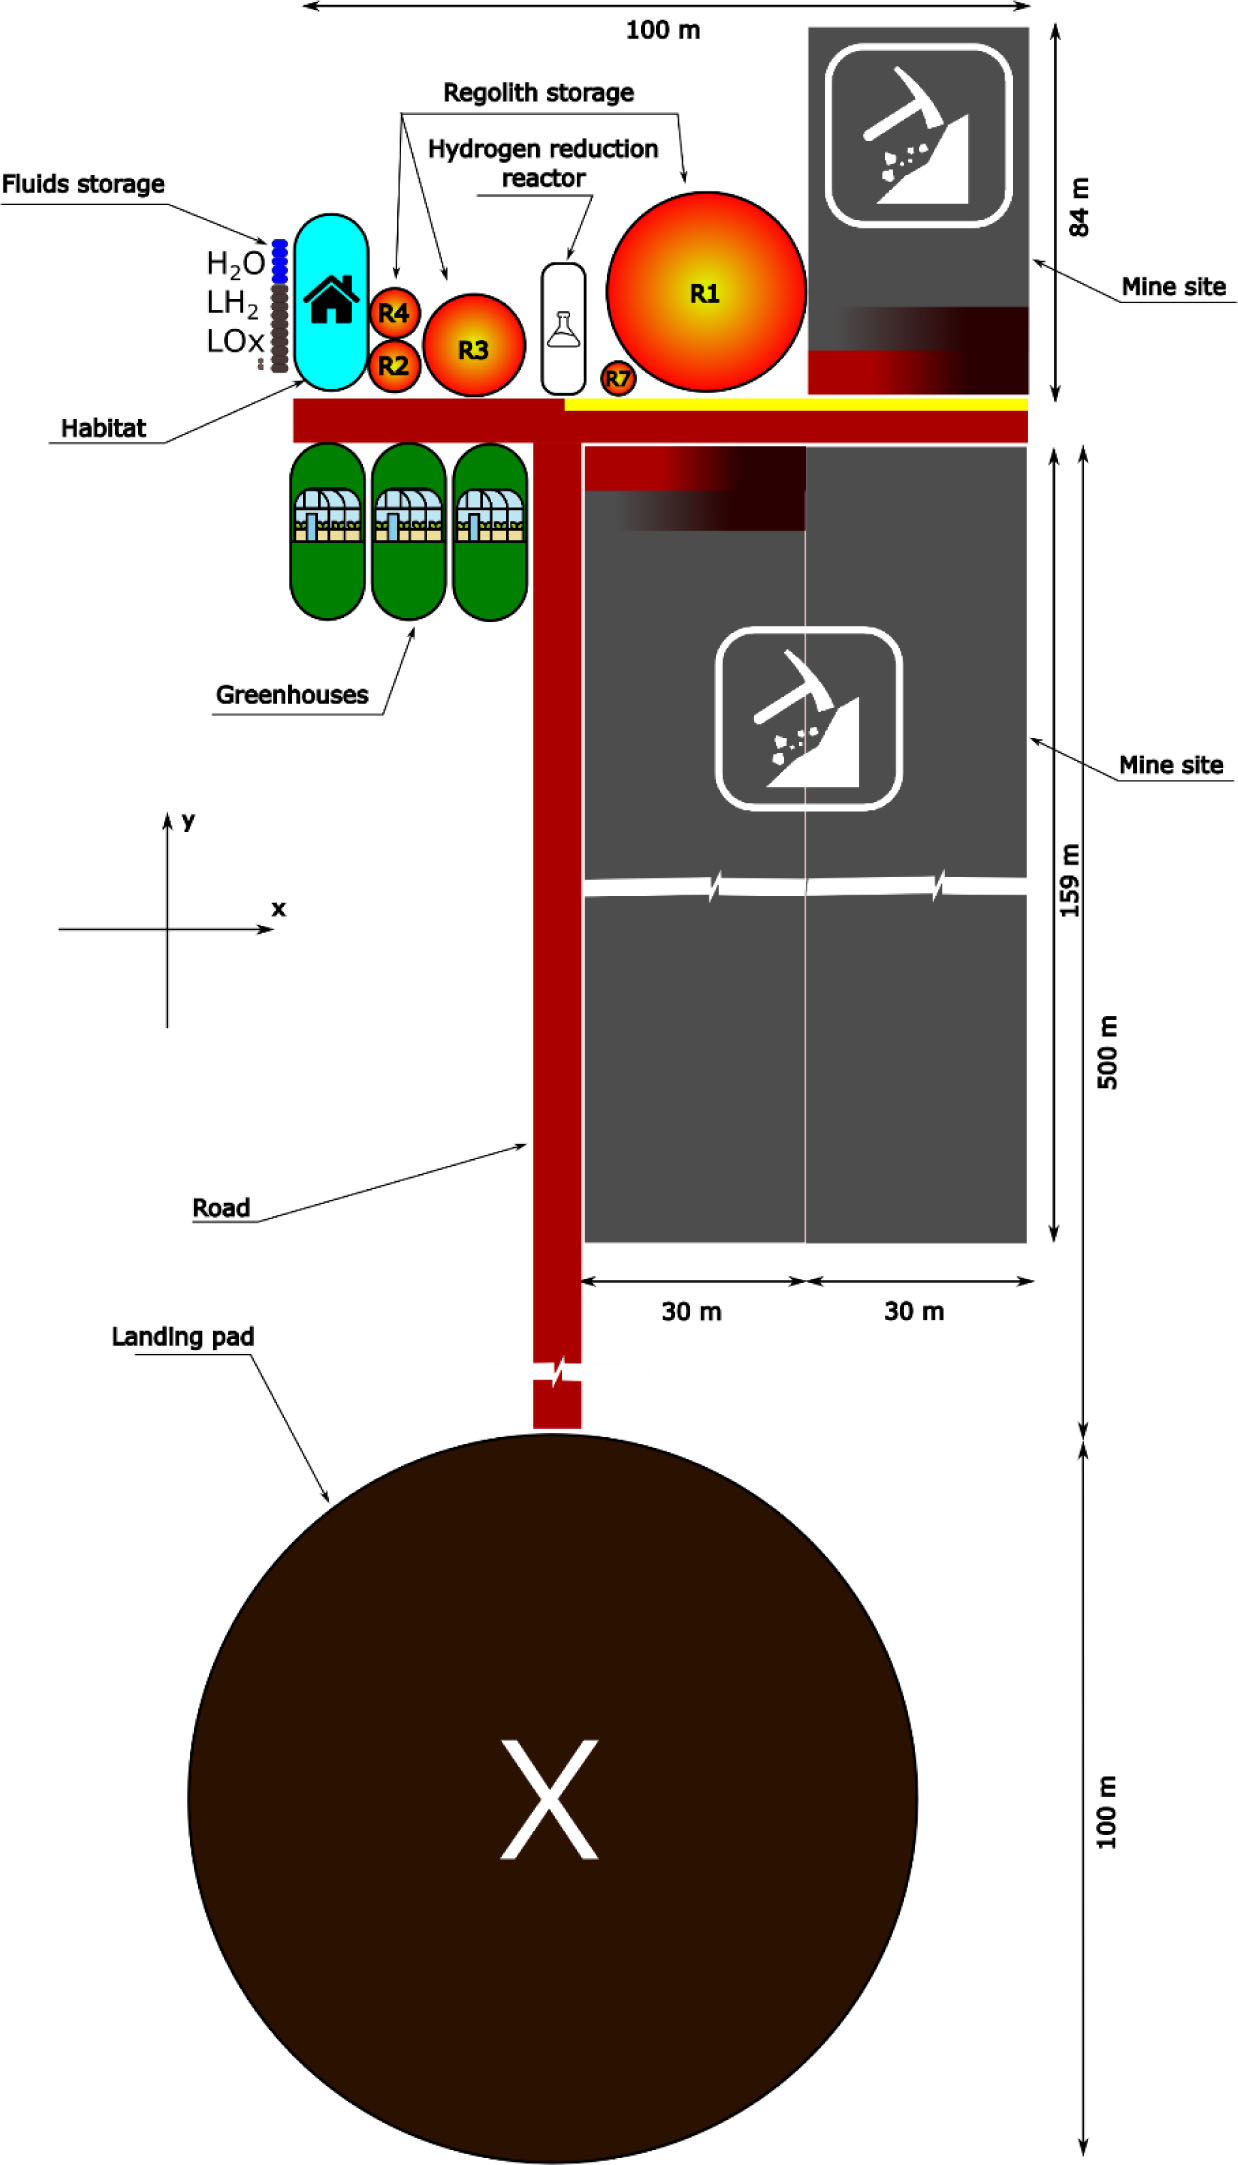
Figure 6.
Topology of the proposed open pit mine. Black rectangles describe the mine site, access ramps are indicated in red/black, red/yellow circles represent regolith storage, while blue and black dots show the storage of fluids. Rounded rectangles represent greenhouse (green), habitat (blue), and hydrogen reduction reactor (white) structures. Size of components are in geometrical scale.