
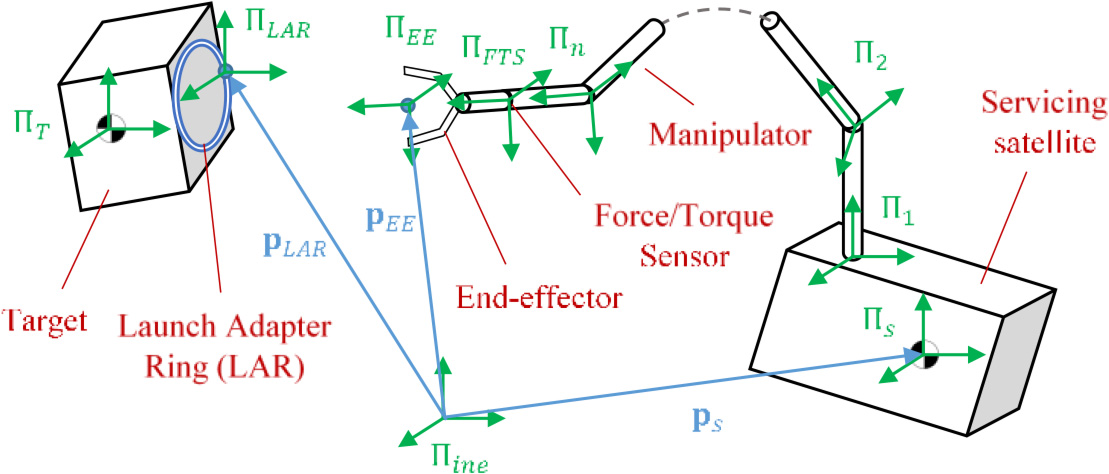
Figure 1.
Schematic view of the satellite-manipulator system
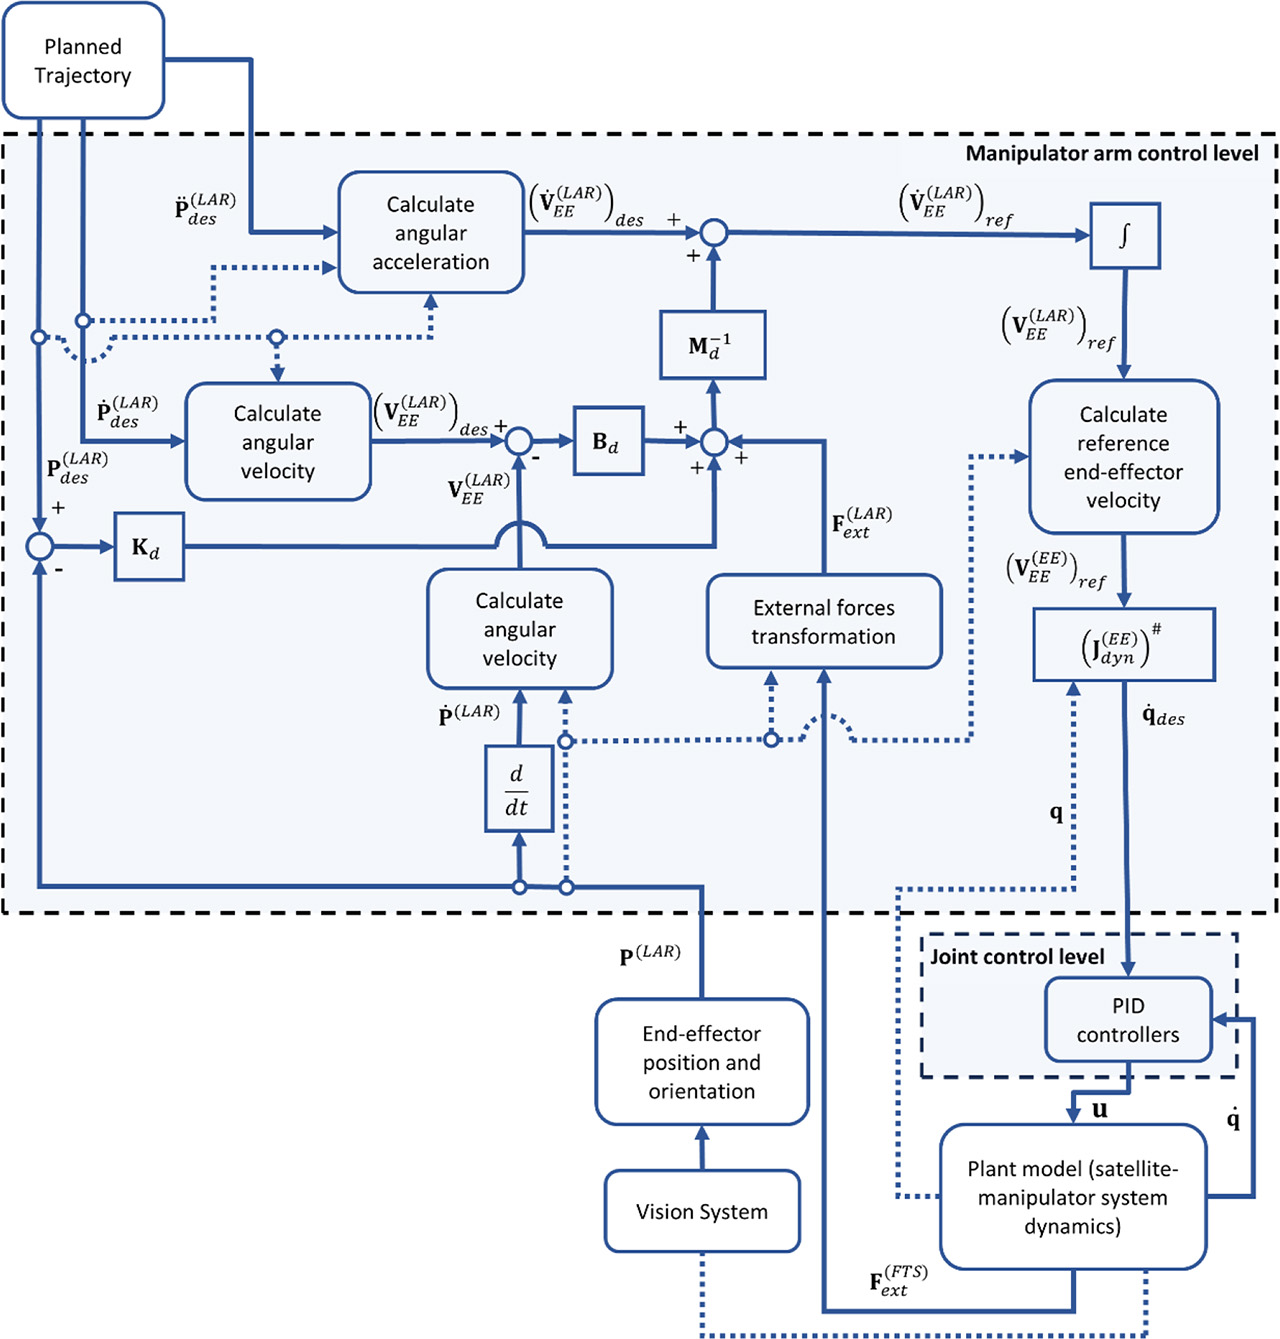
Figure 2.
Scheme of the active 6 DoF force/torque control algorithm (solid lines – input/output signals, dotted lines – dependencies/values required for calculation)
Table 1.
Denavit–Hartenberg parameters of the manipulator
| Link i | qi (rad) | λi (m) | Li (m) | αi (rad) |
|---|---|---|---|---|
| 1 | q1 + π/2 | 0.4 | 0 | π/2 |
| 2 | q2 + π/2 | −0.35 | 0 | π/2 |
| 3 | q3 | −0.3 | 0.6 | 0 |
| 4 | q4 | −0.35 | 0.35 | 0 |
| 5 | q5 | −0.3 | 0 | − π/2 |
| 6 | q6 + π/2 | 0.3 | 0 | π/2 |
| 7 | q7 | 0.25 | 0 | 0 |
| EE | 0 | 0.175 | 0 | 0 |
Table 2.
Link CoM positions and masses
| Link | X (m) | Y (m) | Z (m) | Mass (kg) |
|---|---|---|---|---|
| 1 | 0 | 0.3 | 0 | 15 |
| 2 | 0 | −0.25 | 0 | 13 |
| 3 | 0.3 | 0 | −0.2 | 18 |
| 4 | 0.25 | 0 | −0.35 | 10 |
| 5 | 0 | 0.2 | 0 | 8.5 |
| 6 | 0 | 0.25 | 0 | 10.5 |
| 7 | 0 | 0 | 0.1 | 5 |
| EE | 0 | 0 | 0.1 | 7 |
Table 3.
Link inertia properties
| Link | Ixx (kg m2) | Iyy (kg m2) | Izz (kg m2) | Ixy (kg m2) | Ixz (kg m2) | Iyz (kg m2) |
|---|---|---|---|---|---|---|
| 1 | 0.2 | 0.15 | 0.1 | 0 | 0 | 0 |
| 2 | 0.2 | 0.12 | 0.12 | 0 | 0 | 0 |
| 3 | 0.3 | 1 | 1 | 0 | 0.2 | 0 |
| 4 | 0.08 | 0.45 | 0.4 | 0 | 0.1 | 0 |
| 5 | 0.6 | 0.55 | 0.35 | 0 | 0 | 0 |
| 6 | 0.75 | 0.4 | 0.7 | 0 | 0 | 0 |
| 7 | 0.3 | 0.3 | 0.3 | 0 | 0 | 0 |
| EE | 0.09 | 0.05 | 0.12 | 0 | 0 | 0 |
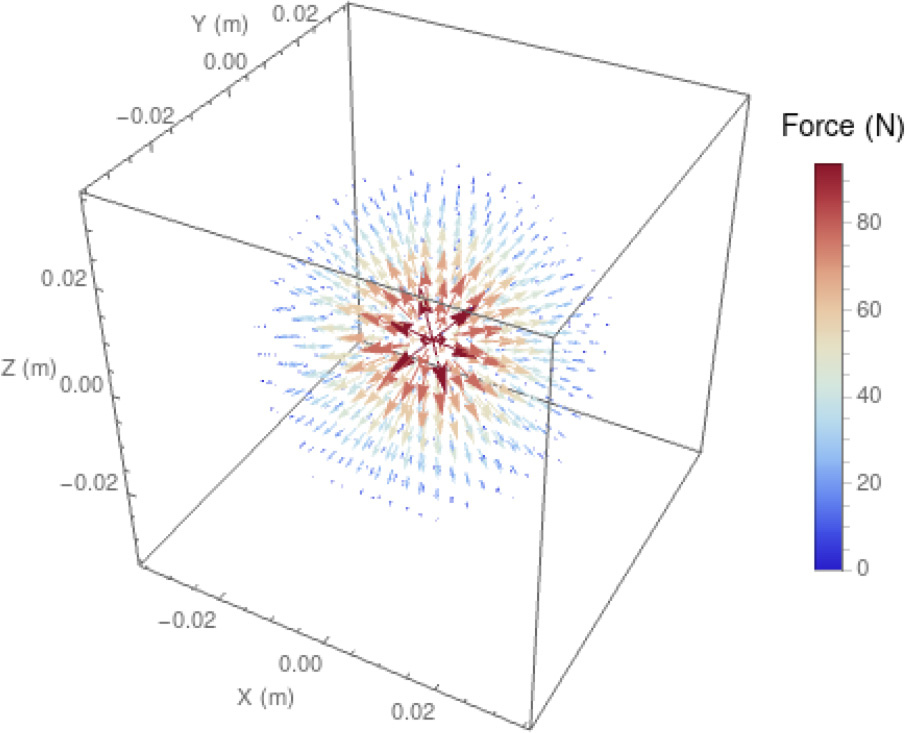
Figure 3.
Visualisation of the force sphere
Table 4.
PID controllers gains
| Joint | kp | ki | kd |
|---|---|---|---|
| 1 | 140 | 10 | 0.01 |
| 2 | 210 | 10 | 0.01 |
| 3 | 140 | 10 | 0.01 |
| 4 | 105 | 1 | 0.01 |
| 5 | 105 | 1 | 0.01 |
| 6 | 21 | 1 | 0.01 |
| 7 | 21 | 1 | 0.01 |
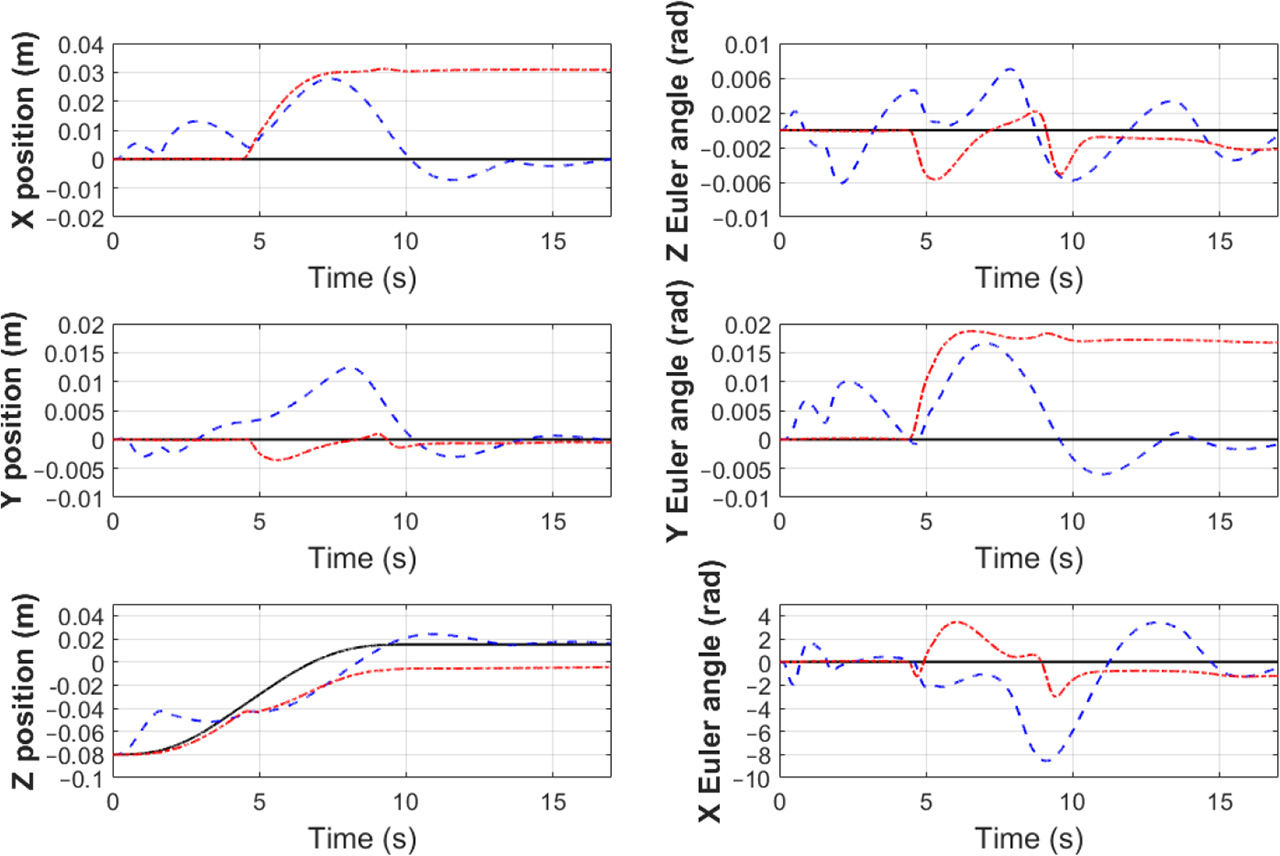
Figure 4.
End-effector positions and orientations with respect to the LAR frame (blue dashed line – active 6 DoF force/torque control, red dotted line – Cartesian control, black solid line – desired)
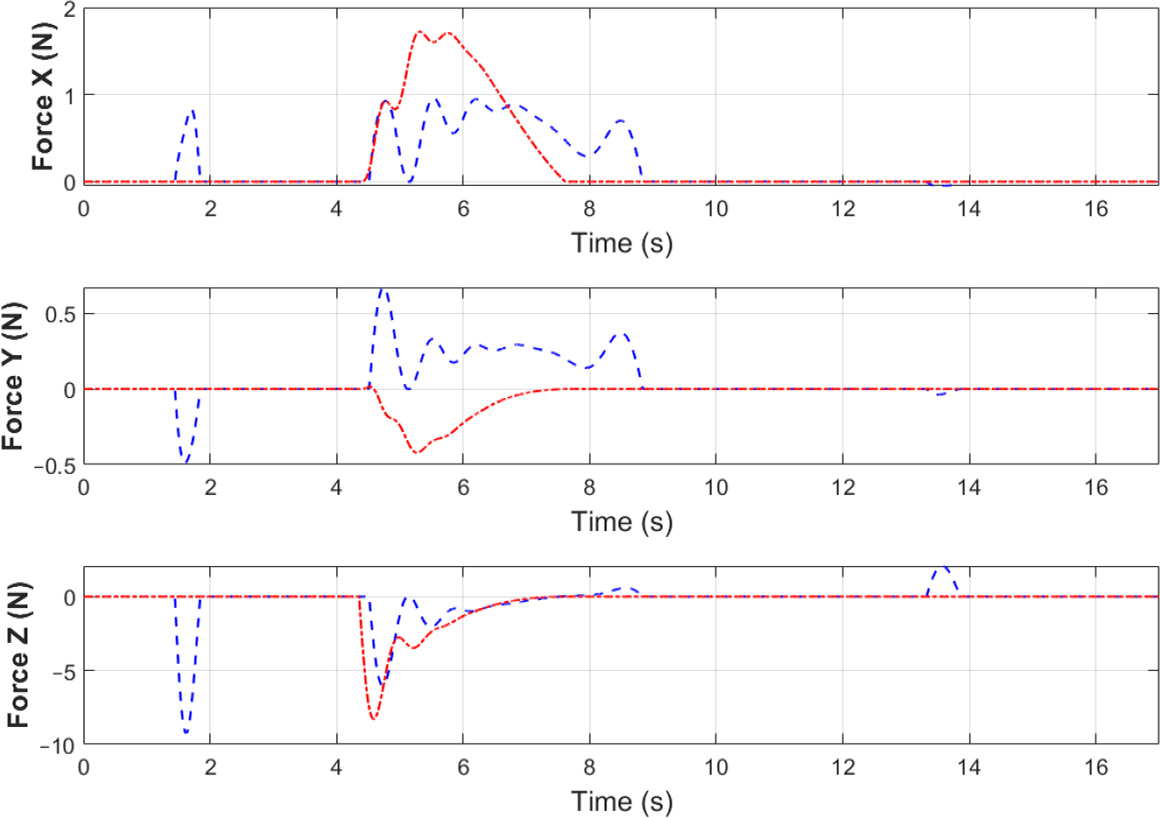
Figure 5.
External forces from the contact model (blue dashed line – active 6 DoF force/torque control, red dotted line – Cartesian control)
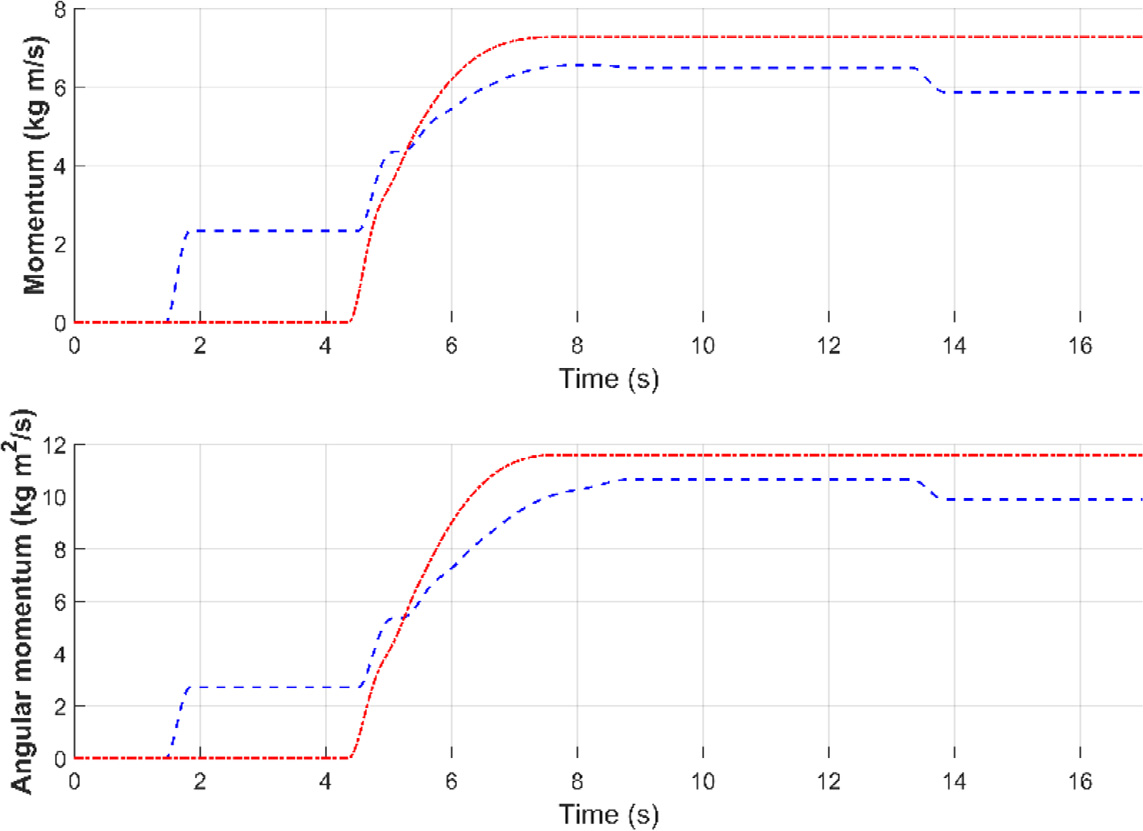
Figure 6.
Resultant values of momentum and angular momentum of the satellite-manipulator system (blue dashed line – active 6 DoF force/torque control, red dotted line – Cartesian control)
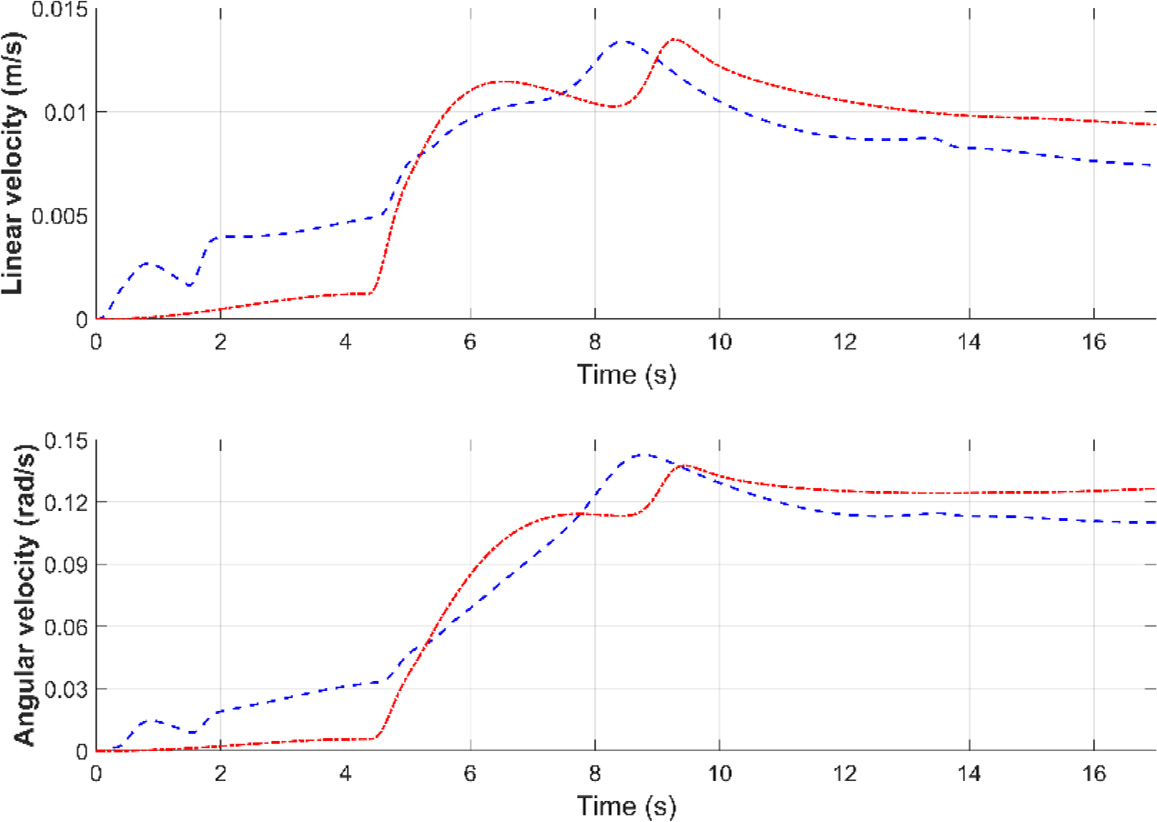
Figure 7.
Resultant values of servicing satellite velocities (blue dashed line – active 6 DoF force/torque control, red dotted line – Cartesian control)
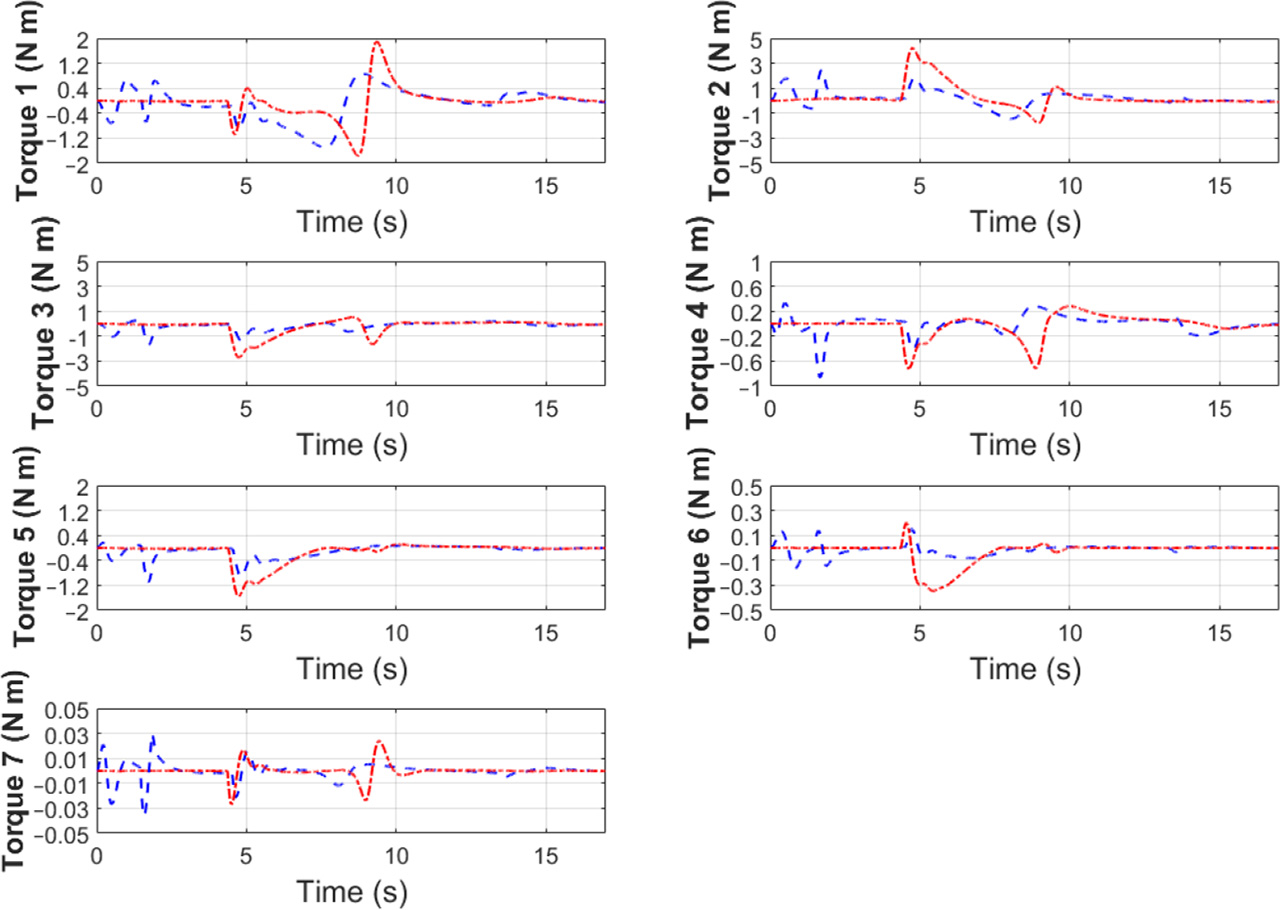
Figure 8.
Measured joint torques (blue dashed line – active 6 DoF force/torque control, red dotted line – Cartesian control)
Table 5.
Maximal values of measured joint torques
| Joint | Active 6 DoF force/torque control (N m) | Cartesian control (N m) |
|---|---|---|
| 1 | 1.50 | 1.89 |
| 2 | 2.45 | 4.21 |
| 3 | 1.68 | 2.72 |
| 4 | 0.86 | 0.72 |
| 5 | 1.10 | 1.55 |
| 6 | 0.17 | 0.35 |
| 7 | 0.036 | 0.027 |
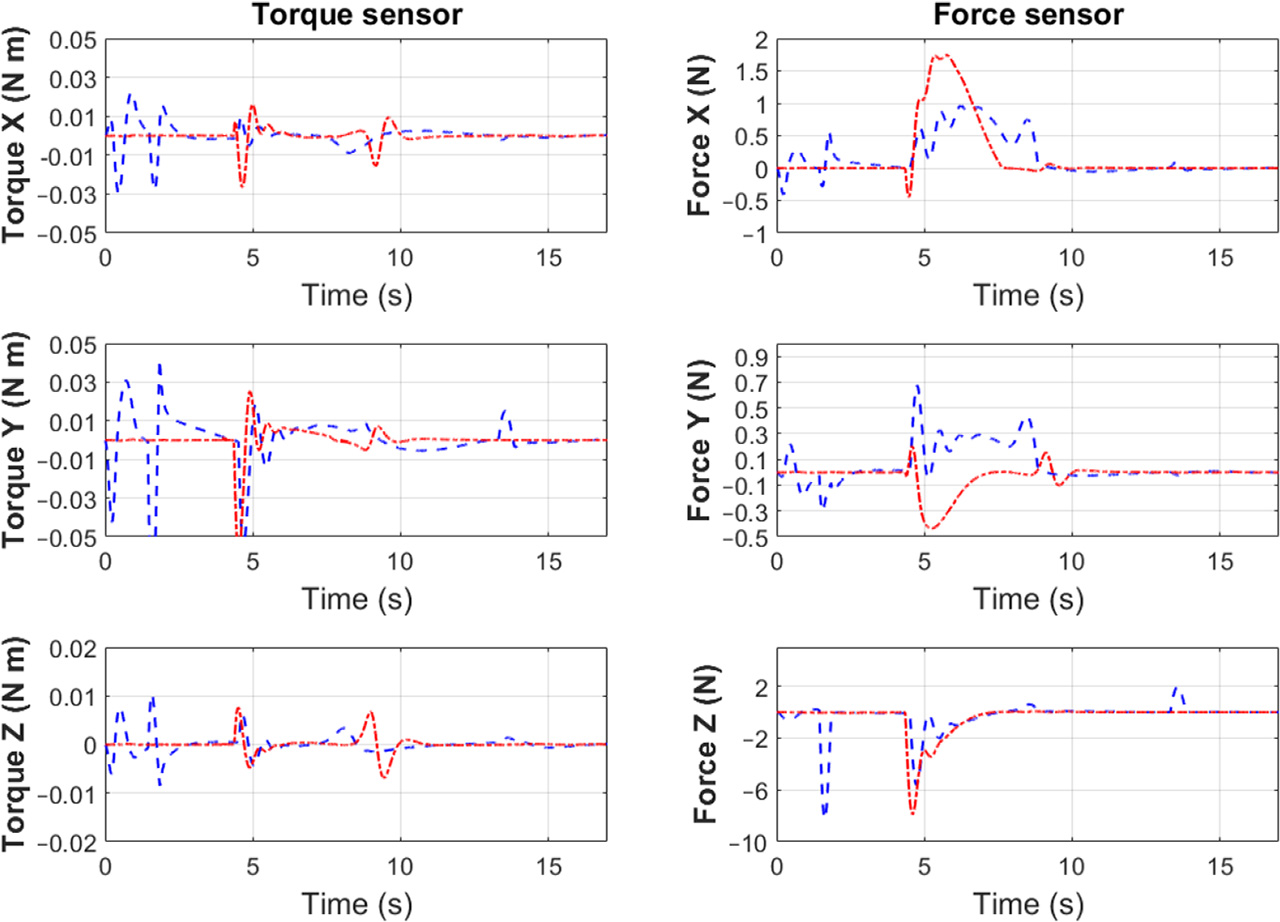
Figure 9.
Loads measured between the seventh link and the end-effector (blue dashed line – active 6 DoF force/torque control, red dotted line – Cartesian control)