
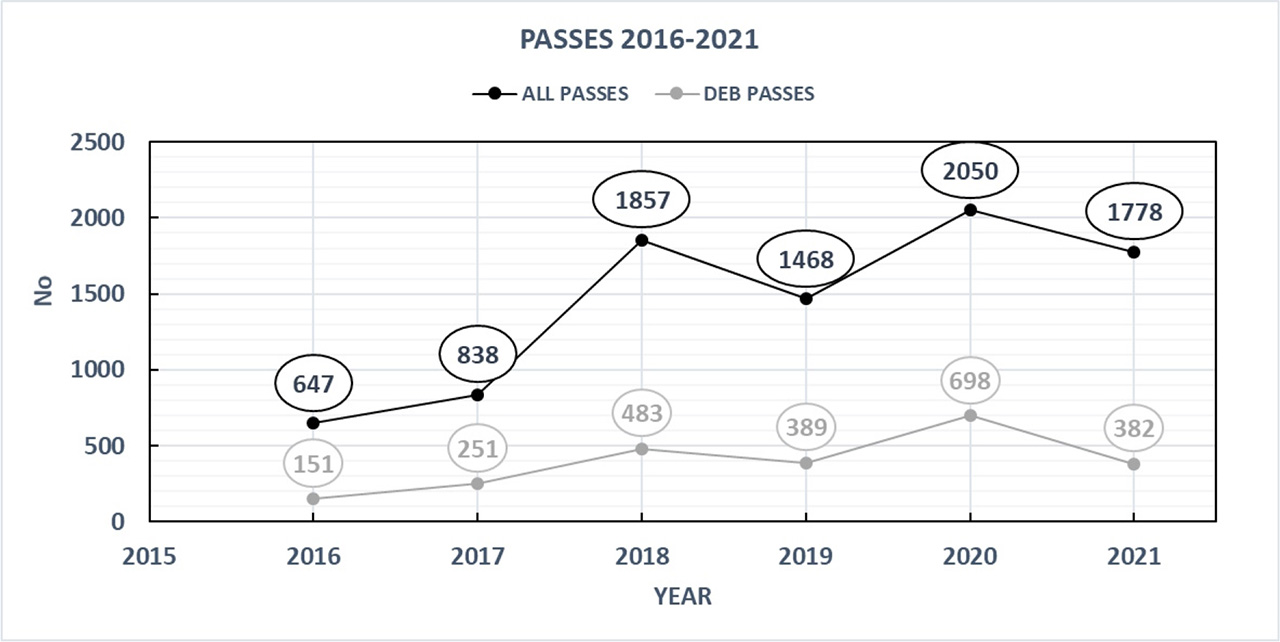
Figure 1.
Number of successful passes in years 2016–2021 registered by BORL sensor. The black line and labels represent all registered passes, including satellite and space debris. The gray line and labels show the number of successful passes specifically for space debris.
Table 1.
The basic parameters of the lasers used by the BORL sensor
| Laser | EKSPLA PL-2250 | Continuum Surelite III |
|---|---|---|
| Stand | Optical table | Optical table |
| Pulse width | 60 ps | 3–5 ns |
| Repetition rate | 10 Hz | 10 Hz |
| Pulse energy | 0.05 J | 0.45 J |
| Average power | 0.5 W | 4.5 W |
Table 2.
Basic physical and orbital parameters of CZ-2C’s 28480 and 31114
| Object | CZ-2C R/B | CZ-2C R/B |
|---|---|---|
| NORAD | 28480 | 31114 |
| COSPAR | 2004-046B | 2007-010B |
| Semi-major axis [km] | 7187 | 7207 |
| Eccentricity | 0.01447029 | 0.0058965 |
| Inclination [deg] | 98.05 | 98.37 |
| Height [m] | 8.4 | |
| Mass [kg] | 3800 | |
| Avg. cross section [m2] | 26.51 | |
Table 3.
The observational statistics for objects 28480 and 31114 from the years 2016 to 2022
| 28480 | 31114 | |||
|---|---|---|---|---|
| Laser | ns | ps | ns | ps |
| Passes | 25 | 90 | 33 | 230 |
| Avg. returns | 597 | 321 | 860 | 548 |
| Avg. pass RMS [cm] | 24.98 | 2.16 | 22.97 | 2.60 |
| Avg. RB [m] | 30.88 | 24.95 | −30.95 | −24.79 |
| Avg. TB [ms] | −117.65 | −120.01 | 6.78 | 3.34 |
Table 4.
Observational statistics for CZ-2C's 28480 and 31114 from 2017 to 2018
| NORAD | 28480 | 31114 | ||||||
|---|---|---|---|---|---|---|---|---|
| Year | Passes | Returns | Normal points | Mean pass RMS [cm] | Passes | Returns | Normal points | Mean pass RMS [cm] |
| 2017 | 36 | 17,830 | 259 | 8.67 | 56 | 49,335 | 502 | 9.37 |
| 2018 | 39 | 12,424 | 227 | 2.45 | 116 | 74,287 | 959 | 3.89 |
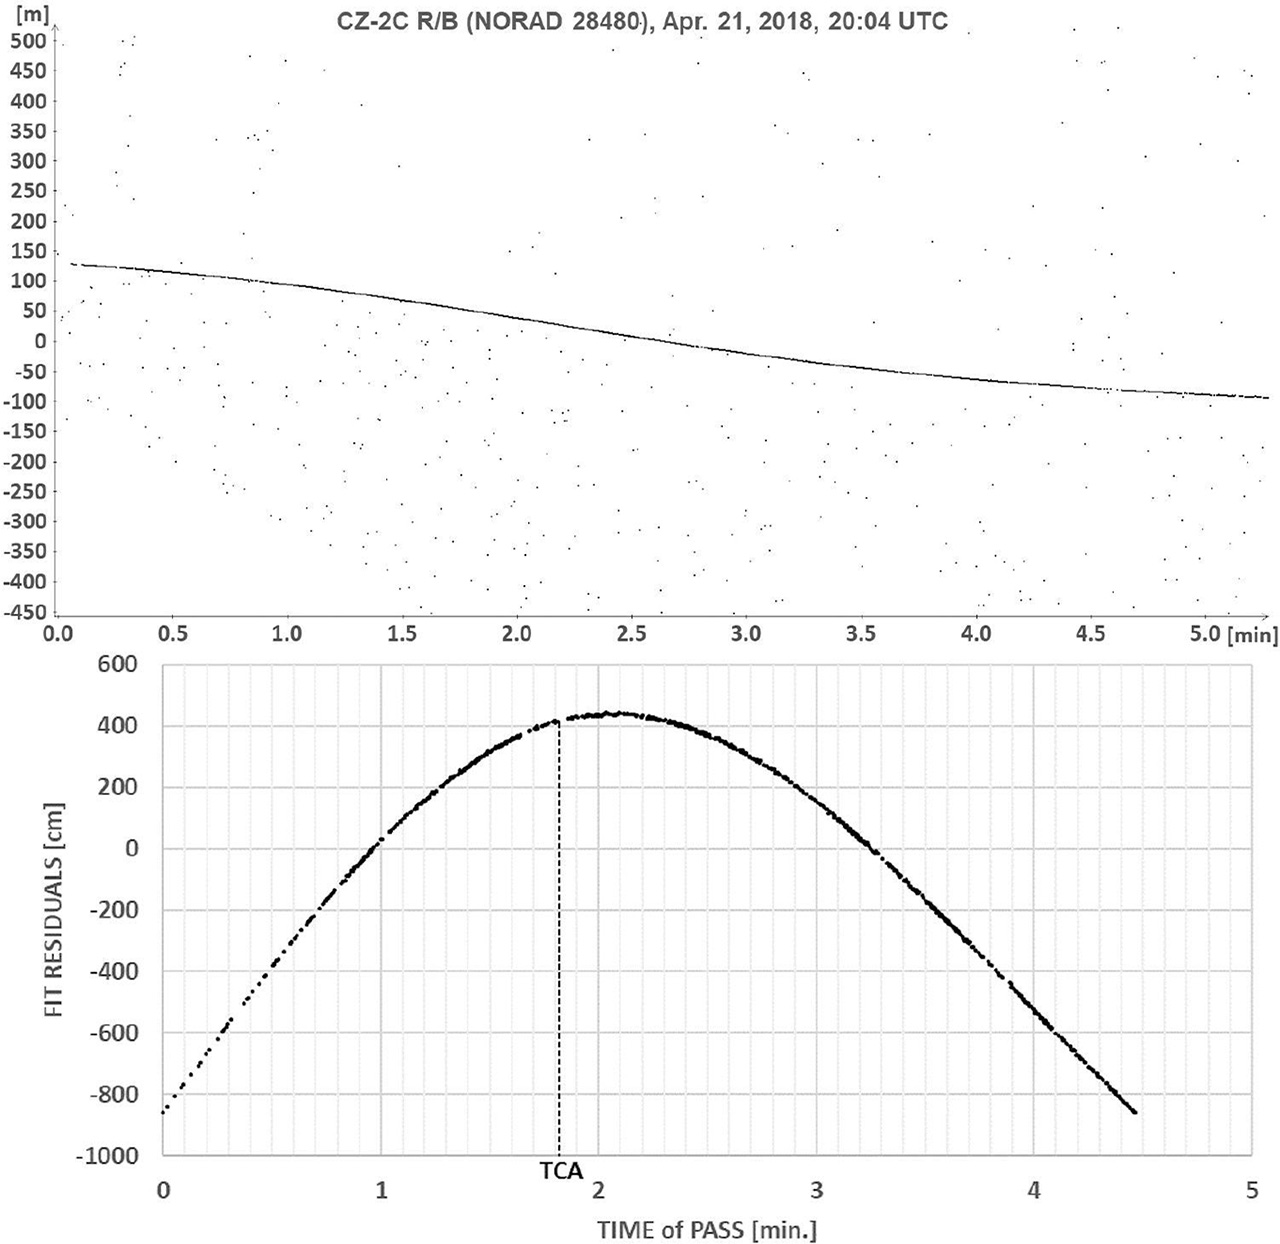
Figure 2.
Pass of CZ-2C R/B (NORAD 31114) registered by Polish laser sensor on August 3, 2018, 22:10 UTC, showing slant ranges (top) and fit residuals (bottom) with 1900 valid returns. TCA means the time of closest approach. The min. and max. distances to the target were 1083 and 1750 km, respectively.
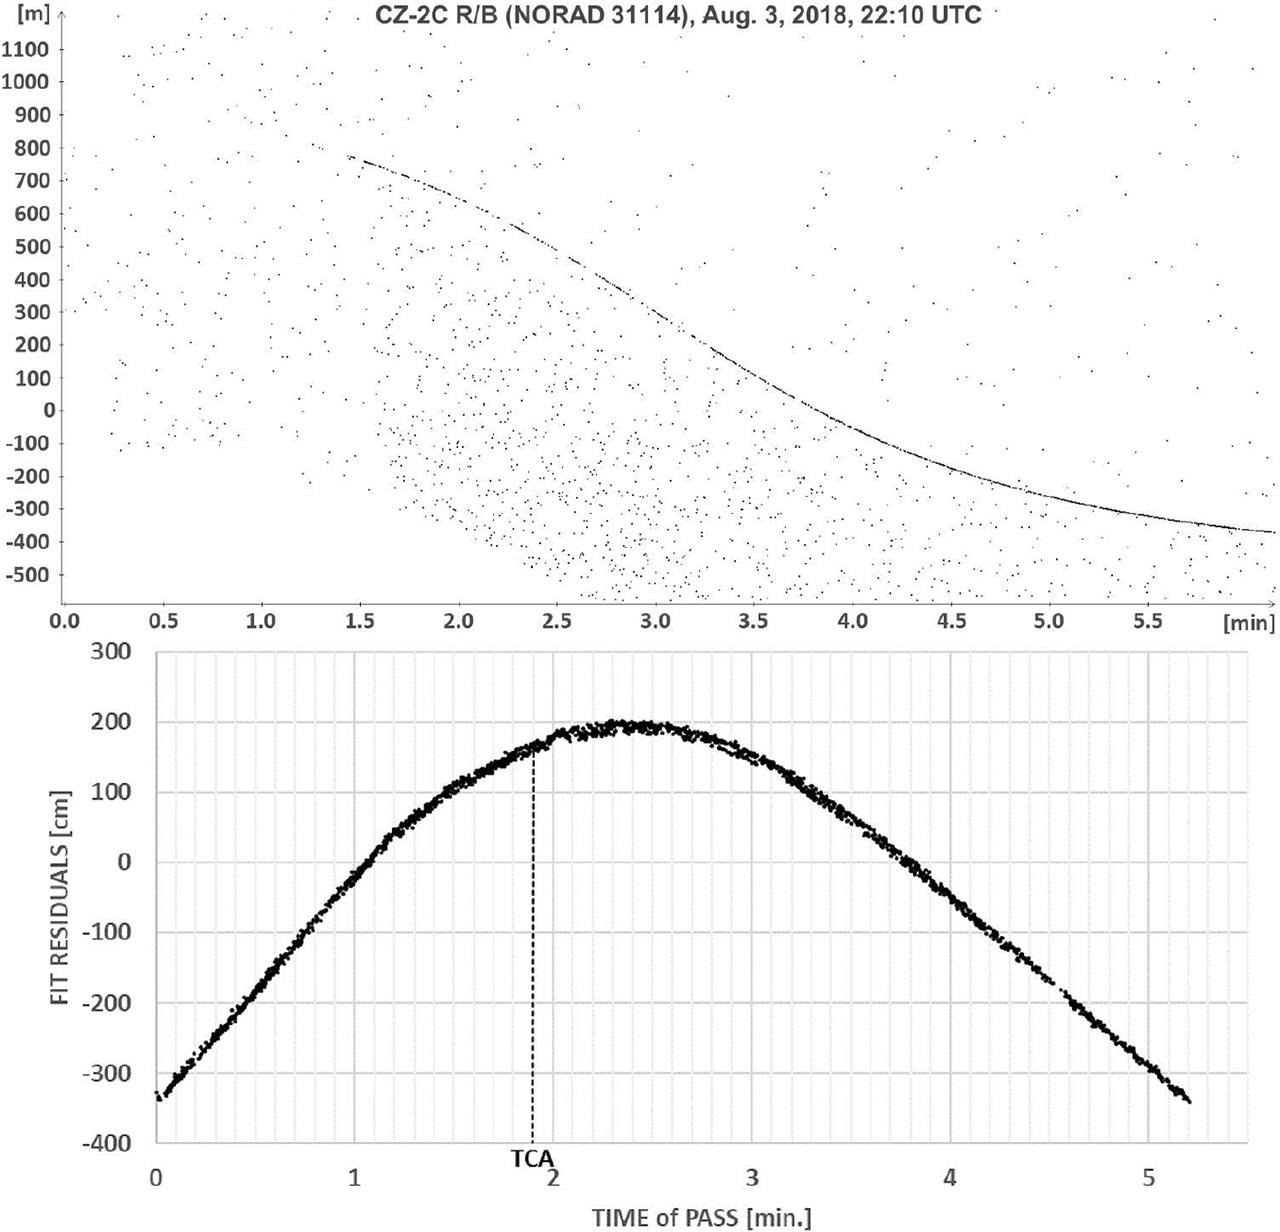
Figure 3.
Pass of CZ-2C R/B (NORAD 28480) registered by Polish laser sensor on April 21, 2018, 20:04 UTC, showing slant ranges (top) and fit residuals (bottom) with 869 valid returns. TCA means the time of closest approach (TCA). The min. and max. distances to the target were 1176 and 1621 km, respectively.
Table 5.
The list of observations of objects 28480 and 31114 taken into orbital computations
| Slot No. | Date [mm.dd.yyyy] | UTC time | Duration of meas. [mm:ss] | No. of Full-rate meas. | TB [ms] | RB [m] | Pass RMS [cm] |
|---|---|---|---|---|---|---|---|
| Object 28480 | |||||||
| 1 | 04.18.2018 | 21:19 | 00:38 | 56 | −116.94 | 39.42 | 2.93 |
| 04.19.2018 | 20:53 | 02:49 | 459 | −129.48 | −14.10 | 2.86 | |
| 04.20.2018 | 20:28 | 04:41 | 755 | −110.38 | −32.80 | 4.64 | |
| 04.21.2018 | 20:04 | 04:27 | 869 | −104.93 | 11.28 | 2.61 | |
| 04.21.2018 | 21:44 | 01:39 | 146 | −106.76 | 28.70 | 1.80 | |
| 2 | 10.10.2018 | 20:26 | 02:54 | 592 | −137.14 | 102.96 | 2.24 |
| 10.11.2018 | 20:02 | 05:18 | 305 | −130.51 | 21.83 | 1.89 | |
| 10.12.2018 | 19:38 | 03:38 | 184 | −121.54 | 10.15 | 2.62 | |
| Object 31114 | |||||||
| 3 | 05.29.2018 | 20:51 | 02:02 | 137 | −18.57 | 41.76 | 3.37 |
| 05.29.2018 | 22:28 | 05:39 | 1066 | 0.77 | −89.60 | 2.23 | |
| 05.30.2018 | 22:09 | 05:11 | 1362 | −19.37 | −42.73 | 3.60 | |
| 05.31.2018 | 21:50 | 07:35 | 1402 | 8.09 | −3.52 | 3.43 | |
| 4 | 08.01.2018 | 21:05 | 06:38 | 897 | 41.16 | −15.75 | 3.53 |
| 08.02.2018 | 22:29 | 03:52 | 313 | 23.33 | −17.54 | 1.98 | |
| 08.03.2018 | 22:10 | 05:12 | 1900 | −23.51 | −10.13 | 4.62 | |
Table 6.
The list of models and parameters used in orbital calculations
| Force and measurement models |
|
| Reference frame |
|
| Estimated parameters |
| Input state vector (six components + their deviations) determined at the beginning of the orbital arc-both Cartesian and Keplerian elements |
| Numerical integration |
|
Table 7.
RMSPOS, RMSVEL, and arc RMS determined for object 28480. Results for scenario No. 2 are highlighted with a gray background color.
| NR | SCE | RMSPOS [m] | RMSVEL [m/s] | Full-rate meas. | Arc RMS [cm] |
|---|---|---|---|---|---|
| 1 | sc1-1 | 528.98 | 1.3812 | 56 | 2.69 |
| 2 | sc1-2 | 503.00 | 1.0179 | 459 | 2.67 |
| 3 | sc1-3 | 512.91 | 0.9687 | 755 | 5.88 |
| 4 | sc1-4 | 528.11 | 0.9378 | 869 | 4.04 |
| 5 | sc1-5 | 547.04 | 1.2799 | 146 | 2.40 |
| 6 | sc1-6 | 506.83 | 1.0249 | 592 | 2.28 |
| 7 | sc1-7 | 507.84 | 0.9830 | 305 | 6.29 |
| 8 | sc1-8 | 527.77 | 0.9595 | 184 | 3.31 |
| 9 | sc2-1 | 528.98 | 1.3812 | 56 | 2.69 |
| 10 | sc2-2 | 186.48 | 1.0086 | 459 | 2.66 |
| 11 | sc2-3 | 242.63 | 0.5520 | 755 | 5.90 |
| 12 | sc2-4 | 328.32 | 0.7299 | 869 | 4.08 |
| 13 | sc2-5 | 360.28 | 1.1822 | 146 | 3.12 |
| 14 | sc2-6 | 506.83 | 1.0249 | 592 | 2.28 |
| 15 | sc2-7 | 371.21 | 0.8089 | 305 | 5.41 |
| 16 | sc2-8 | 238.79 | 0.6121 | 184 | 3.34 |
| 17 | sc3-1 | 528.98 | 1.3812 | 56 | 2.69 |
| 18 | sc3-2 | 89.78 | 0.5765 | 515 | 2.98 |
| 19 | sc3-3 | 5.04 | 0.0387 | 1270 | 176.99 |
| 20 | sc3-4 | 1.18 | 0.0066 | 2139 | 54.52 |
| 21 | sc3-5 | 0.62 | 0.0026 | 2285 | 94.33 |
| 22 | sc3-6 | 506.83 | 1.0249 | 592 | 2.28 |
| 23 | sc3-7 | 23.86 | 0.0943 | 897 | 5.75 |
| 24 | sc3-8 | 8.08 | 0.0256 | 1081 | 27.30 |
Table 8.
RMSPOS, RMSVEL, and arc RMS determined for object 31114. Results for scenario No. 2 are highlighted with a gray background color.
| NR | SCE | RMSPOS [m] | RMSVEL [m/s] | Full-rate meas. | Arc RMS [cm] |
|---|---|---|---|---|---|
| 1 | sc1-1 | 519.72 | 1.2512 | 137 | 3.99 |
| 2 | sc1-2 | 519.50 | 0.9371 | 1066 | 4.85 |
| 3 | sc1-3 | 517.37 | 0.9515 | 1362 | 5.03 |
| 4 | sc1-4 | 486.99 | 0.9245 | 1402 | 11.50 |
| 5 | sc1-5 | 495.13 | 0.9658 | 897 | 12.85 |
| 6 | sc1-6 | 523.72 | 0.9571 | 313 | 2.49 |
| 7 | sc1-7 | 648.47 | 0.5640 | 1900 | 5.53 |
| 8 | sc2-1 | 519.72 | 1.2513 | 137 | 3.93 |
| 9 | sc2-2 | 251.68 | 0.8691 | 1066 | 5.02 |
| 10 | sc2-3 | 356.22 | 0.7911 | 1362 | 5.01 |
| 11 | sc2-4 | 335.00 | 0.8601 | 1402 | 15.33 |
| 12 | sc2-5 | 495.10 | 0.9657 | 897 | 11.95 |
| 13 | sc2-6 | 341.95 | 0.7307 | 313 | 2.46 |
| 14 | sc2-7 | 453.61 | 0.3691 | 1900 | 5.53 |
| 15 | sc3-1 | 519.72 | 1.2512 | 137 | 3.99 |
| 16 | sc3-2 | 15.70 | 0.1132 | 1203 | 6.19 |
| 17 | sc3-3 | 1.39 | 0.0112 | 2565 | 110.55 |
| 18 | sc3-4 | 0.56 | 0.0041 | 3967 | 374.04 |
| 19 | sc3-5 | 495.13 | 0.9658 | 897 | 12.85 |
| 20 | sc3-6 | 41.84 | 0.1580 | 1210 | 14.45 |
| 21 | sc3-7 | 2.02 | 0.0073 | 3110 | 131.05 |
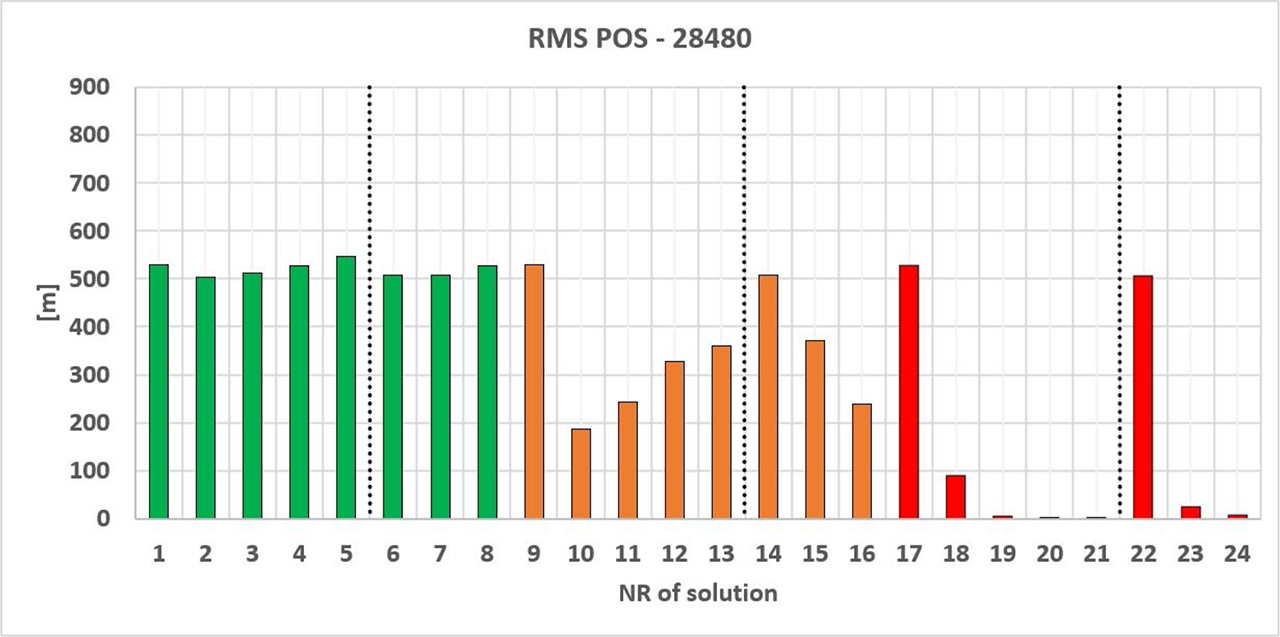
Figure 4.
RMPOS determined for object 28480. The dotted line separates observational slots for object 28480. Slots are described in Table 5. The results obtained for scenarios 1, 2, and 3 are shown by the colors green, orange, and red, respectively.
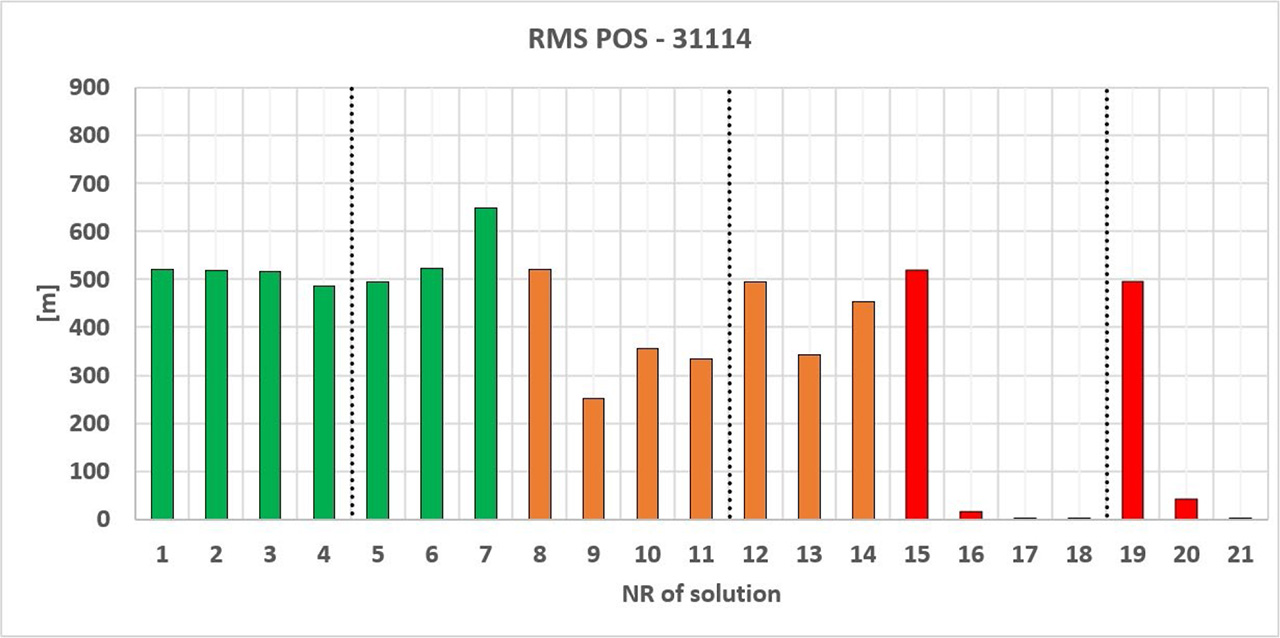
Figure 5.
RMPOS determined for object 31114. The dotted line separates observational slots for object 31114. Slots are described in Table 5. The results obtained for scenarios 1, 2, and 3 are shown by the colors green, orange, and red, respectively.
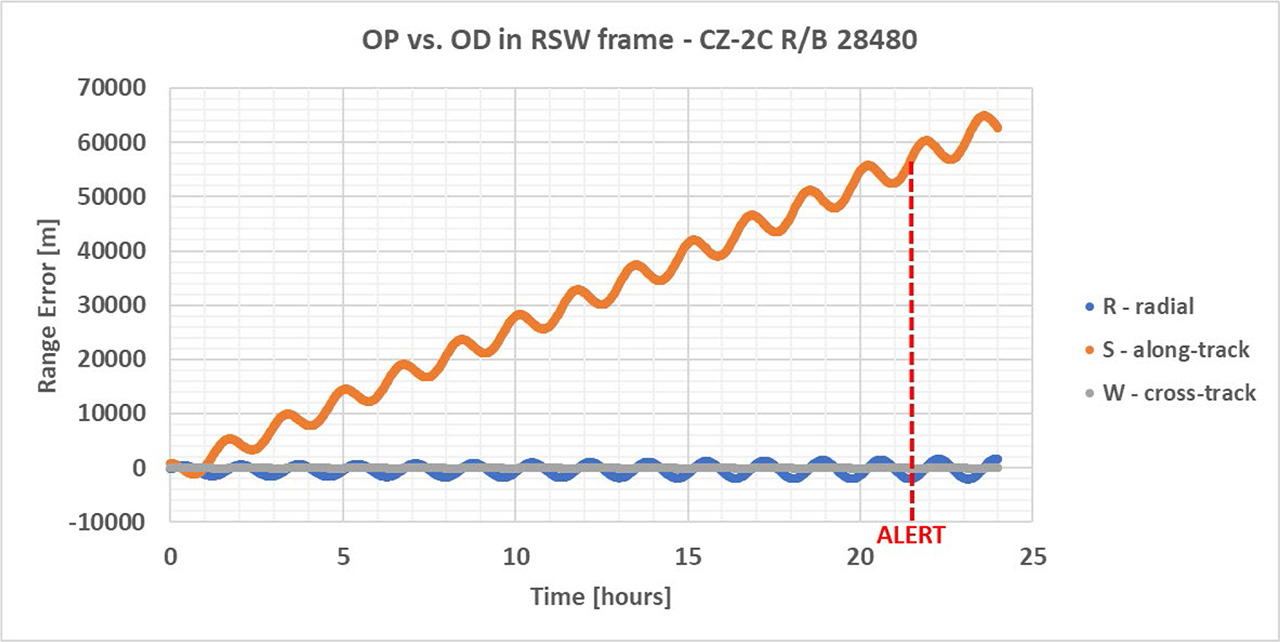
Figure 6.
The sample results show the range errors in the RSW system for Scenario sc1-1 (object 28480). The red broken line indicates the determined alert time.
Table 9.
The alert time and the 3-sigma range error of RSW components for object 28480. Results for scenario No. 2 are highlighted with a gray background color.
| Alerttime [s] | SCE | 3-sigma range error R [m] | 3-sigma range error S [m] | 3-sigma range error W [m] |
|---|---|---|---|---|
| 77,160 | sc1-1 | 3105.67 | 56,194.05 | 210.34 |
| 75,540 | sc1-2 | 472.38 | 18,206.11 | 138.15 |
| 76,080 | sc1-3 | 459.26 | 25,574.61 | 753.82 |
| 76,020 | sc1-4 | 305.54 | 4150.10 | 1016.30 |
| 77,160 | sc1-5 | 2366.66 | 42,412.72 | 414.71 |
| 69,000 | sc1-6 | 927.51 | 20,229.23 | 287.22 |
| 86,400 | sc1-7 | 184.05 | 6558.61 | 676.77 |
| 69,180 | sc1-8 | 647.79 | 16,555.54 | 1231.71 |
| 77,160 | sc2-1 | 3100.32 | 56,100.60 | 210.12 |
| 76,080 | sc2-2 | 1833.24 | 81,233.78 | 3107.26 |
| 76,440 | sc2-3 | 1304.10 | 39,701.68 | 7863.85 |
| 76,320 | sc2-4 | 1270.35 | 37,543.63 | 2969.35 |
| 77,400 | sc2-5 | 2717.97 | 40,404.66 | 605.94 |
| 69,000 | sc2-6 | 927.51 | 20,229.23 | 287.22 |
| 75,600 | sc2-7 | 2356.37 | 102,477.05 | 5203.18 |
| 75,660 | sc2-8 | 1376.67 | 64,128.16 | 8125.32 |
| 77,100 | sc3-1 | 3095.06 | 56,285.17 | 214.53 |
| 148,200 | sc3-2 | 418.69 | 15,744.07 | 685.10 |
| 69,960 | sc3-3 | 222.22 | 7889.42 | 652.46 |
| 68,940 | sc3-4 | 336.70 | 7815.63 | 853.14 |
| 63,480 | sc3-5 | 347.78 | 7830.87 | 1106.28 |
| 69,000 | sc3-6 | 929.04 | 20,281.01 | 292.12 |
| 68,100 | sc3-7 | 757.92 | 10,287.96 | 943.96 |
| 63,600 | sc3-8 | 1175.77 | 10,441.24 | 1052.57 |
Table 10.
The alert time and the 3-sigma range error of RSW components for object 31114. Results for scenario No. 2 are highlighted with a gray background color.
| Alert time [s] | SCE | 3-sigma range error R [m] | 3-sigma range error S [m] | 3-sigma range error W [m] |
|---|---|---|---|---|
| 78,180 | sc1-1 | 112.61 | 4386.70 | 164.48 |
| 75,780 | sc1-2 | 293.66 | 35,828.80 | 782.60 |
| 79,500 | sc1-3 | 157.70 | 1525.23 | 610.29 |
| 75,660 | sc1-4 | 15960.54 | 431,936.22 | 17,428.61 |
| 76,260 | sc1-5 | 4164.90 | 171,254.88 | 2219.53 |
| 75,240 | sc1-6 | 158.07 | 7147.91 | 492.29 |
| 62,880 | sc1-7 | 198.07 | 1214.40 | 955.42 |
| 83,700 | sc2-1 | 207.15 | 3329.70 | 181.66 |
| 78,240 | sc2-2 | 202.01 | 3894.75 | 913.07 |
| 78,360 | sc2-3 | 132.43 | 4515.85 | 780.22 |
| 75,720 | sc2-4 | 6517.98 | 266,437.84 | 13,800.13 |
| 76,200 | sc2-5 | 6280.38 | 231,564.70 | 3208.94 |
| 76,440 | sc2-6 | 542.69 | 20,509.42 | 1561.46 |
| 57,180 | sc2-7 | 200.46 | 1144.53 | 983.61 |
| 78,180 | sc3-1 | 112.62 | 4385.22 | 164.49 |
| 75,120 | sc3-2 | 400.59 | 21,401.25 | 7262.87 |
| 74,940 | sc3-3 | 254.22 | 11,002.82 | 585.79 |
| 57,180 | sc3-4 | 2621.07 | 12,134.63 | 586.38 |
| 76,260 | sc3-5 | 4164.94 | 171,255.84 | 2219.54 |
| 77,760 | sc3-6 | 803.40 | 14,323.83 | 9480.79 |
| 70,860 | sc3-7 | 706.13 | 13,450.79 | 805.29 |
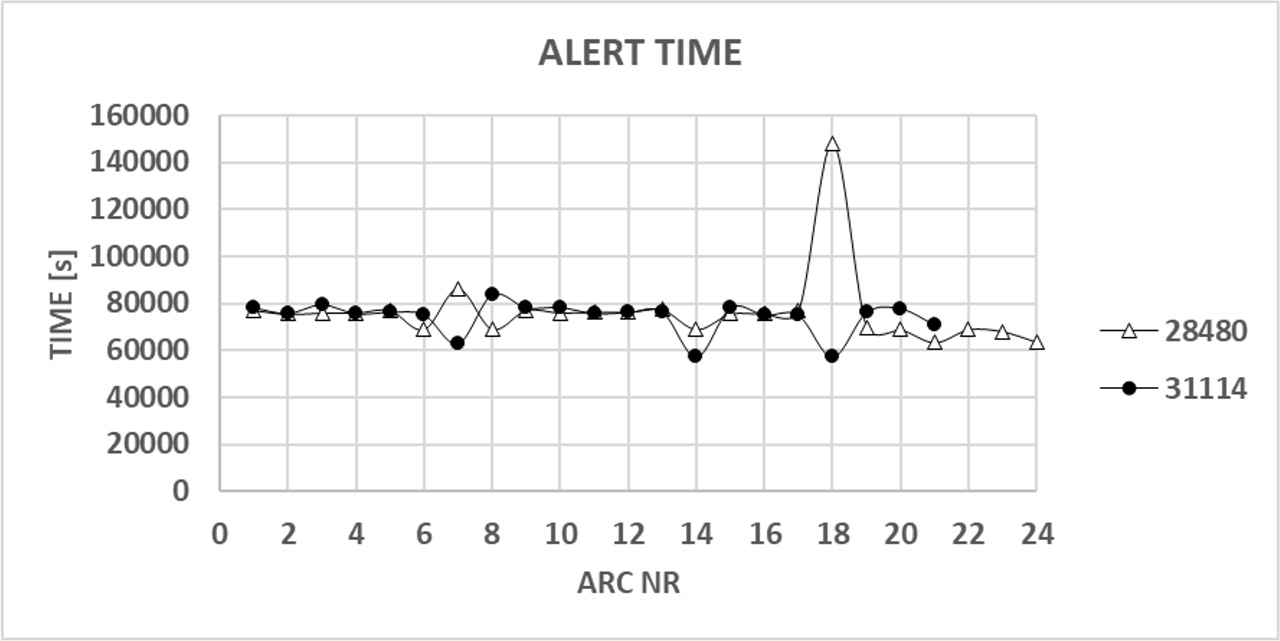
Figure 7.
The alert times for objects 28480 and 31114
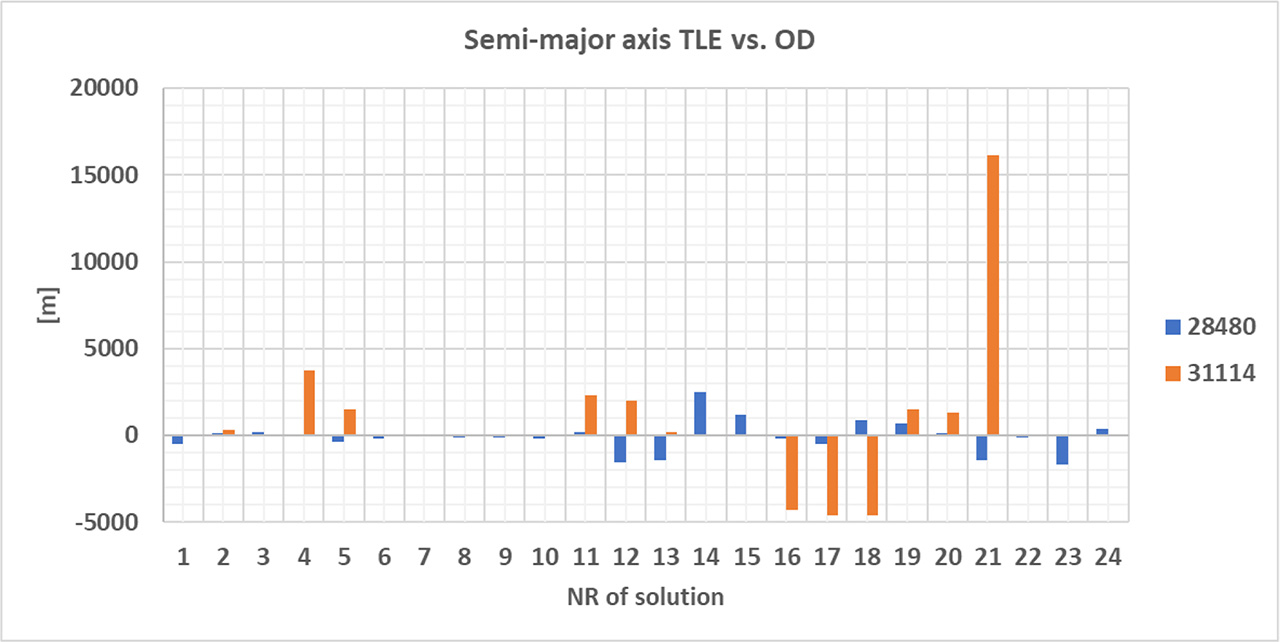
Figure 8.
The results of comparing the semi-major axis determined using TLE ephemeris and laser measurements
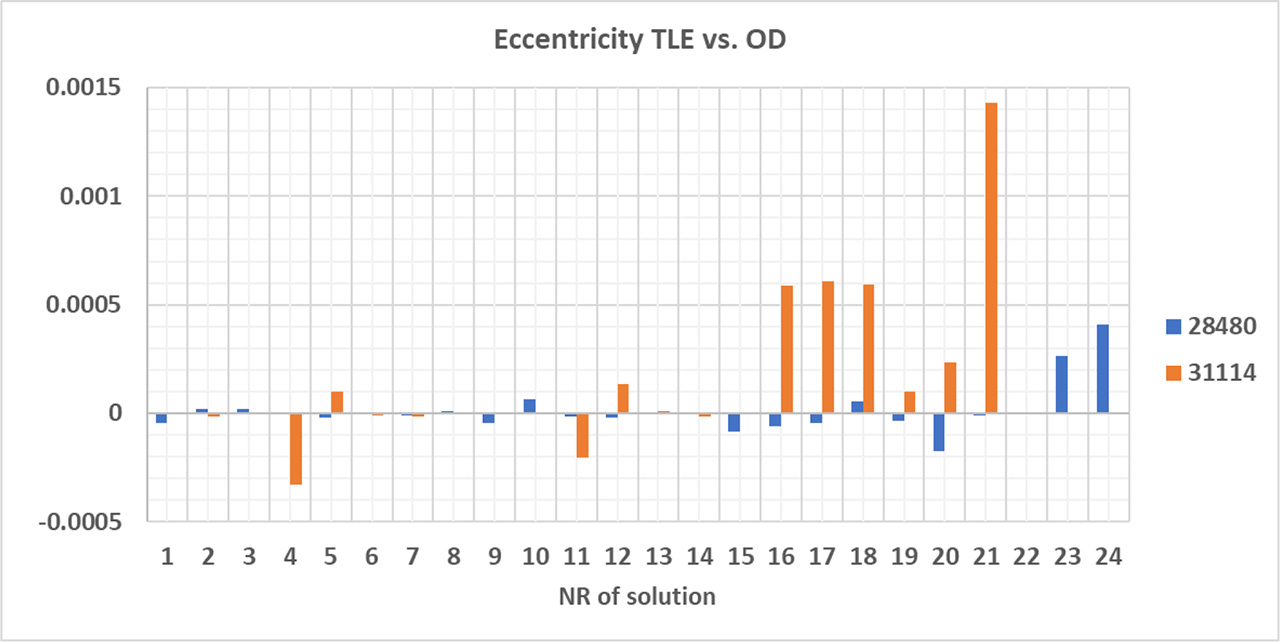
Figure 9.
The results of comparing the eccentricity axis determined using TLE ephemeris and laser measurements