
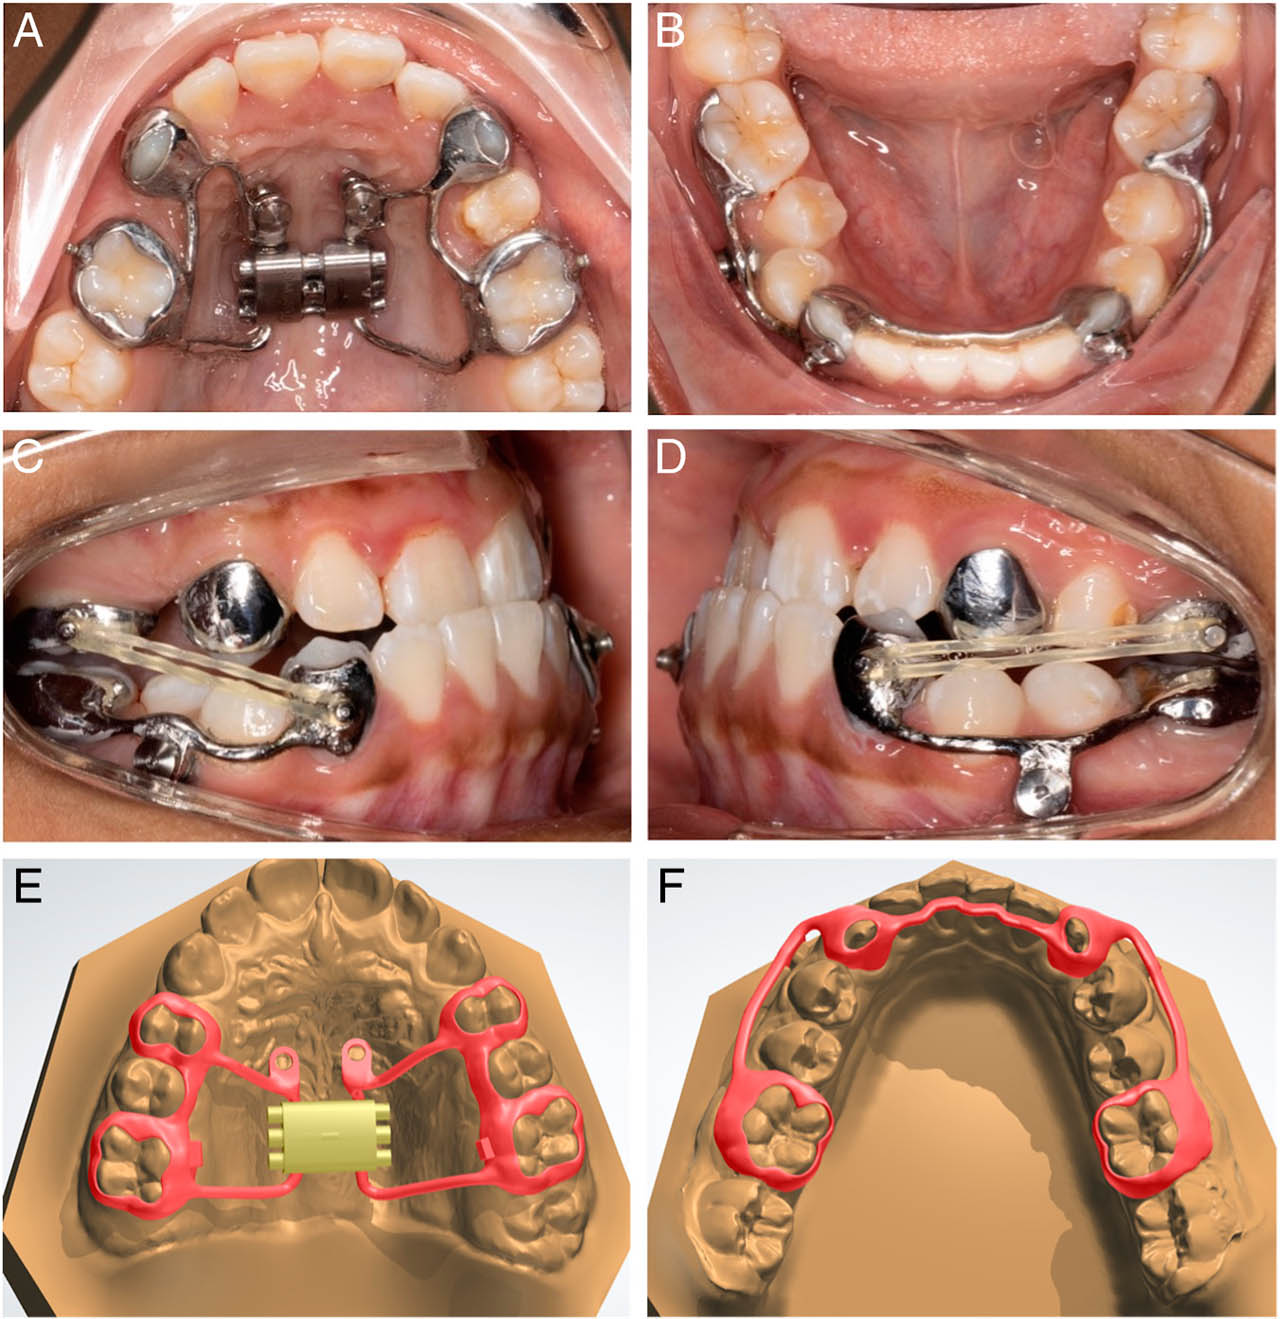
Figure 1.
(A) and (B), Intra-oral maxillary and mandibular frameworks. An alternative maxillary framework design is presented in this patient, modified for the eruption status and hypomineralization of the premolar; (C) and (D), Class III elastics between traction buttons in the same patient; (E) and (F), Typical CAD-CAM design of the maxillary and mandibular frameworks, in another patient.
Table I.
Baseline characteristics and pre-treatment cephalometric variables of included subjects
| Variables | MAMPMean (±SD) | MAMPMin | MAMPMax | BAC3EMean (±SD) | BAC3EMin | BAC3EMax | ControlMean (±SD) | ControlMin | ControlMax |
|---|---|---|---|---|---|---|---|---|---|
| Gender (F/M) | 7/4 | 7/4 | 7/4 | ||||||
| Age (years) | 11.7 (±0.7) | 11.8 (±0.9) | 11.8 (±0.7) | ||||||
| Duration of treatment/observation (months) | 9.6 (±1.9) | 12.1 (±1.4) | 12.0 (±0.0) | ||||||
| SNA (°) | 79.0 (±2.7) | 71.2 | 80.6 | 80.7 (±3.4) | 74.5 | 83.8 | 80.0 (±3.5) | 73.1 | 84.6 |
| Co-A (mm) | 76.6 (±5.8) | 66.1 | 86.8 | 86.0 (±3.1) | 81.8 | 91.8 | 78.5 (±4.5) | 70.8 | 86.6 |
| SNB (°) | 81.2 (±3.4) | 71.8 | 83.8 | 80.7 (±3.2) | 75.4 | 86.4 | 81.2 (±3.4) | 75.6 | 88.1 |
| Co-Gn (mm) | 110.8 (±8.0) | 97.3 | 123.3 | 113.2 (±3.4) | 105.4 | 118.2 | 107.1 (±6.5) | 101.1 | 121.9 |
| ANB (°) | −2.2 (±1.5) | −0.5 | −5.4 | 0.1 (±1.7) | −2.6 | 3.1 | −1.2 (±3.0) | −8.0 | 1.6 |
| Wits (mm) | −3.7 (±1.3) | −2.0 | −5.7 | −6.7 (±2.6) | −3.7 | −11.5 | −4.7 (±2.7) | −1.8 | −10.0 |
| Mx-Md differential (mm) | 34.2 (±3.2) | 29.1 | 38.8 | 27.2 (±3.7) | 22.8 | 33.6 | 26.0 (±4.8) | 23.1 | 36.0 |
| SN-ML (°) | 35.4 (±3.9) | 27.2 | 42.4 | 33.6 (±3.7) | 27.3 | 39.9 | 33.8 (±5.3) | 22.4 | 39.7 |
| PP-ML (°) | 25.1 (±3.7) | 17.8 | 30.5 | 24.7 (±4.1) | 19.6 | 32.1 | 25.6 (±5.6) | 14.3 | 32.2 |
| ANS-Menton (mm) | 58.6 (±5.0) | 48.6 | 66.1 | 63.9 (±4.5) | 58.1 | 72.4 | 59.6 (±5.7) | 50.9 | 69.6 |
| U1-PP (°) | 118.3 (±6.8) | 107.3 | 130.2 | 116.5 (±6.9) | 106.1 | 133.5 | 115.0 (±9.2) | 99.3 | 126.9 |
| L1-ML (°) | 85.0 (±6.3) | 73.3 | 93.0 | 88.0 (±8.0) | 73.5 | 101.4 | 82.4 (±7.1) | 72.4 | 93.8 |
Table II.
T0-T1 treatment effect and comparisons for MAMP, BAC3E, and negative controls. (Statistics: ANOVA and post-hoc Tukey tests)
| Variables | MAMP (n=11) | BAC3E (n=11) | Negative control (n=11) | P-value between all groups | |||
|---|---|---|---|---|---|---|---|
| Maxillary skeletal | Mean (±SD) | P-value | Mean (±SD) | P-value vs. MAMP | Mean (±SD) | P-value vs. MAMP | |
| SNA (°) | 2.5 (±1.1) | P<0.001* | 2.7 (±2.3) | P=0.970 | 0 (±0.7) | P<0.001* | P<0.001* |
| Co-A (mm) | 2.4 (±1.1) | P<0.001* | 5.4 (±2.0) | P<0.001* | 1.3 (±0.8) | P=0.194 | P<0.001* |
| Mandibular skeletal | |||||||
| SNB (°) | −0.1 (±0.7) | P=0.578 | −0.4 (±1.5) | P=0.750 | 0.3 (±0.5) | P=0.553 | P=0.220 |
| Co-Gn (mm) | 0.8 (±1.5) | P=0.100 | 1.7 (±0.5) | P=0.248 | 2.6 (±1.6) | P=0.008* | P=0.001* |
| Maxillary/Mandibular | |||||||
| ANB (°) | 2.7 (±1.5) | P<0.001* | 3.1 (±1.7) | P=0.711 | −0.3 (±0.4) | P<0.001* | P<0.001* |
| Wits (mm) | 4.0 (±1.5) | P<0.001* | 4.2 (±3.4) | P=0.970 | −0.6 (±0.8) | P<0.001* | P<0.001* |
| Mx-Md Differential (mm) | −1.5 (±1.7) | P=0.012* | −3.7 (±1.8) | P=0.011* | 1.3 (±1.3) | P<0.001* | P<0.001* |
| Vertical skeletal | |||||||
| SN-ML (°) | −0.6 (±0.8) | P=0.027* | −0.8 (±2.3) | P=0.947 | −0.2 (±1.1) | P=0.821 | P=0.653 |
| PP-ML (°) | 0.0 (±1.3) | P=0.945 | 1.6 (±2.7) | P=0.098 | 0.3 (±0.8) | P=0.890 | P=0.095 |
| ANS-Menton (mm) | 1.7 (±1.1) | P<0.001* | 1.6 (±2.6) | P=0.978 | 1.3 (±0.9) | P=0.872 | P=0.882 |
| Sagittal dentoalveolar | |||||||
| U1-PP (°) | −4.7 (±4.6) | P=0.006* | −3.7 (±4.2) | P=0.783 | 0.4 (±1.6) | P=0.008* | P=0.008* |
| L1-ML (°) | 1.6 (±2.3) | P=0.042* | 3.8 (±5.4) | P=0.321 | −0.3 (±1.8) | P=0.438 | P=0.037* |
| Dental measurements | |||||||
| OJ (mm) | 3.7 (±2.4) | P<0.001* | |||||
| OB (mm) | −0.2 (±2.8) | P=0.802 | |||||
Table III.
Distribution of the complications noted in the MAMP group
| Nature of complication | N (%) |
|---|---|
| Miniscrews failure | |
| Maxillary | 0 (0) |
| Mandibular | 7 (31.8) |
| Debonding of appliance | |
| Maxillary | 1 (9.1) |
| Mandibular | 5 (45.5) |
| Intrusion of mandibular molars | 5 (45.5) |
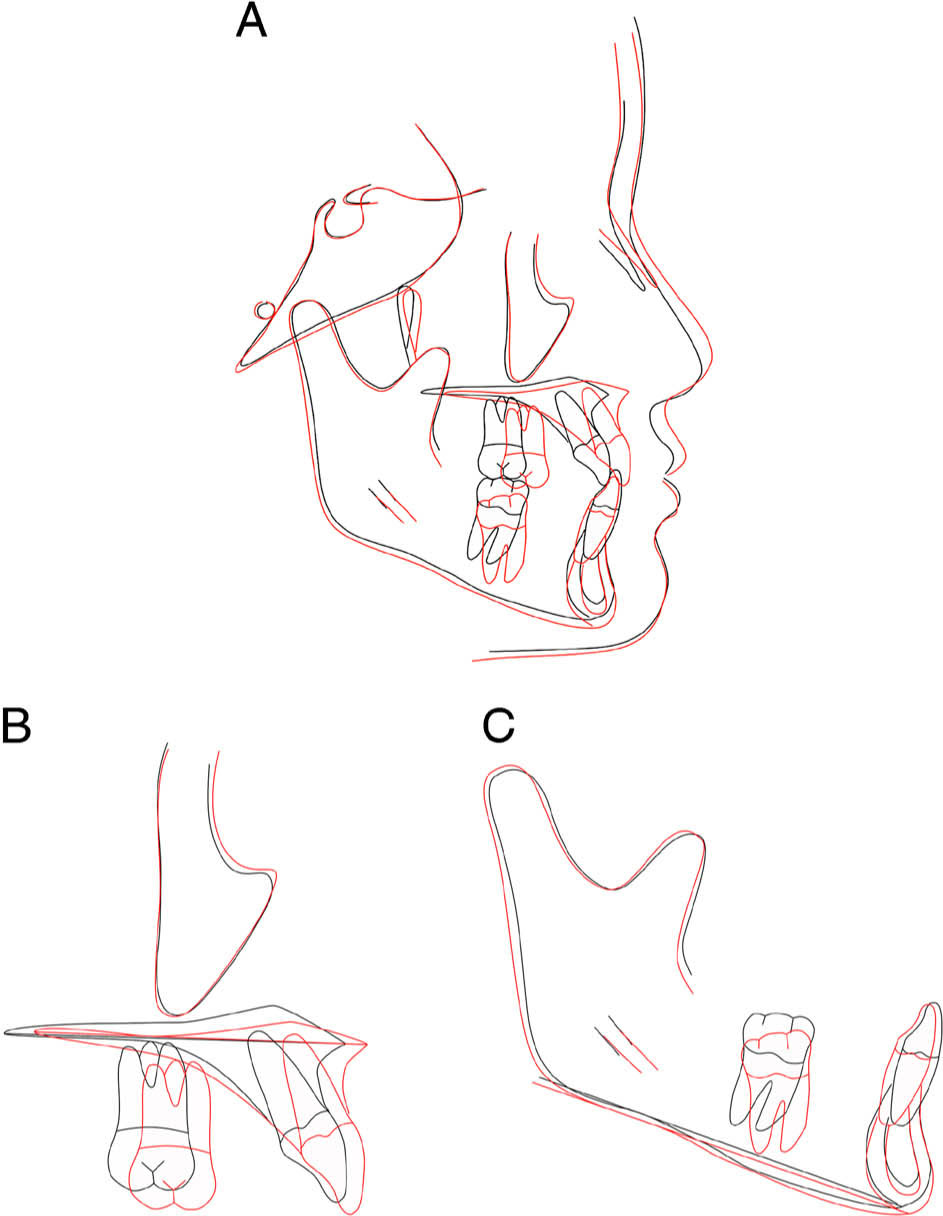
Figure 2.
Pre- (black) and post-treatment (red) lateral cephalogram superimposition of a subject in the MAMP group.
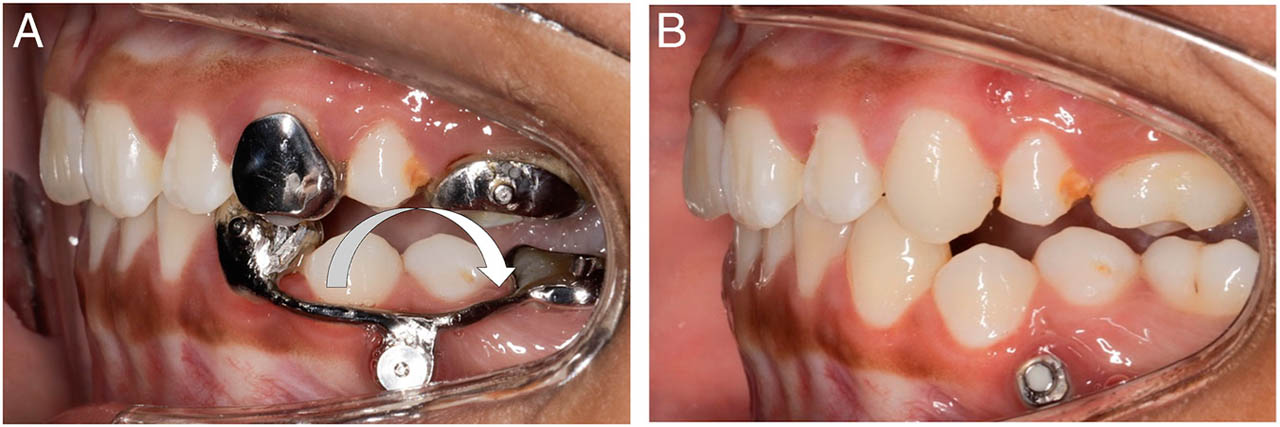
Figure 3.
(A) Intrusion noted on tooth 36; (B) Four weeks after framework removal.