
Table 1
Diet formulations and chemical composition of the tested diets
| Control diet | WMR diet | |
|---|---|---|
| Ingredients (g/kg) | ||
| Fish meal 66% CP | 80 | 80 |
| Soybean meal 48% CP | 300 | 300 |
| Corn gluten meal 60% CP | 120 | 120 |
| Corn oil + Cod liver oil | 40 | 40 |
| Premix* | 30 | 30 |
| Wheat bran | 80 | 80 |
| Ground yellow corn | 350 | 310 |
| WMR | 0 | 40 |
| Total | 1,000 | 1,000 |
| Chemical analysis (%) | ||
| Nitrogen-free extract** | 49.42 | 48.58 |
| Crude fibre | 5.36 | 5.87 |
| Crude lipids | 7.21 | 7.10 |
| Ash | 6.94 | 7.40 |
| Crude protein | 31.07 | 31.05 |
| Gross energy (kcal/kg) | 4,468 | 4,405 |
WMR: watermelon rind.
* Each 1 kg of premix contained: Vitamins: vitamin K3 (1.50 g), vitamin E (7 g), vitamin D3 (2,000,000 IU), vitamin A (8,000,000 IU), nicotinic acid (20 g), vitamin B1 (0.70 g), pantothenic acid (7 g), vitamin B2 (3.50 mg), biotin (50 mg), folic acid (0.70 mg), vitamin B12 (7 mg); Minerals: manganese sulphate (5.30 g), copper sulphate (2.70 g), cobalt sulphate (70 mg), zinc sulphate (4 g), iron sulphate (20 g), sodium selenite (70 mg), calcium iodine (0.34 g), and carrier (CaHPO4·2H2O up to 1 kg).
**Nitrogen-free extract = 100 – (% crude fibre + % crude lipids + % crude protein + % ash).
Table 2
Gene primers of O. niloticus for RT-qPCR amplification
| Target gene | Primer sequences | TM | Efficiency | Size | Accession no. |
|---|---|---|---|---|---|
| gapdh | GATAATGGCAAACTTGTCGTCG | 58.33 | 99.53 | 205 | NM_001279552.1 |
| ACATTGGAGCATCGGGTGAG | 60.11 | ||||
| slc15a1a | ACGATTGGACAGGTTGCGAT | 60.04 | 101.5 | 133 | XM_005452882.2 |
| TGCCCAGAGCAATGAGGAAG | 60.03 | ||||
| slc15a2 | CTGCCTGTTTGCACCTGAAC | 59.97 | 99.36 | 85 | XM_005475385.4 |
| CAGACACTGGCTGCACTACA | 59.97 | ||||
| slc2a1b | CACTGTGGTGTCGCTGTTTG | 59.97 | 99.5 | 172 | NM_001279727.1 |
| TGCCACGAAGGCAAAAATGG | 59.97 | ||||
| il1b | CTCATGTCTGTCCGCTACCC | 59.90 | 98.54 | 103 | KF747686.1 |
| TGAAGCTTCTGTAGCGTGGG | 60.04 | ||||
| rela | GAGAAAGCGGACAGGAGACAT | 59.79 | 93.68 | 133 | XM_025905614.1 |
| AGCAGCTTGTGGAGGCTTG | 60.60 |
TM: melting temperature; gapdh: glyceraldehyde-3-phosphate dehydrogenase. slc15a1a: solute carrier family 15, member 1a; slc15a2: solute carrier family 15, member 2; slc2a1b: solute carrier family 2, member 1b; il1b: interleukin-1 beta; rela: v-rel avian reticuloendotheliosis viral oncogene homolog A.
Table 3
Effect of copper (Cu) and nickel (Ni) co-exposure and/or dietary watermelon rind powder (WMR) supplementation on growth metrics of O. niloticus
| Parameters | Control | WMR | Cu + Ni | WMR + Cu + Ni | P-value of WMR | P-value of Cu + Ni | P-value of interaction |
|---|---|---|---|---|---|---|---|
| IW (g) | 37.30 ± 0.36 | 37.20 ± 0.50 | 37.33 ± 0.48 | 37.37 ± 0.41 | 0.95 | 0.82 | 0.88 |
| FW (g) | 75.63 ± 0.77b | 109.40 ± 0.67a | 54.07 ± 1.13 d | 65.07 ± 1.03c | <0.01 | <0.01 | <0.01 |
| WG (g) | 38.33 ± 0.47b | 72.20 ± 0.32a | 16.74 ± 0.66 d | 27.70 ± 0.63c | <0.01 | <0.01 | <0.01 |
| SGR (%/day) | 1.57 ± 0.01b | 2.40 ± 0.02a | 0.82 ± 0.02 d | 1.23 ± 0.01c | <0.01 | <0.01 | <0.01 |
| FI (g) | 77.63 ± 0.97b | 92.15 ± 1.21a | 65.36 ± 1.92c | 70.44 ± 0.99b | <0.01 | <0.01 | <0.01 |
| FCR | 2.03 ± 0.03c | 1.28 ± 0.01 d | 3.91 ± 0.06a | 2.54 ± 0.05b | <0.01 | <0.01 | <0.01 |
IW: initial weight; FW: final weight; WG: weight gain; SGR: specific growth rate; FI: feed intake; FCR: feed conversion ratio. The data were analysed by two-way ANOVA (n = 4 replicate tanks per group), where the tank served as an independent experimental unit. Values having various superscripts in the same row differ significantly (Tukey’s HSD test; P < 0.05). Control and WMR groups: fish fed on control and WMR diets, respectively, without Cu–Ni co-exposure. Cu + Ni and WMR + Cu + Ni groups: fish fed on control and WMR diets, respectively, and exposed to Cu–Ni toxicity.
Table 4
Effect of copper (Cu) and nickel (Ni) co-exposure and/or dietary watermelon rind powder (WMR) supplementation on mortality (%), growth-regulating hormones, and digestive enzyme activities of O. niloticus
| Parameters | Control | WMR | Cu + Ni | WMR + Cu + Ni | P-value of WMR | P-value of Cu + Ni | P-value of interaction |
|---|---|---|---|---|---|---|---|
| Mortality (%) | 0.00 ± 0.00c | 0.00 ± 0.00c | 25.00 ± 2.89a | 7.50 ± 2.50b | <0.01 | <0.01 | <0.01 |
| GH (ng/mL) | 15.19 ± 0.33 | 18.73 ± 0.31 | 10.50 ± 0.55 | 12.69 ± 0.63 | <0.01 | <0.01 | 0.18 |
| Leptin (ng/mL) | 9.88 ± 0.32c | 10.86 ± 0.34c | 18.57 ± 0.38a | 15.92 ± 0.23b | 0.02 | <0.01 | <0.01 |
| Amylase (U/g protein) | 97.10 ± 0.39b | 101.40 ± 0.49a | 71.82 ± 0.70 d | 92.39 ± 0.94c | <0.01 | <0.01 | <0.01 |
| Lipase (U/g protein) | 38.63 ± 0.17b | 43.23 ± 0.95a | 26.21 ± 1.20c | 34.96 ± 1.01b | <0.01 | <0.01 | 0.04 |
| Trypsin (U/g protein) | 45.08 ± 0.75b | 56.02 ± 1.11a | 25.08 ± 1.48 d | 40.59 ± 0.25c | 0.18 | <0.01 | 0.04 |
GH: growth hormone. The data were analysed by two-way ANOVA (n = 4 replicate tanks per group), where the tank served as an independent experimental unit. Values having various superscripts in the same row differ significantly (Tukey’s HSD test; P < 0.05). Control and WMR groups: fish fed on control and WMR diets, respectively, without Cu–Ni co-exposure. Cu + Ni and WMR + Cu + Ni groups: fish fed on control and WMR diets, respectively, and exposed to Cu–Ni toxicity.
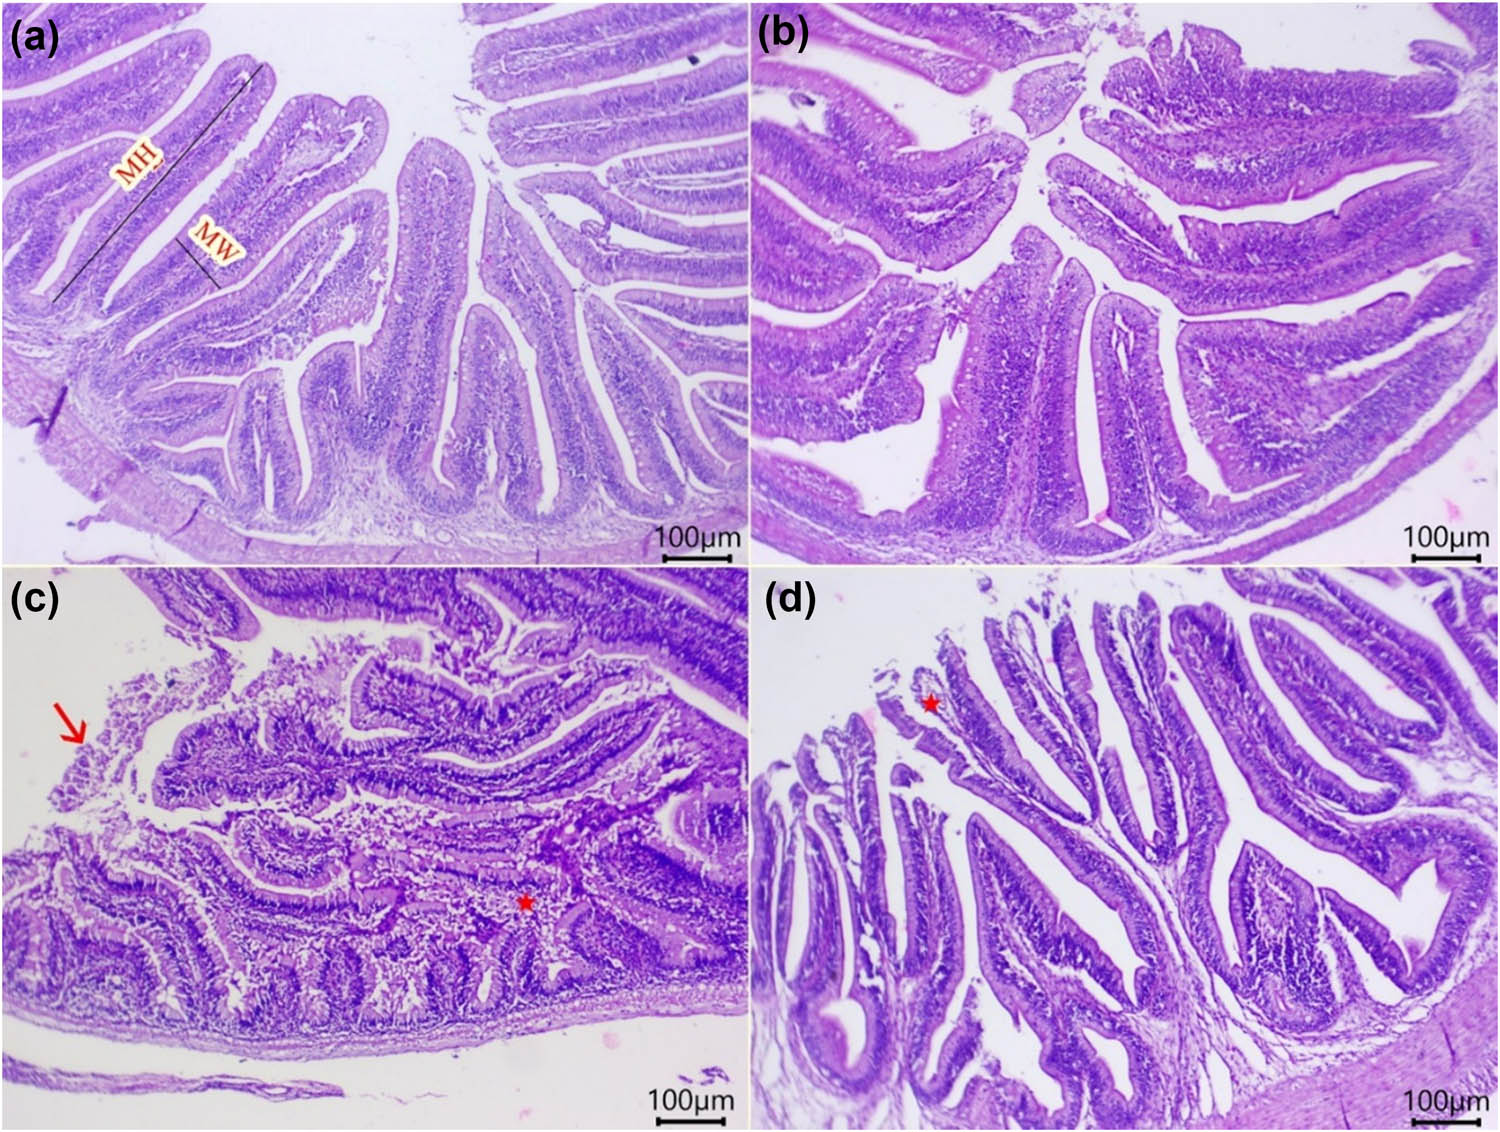
Figure 1
Representative photomicrograph (H&E) of O. niloticus intestine following copper (Cu) and nickel (Ni) co-exposure and/or dietary watermelon rind powder (WMR) supplementation. (a and b) Intestine of the control and WMR groups, showing normal histomorphology of mucosal folds, lamina propria, muscular layer, and submucosa. (c) Intestine of the Cu + Ni group, showing necrotic, desquamated epithelial lining mucosa (arrow), along with intense inflammatory cell aggregates in the lamina propria and submucosa (star). (d) Intestine of the WMR + Cu + Ni group, showing minor denudation of the mucosal fold epithelium and an edematous intestinal wall (star). MW: mucosal fold width. MH: mucosal fold height. Control and WMR groups: fish fed on control and WMR diets, respectively, without Cu–Ni co-exposure. Cu + Ni and WMR + Cu + Ni groups: fish fed on control and WMR diets, respectively, and exposed to Cu–Ni toxicity. Scale bar: 100 µm.
Table 5
Effect of copper (Cu) and nickel (Ni) co-exposure and/or dietary watermelon rind powder (WMR) supplementation on intestinal morphometries of O. niloticus
| Parameters | Control | WMR | Cu + Ni | WMR + Cu + Ni | P-value of WMR | P-value of Cu + Ni | P-value of interaction |
|---|---|---|---|---|---|---|---|
| MW (µm) | 87.28 ± 1.44 | 111.00 ± 0.43 | 62.00 ± 0.91 | 85.00 ± 1.29 | <0.01 | <0.01 | 0.75 |
| MH (µm) | 533.80 ± 1.46 | 672.90 ± 13.95 | 405.80 ± 10.67 | 522.60 ± 11.68 | <0.01 | <0.01 | 0.31 |
| MSA (mm2) | 0.05 ± 0.001b | 0.07 ± 0.002a | 0.02 ± 0.00c | 0.04 ± 0.00b | <0.01 | <0.01 | <0.01 |
MW: mucosal fold width; MH: mucosal fold height; MSA: mucosal surface area. The data were analysed by two-way ANOVA (n = 4 replicate tanks per group), where the tank served as an independent experimental unit. Values having various superscripts in the same row differ significantly (Tukey’s HSD test; P < 0.05). Control and WMR groups: fish fed on control and WMR diets, respectively, without Cu–Ni co-exposure. Cu + Ni and WMR + Cu + Ni groups: fish fed on control and WMR diets, respectively, and exposed to Cu–Ni toxicity.
Table 6
Effect of copper (Cu) and nickel (Ni) co-exposure and/or dietary watermelon rind powder (WMR) supplementation on antioxidant status of O. niloticus
| Parameters | Control | WMR | Cu + Ni | WMR + Cu + Ni | P-value of WMR | P-value of Cu + Ni | P-value of interaction |
|---|---|---|---|---|---|---|---|
| GPx (U/mg protein) | 67.14 ± 0.36b | 74.98 ± 1.92a | 41.83 ± 0.65c | 62.44 ± 0.90b | <0.01 | <0.01 | <0.01 |
| SOD(U/mg protein) | 75.92 ± 1.00b | 82.67 ± 1.06a | 52.04 ± 0.74 d | 67.96 ± 0.82c | <0.01 | <0.01 | <0.01 |
| TAC(µmol/mg protein) | 2.80 ± 0.02b | 4.67 ± 0.09a | 1.46 ± 0.17 d | 2.31 ± 0.05c | <0.01 | <0.01 | <0.01 |
| MDA(nmol/mg protein) | 1.60 ± 0.08c | 1.47 ± 0.08c | 8.57 ± 0.18a | 6.04 ± 0.17b | <0.01 | <0.01 | <0.01 |
GPx: glutathione peroxidase; SOD: superoxide dismutase; TAC: total antioxidant capacity; MDA: malondialdehyde. The data were analysed by two-way ANOVA (n = 4 replicate tanks per group), where the tank served as an independent experimental unit. Values having various superscripts in the same row differ significantly (Tukey’s HSD test; P < 0.05). Control and WMR groups: fish fed on control and WMR diets, respectively, without Cu–Ni co-exposure. Cu + Ni and WMR + Cu + Ni groups: fish fed on control and WMR diets, respectively, and exposed to Cu–Ni toxicity.
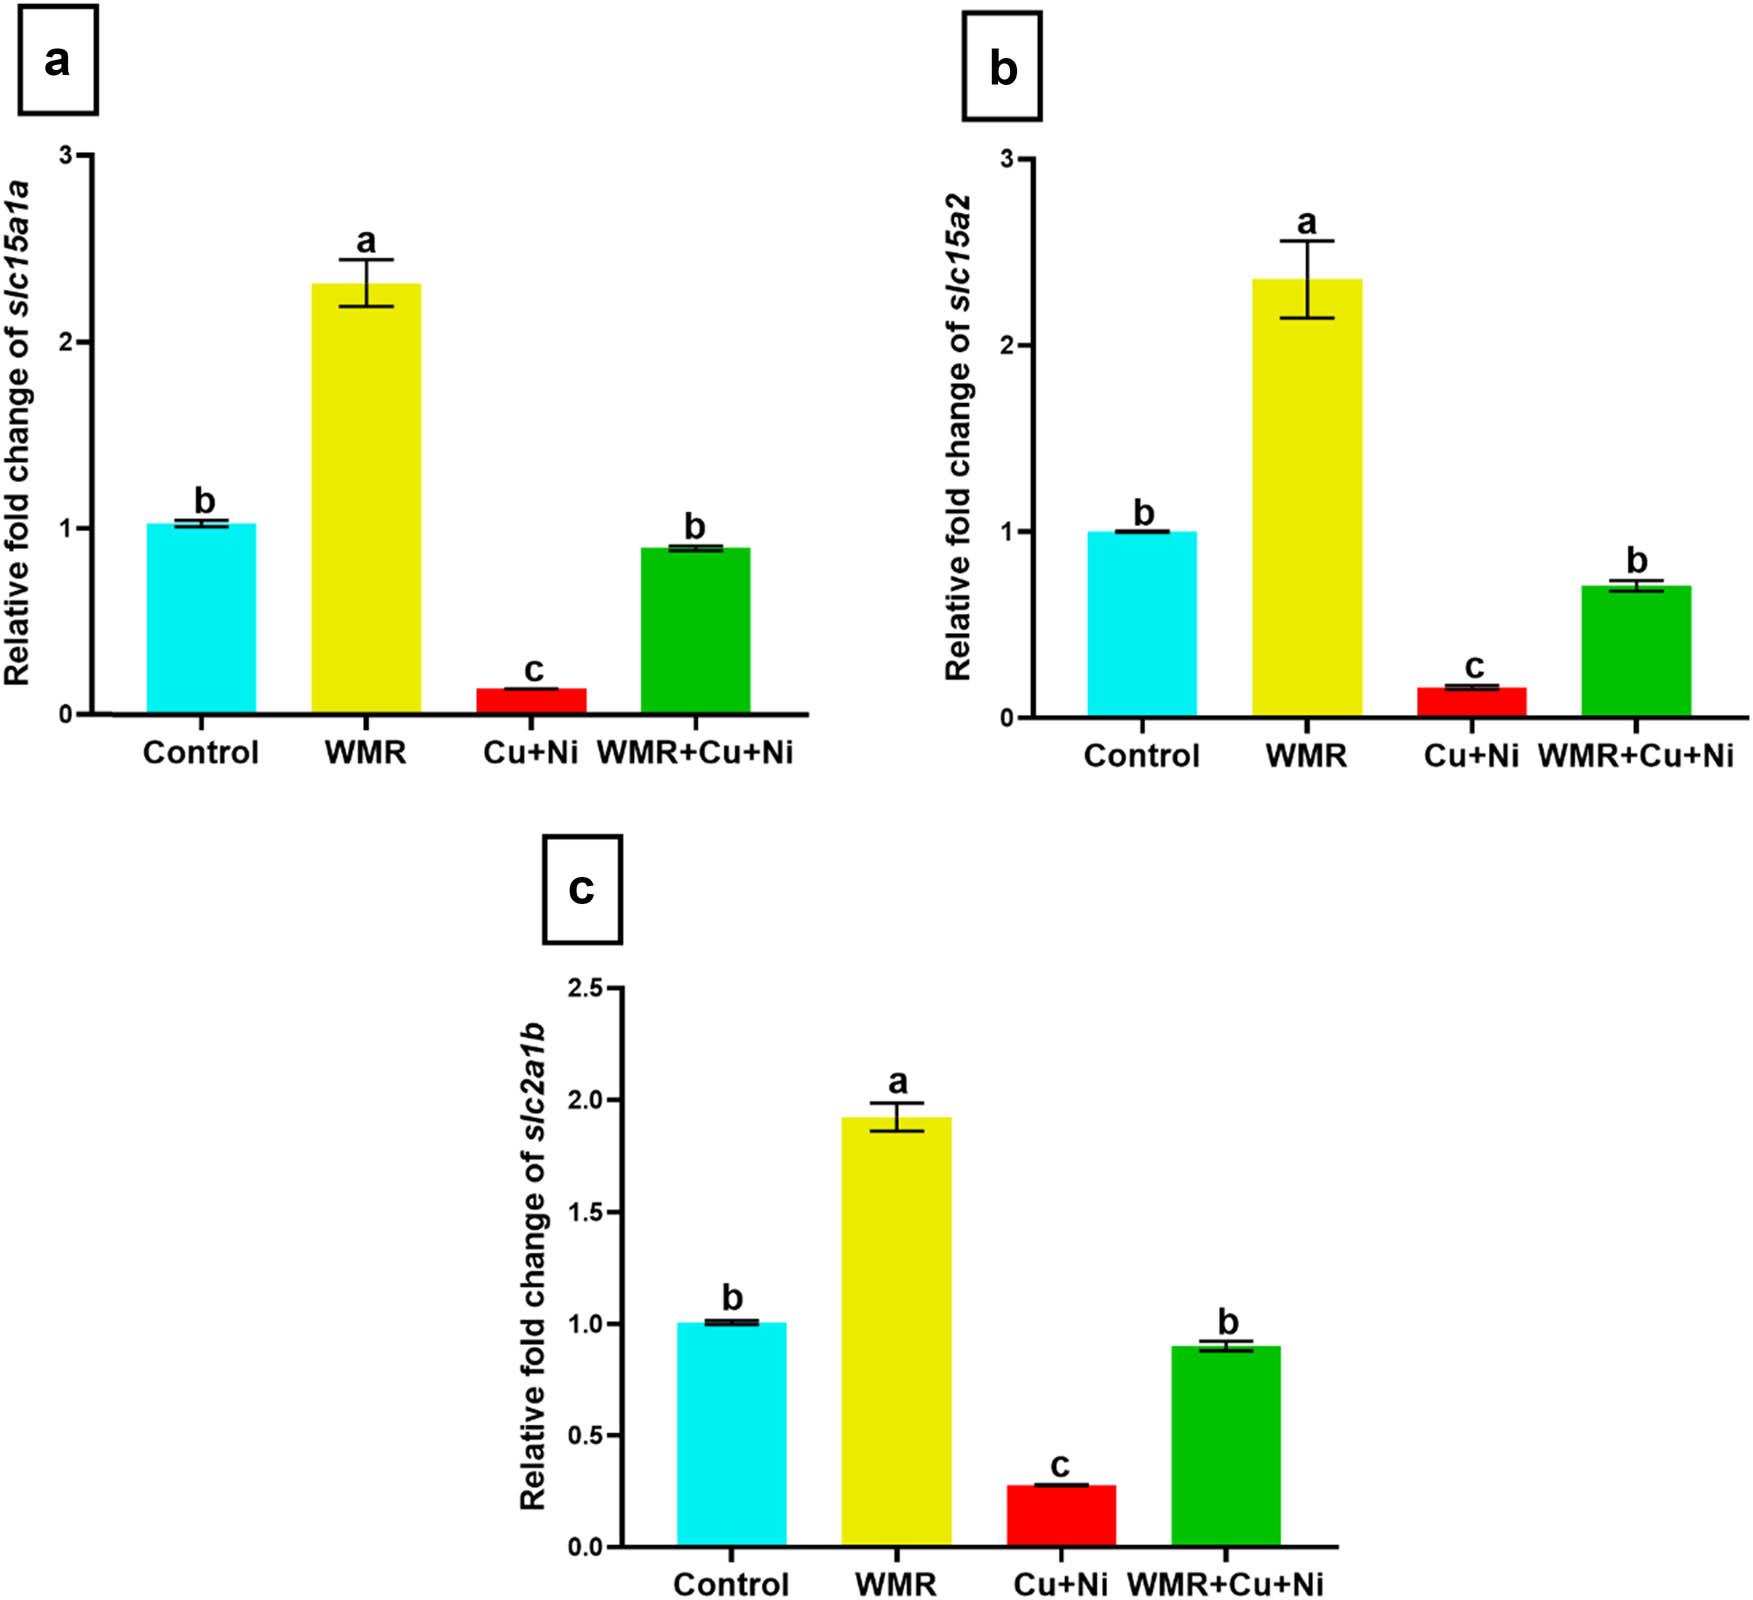
Figure 2
Effect of the interaction between copper (Cu) and nickel (Ni) co-exposure and dietary watermelon rind powder (WMR) supplementation on intestinal nutrient transporter genes of O. niloticus. (a) slc15a1a: solute carrier family 15, member 1a. (b) slc15a2: solute carrier family 15, member 2. (c) slc2a1b: solute carrier family 2, member 1b. The data were analysed by two-way ANOVA (n = 4 replicate tanks per group), where the tank served as an independent experimental unit. Values on the bars (means ± SE) with various superscripts differ significantly (Tukey’s HSD test; P < 0.05). Control and WMR groups: fish fed on control and WMR diets, respectively, without Cu–Ni co-exposure. Cu + Ni and WMR + Cu + Ni groups: fish fed on control and WMR diets, respectively, and exposed to Cu–Ni toxicity.
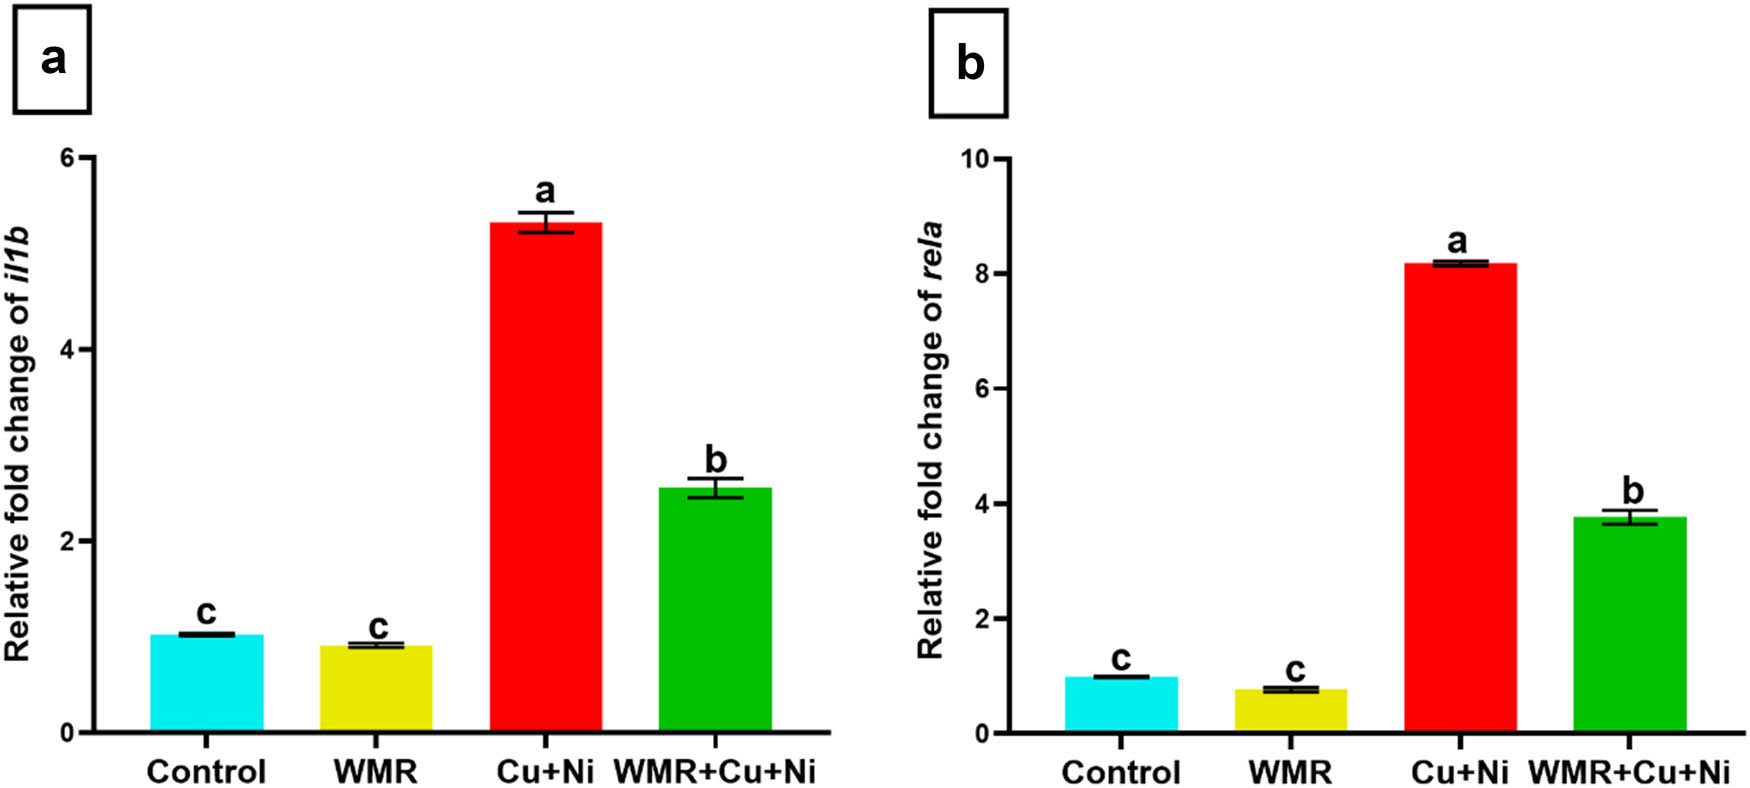
Figure 3
Effect of the interaction between copper (Cu) and nickel (Ni) co-exposure and dietary watermelon rind powder (WMR) supplementation on intestinal inflammatory genes of O. niloticus. (a) il1b: interleukin-1 beta. (b) rela: v-rel avian reticuloendotheliosis viral oncogene homolog A. The data were analysed by two-way ANOVA (n = 4 replicate tanks per group), where the tank served as an independent experimental unit. Values on the bars (means ± SE) with various superscripts differ significantly (Tukey’s HSD test; P < 0.05). Control and WMR groups: fish fed on control and WMR diets, respectively, without Cu–Ni co-exposure. Cu + Ni and WMR + Cu + Ni groups: fish fed on control and WMR diets, respectively, and exposed to Cu–Ni toxicity.