
Table 1
Composition of feed mixtures for broiler chickens (starter)
| Ingredient, g·kg–1 | Groups | |||
|---|---|---|---|---|
| I | II | III | IV | |
| Wheat (Activus cv.) | 580.1 | 711.1 | 776.1 | 840.6 |
| Soybean meal (CP 48%) | 256.5 | 128.0 | 64.0 | — |
| Feed wheat flour | 85.0 | 85.0 | 85.0 | 85.0 |
| Soybean oil | 35.0 | 17.8 | 9.3 | 1.0 |
| Choline chloride 60% | 2.8 | 2.8 | 2.8 | 2.8 |
| Sodium bicarbonate (NaHCO3) | 1.5 | 1.5 | 1.5 | 1.5 |
| 1-Ca phosphate | 7.4 | 8.5 | 9.0 | 9.5 |
| Chalk | 12.8 | 13.2 | 13.5 | 14.1 |
| Premix (Broiler Starter Green Line)1 | 2.0 | 2.0 | 2.0 | 2.0 |
| dl-methionine (99%)2 | 4.1 | 5.3 | 5.9 | 6.5 |
| l-arginine (97%)2 | 1.7 | 5.5 | 7.3 | 9.2 |
| l-lysine HCl (78.9%)2 | 4.8 | 8.8 | 10.8 | 12.8 |
| l-threonine (99%)2 | 2.0 | 3.8 | 4.7 | 5.6 |
| l-tryptophan (98%)2 | — | 0.6 | 0.9 | 1.1 |
| l-valine (96.5%)2 | 0.4 | 2.6 | 3.6 | 4.7 |
| Sodium sulphate | 1.0 | 1.0 | 1.0 | 1.0 |
| Salt | 1.1 | 1.0 | 0.9 | 0.9 |
| Sacox 120 microGranulate3 | 1.3 | 1.3 | 1.3 | 1.3 |
| Enzyme phytase4 | 0.2 | 0.2 | 0.2 | 0.2 |
| Enzyme xylanase5 | 0.2 | 0.2 | 0.2 | 0.2 |
[i] 1Each 1 kg of premix contained (Broiler Starter Green Line): Vitamins: A 6000000.00 IU, D3 1250000.00 IU, 25-hydroxycholeciferol 18750.00 mcg, E 50000.00 mg, K3 2000.00 mg, B1 1750.00 mg, B2 4500.00 mg, Ca pantothenate 7499.94 mg, B6 2500.00 mg, B12 15000.00 mcg, niacin 32500.00 mg, folic acid 1000.00 mg, biotin 100000.00 mcg. Minerals: Ca 14.53%, Mg 0.01%, Na 1.76%. Fe 10000.00 mg, Cu 8000.00 mg, Mn 60000.00 mg, Zn 55000.00 mg, I 625.00 mg, Se 150.00 mg. Enzymes: 6-phytase 750000.00 FYT, endo–1,4-beta-xylanase 100000.00 FXU. Others: citric acid 12.00 mg, butylhydroxytoluene 48.19 mg. propyl gallate 3.96 mg, clinoptilolite of sedimentary origin 20000.00 mg·kg–1.
[iii] 3Sacox 120 microGranulate – salinomycin sodium salt 120 g: salinomycin sodium: 114–132 g; silicon dioxide: 10–100 g·kg–1; calcium carbonate: 500–700 g.
[vi] *Digestible amino acid – according to nutritional recommendations for poultry (Smulikowska & Rutkowski, 2018) – crystalline AAs are completely absorbed in the small intestine and their availability is assumed to be 100%.
Table 2
Composition of feed mixtures for broiler chickens (grower)
| Ingredient, g·kg–1 | Groups | |||
|---|---|---|---|---|
| I | II | III | IV | |
| Wheat (Activus cv.) | 669.3 | 777.7 | 831.1 | 884.5 |
| Soybean meal (CP 48%) | 211.4 | 105.0 | 52.5 | — |
| Feed wheat flour | 49.9 | 50.0 | 50.0 | 50.0 |
| Soybean oil | 30.5 | 16.3 | 9.3 | 2.3 |
| Choline chloride 60% | 2.7 | 2.7 | 2.7 | 2.7 |
| Sodium bicarbonate (NaHCO3) | 1.5 | 1.5 | 1.5 | 1.5 |
| 1-Ca phosphate | 5.9 | 6.8 | 7.2 | 7.7 |
| Chalk | 11.2 | 11.5 | 11.7 | 11.8 |
| Premix (Broiler Grower Green Line)1 | 2.0 | 2.0 | 2.0 | 2.0 |
| dl-methionine (99%)2 | 3.9 | 4.9 | 5.4 | 5.9 |
| l-arginine (97%)2 | 4.5 | 7.8 | 9.5 | 11.1 |
| l-lysine HCl (79.8%)2 | 1.6 | 3.1 | 3.8 | 4.6 |
| l-threonine (99%)2 | — | 0.4 | 0.7 | 0.9 |
| l-tryptophan (98%)2 | 0.2 | 1.9 | 2.8 | 3.7 |
| l-valine (96.5%)2 | 1.0 | 1.0 | 1.0 | 1.0 |
| Sodium sulphate | 1.0 | 0.9 | 0.9 | 0.8 |
| Sacox 120 microGranulate3 | 1.3 | 1.3 | 1.3 | 1.3 |
| Enzyme phytase4 | 0.2 | 0.2 | 0.2 | 0.2 |
| Enzyme xylanase5 | 0.2 | 0.2 | 0.2 | 0.2 |
[i] 1Each 1 kg of premix contained (Broiler Grower Green Line): Vitamins: A 5000000.00 IU, D3 2000000.00 IU, E 50000.00 mg, K3 2000.00 mg, B1 1500.00 mg, B2 4000.00 mg, Ca pantothenate 7499.94 mg, B6 2500.00 mg, B12 15000.00 mcg, niacin 32500.00 mg, folic acid 1000.00 mg, biotin 125000.00 mcg. Minerals: Ca 14.59%, Mg 0.01%, Na 1.76%. Fe 10000.00 mg, Cu 8000.00 mg, Mn 60000.00 mg, Zn 55000.00 mg, I 625.00 mg, Se 150.00 mg. Enzymes: 6-phytase 750000.00 FYT, endo–1,4-beta-xylanase 100000.00 FXU. Others: citric acid 12.00 mg, butylhydroxytoluene 48.19 mg, propyl gallate 3.96 mg, clinopptilolite of sedimentary origin 20000.00 mg.
[iii] 3Sacox 120 microGranulate – salinomycin sodium salt 120 g·kg–1: salinomycin sodium: 114–132 g·kg–1; silicon dioxide: 10–100 g·kg–1; calcium carbonate: 500–700 g·kg–1.
[vi] *Digestible amino acid – according to nutritional recommendations for poultry (Smulikowska & Rutkowski, 2018) – crystalline AAs are completely absorbed in the small intestine and their availability is assumed to be 100%.
Table 3
Composition of feed mixtures for broiler chickens (finisher)
| Ingredient, g·kg–1 | Groups | |||
|---|---|---|---|---|
| I | II | III | IV | |
| Wheat (Activus cv.) | 726.6 | 810.4 | 851.7 | 891.9 |
| Soybean meal (CP 48%) | 161.9 | 80.0 | 40.0 | — |
| Feed wheat flour | 50.0 | 50.0 | 49.7 | 50.0 |
| Soybean oil | 28.5 | 17.5 | 12.0 | 6.8 |
| Choline chloride 60% | 2.7 | 2.7 | 2.7 | 2.7 |
| Sodium bicarbonate (NaHCO3) | 1.1 | 1.1 | 1.1 | 1.1 |
| 1-Ca phosphate | 4.5 | 5.2 | 5.5 | 5.9 |
| Chalk | 10.4 | 10.4 | 10.3 | 10.7 |
| Premix (Broiler Finisher Green Line)1 | 2.0 | 2.0 | 2.0 | 2.0 |
| dl-methionine (99%)2 | 3.2 | 4.0 | 4.4 | 4.7 |
| l-arginine (97%)2 | 1.6 | 4.0 | 5.2 | 6.3 |
| l-lysine HCl (79.8%)2 | 4.3 | 6.9 | 8.2 | 9.4 |
| l-threonine (99%)2 | 1.3 | 2.4 | 3.0 | 3.5 |
| l-tryptophan (98%)2 | — | 0.2 | 0.4 | 0.6 |
| l-valine (96.5%)2 | — | 1.4 | 2.0 | 2.7 |
| Sodium sulphate | 1.0 | 1.0 | 1.0 | 1.0 |
| Salt | 0.5 | 0.4 | 0.4 | 0.3 |
| Enzyme phytase3 | 0.2 | 0.2 | 0.2 | 0.2 |
| Enzyme xylanase4 | 0.2 | 0.2 | 0.2 | 0.2 |
[i] 1Each 1 kg of premix contained (Broiler Finisher Green Line): Vitamins: A 5000000.00 IU, D3 2000000.00 IU, E 40000.00 mg, K3 1500.00 mg, B1 1000.00 mg, B2 3500.00 mg, Ca pantothenate 6250.44 mg, B6 2000.00 mg, B12 10000.00 mcg, niacin 25000.00 mg, folic acid 1000.00 mg, biotin 100000.00 mcg. Minerals: Ca 15.83%, Mg 0.01%, Na 1.76%. Fe 10000.00 mg, Cu 8000.00 mg, Mn 60000.00 mg, Zn 55000.00 mg, I 625.00 mg, Se 150.00 mg. Enzymes: 6-phytase 750000.00 FYT, endo–1,4-beta-xylanase 100000.00 FXU. Others: citric acid 12.00 mg·kg–1, butylhydroxytoluene 48.19 mg·kg–1, propyl gallate 3.96 mg·kg–1, clinoptilolite of sedimentary origin 20000.00 mg·kg–1.
[v] *Digestible amino acid – according to nutritional recommendations for poultry (Smulikowska & Rutkowski, 2018) – crystalline AAs are completely absorbed in the small intestine and their availability is assumed to be 100%.
Table 4
Wheat and soybean meal content in experimental mixtures (%)
| Group I | Group II | Group III | Group IV | |
|---|---|---|---|---|
| SBM | 30 | 15 | 7.5 | 0100 |
| HPW | 60 | 75 | 82.5 | 100 |
Table 5
Nutritional value (in kg of feed mixture) of diets for broiler chickens
| Groups | I | II | III | IV | I | II | III | IV | I | II | III | IV |
|---|---|---|---|---|---|---|---|---|---|---|---|---|
| Starter phase (1–14) | Grower phase (15–29) | Finisher phase (30–49) | ||||||||||
| CA, g | 59.8 | 48.6 | 42.5 | 56.8 | 46.7 | 46.6 | 42.8 | 30.4 | 41.7 | 39.4 | 23.3 | 31.7 |
| CP, g | 236.4 | 217.6 | 214.5 | 196.8 | 225.0 | 215.1 | 206.2 | 199.5 | 207.0 | 196.1 | 187.4 | 176.8 |
| EE, g | 36.6 | 22.8 | 23.2 | 23.8 | 40.4 | 34.1 | 27.1 | 19.3 | 38.5 | 28.2 | 22.3 | 19.7 |
| CF, g | 26.4 | 21.6 | 18.4 | 16.0 | 21.0 | 18.5 | 18.5 | 25.7 | 26.0 | 24.2 | 23.1 | 20.4 |
| Ca, g | 9.80 | 9.12 | 9.53 | 9.45 | 8.50 | 8.93 | 8.56 | 9.18 | 8.59 | 8.79 | 8.54 | 7.77 |
| P, g | 6.42 | 6.60 | 6.71 | 6.15 | 6.17 | 6.33 | 6.18 | 6.67 | 6.47 | 6.49 | 6.32 | 6.67 |
| Na, g | 2.09 | 2.02 | 2.06 | 2.01 | 1.60 | 2.09 | 1.47 | 1.45 | 1.69 | 1.25 | 1.53 | 1.43 |
| Lys, g | 17.96 | 18.70 | 18.19 | 18.03 | 13.24 | 13.20 | 13.27 | 13.04 | 11.68 | 11.27 | 11.64 | 11.93 |
| Met + Cys, g | 9.64 | 9.11 | 9.04 | 9.30 | 9.52 | 9.17 | 8.93 | 8.72 | 9.12 | 9.25 | 9.67 | 9.82 |
| Thr, g | 9.93 | 9.48 | 9.46 | 9.41 | 8.54 | 8.77 | 8.68 | 9.26 | 6.71 | 6.73 | 6.18 | 7.10 |
| Trp, g | 2.58 | 2.40 | 2.39 | 2.30 | 1.68 | 1.48 | 1.49 | 1.43 | 1.35 | 1.29 | 1.33 | 1.15 |
| Arg, g | 14.80 | 15.01 | 14.89 | 14.93 | 12.83 | 13.35 | 13.91 | 13.24 | 10.13 | 10.03 | 10.31 | 10.35 |
| Val, g | 10.06 | 9.93 | 10.18 | 10.10 | 8.17 | 8.18 | 8.77 | 8.68 | 8.17 | 8.14 | 8.40 | 8.73 |
CA, crude ash; CP, crude protein; EE, ether extract (crude fat); CF, crude fibre; Ca, calcium; P, phosphorus; Na, sodium; Lys, lysine; Met + Cys, methionine + cystine; Thr, threonine; Trp, tryptophan; Arg, arginine; Val, valine.
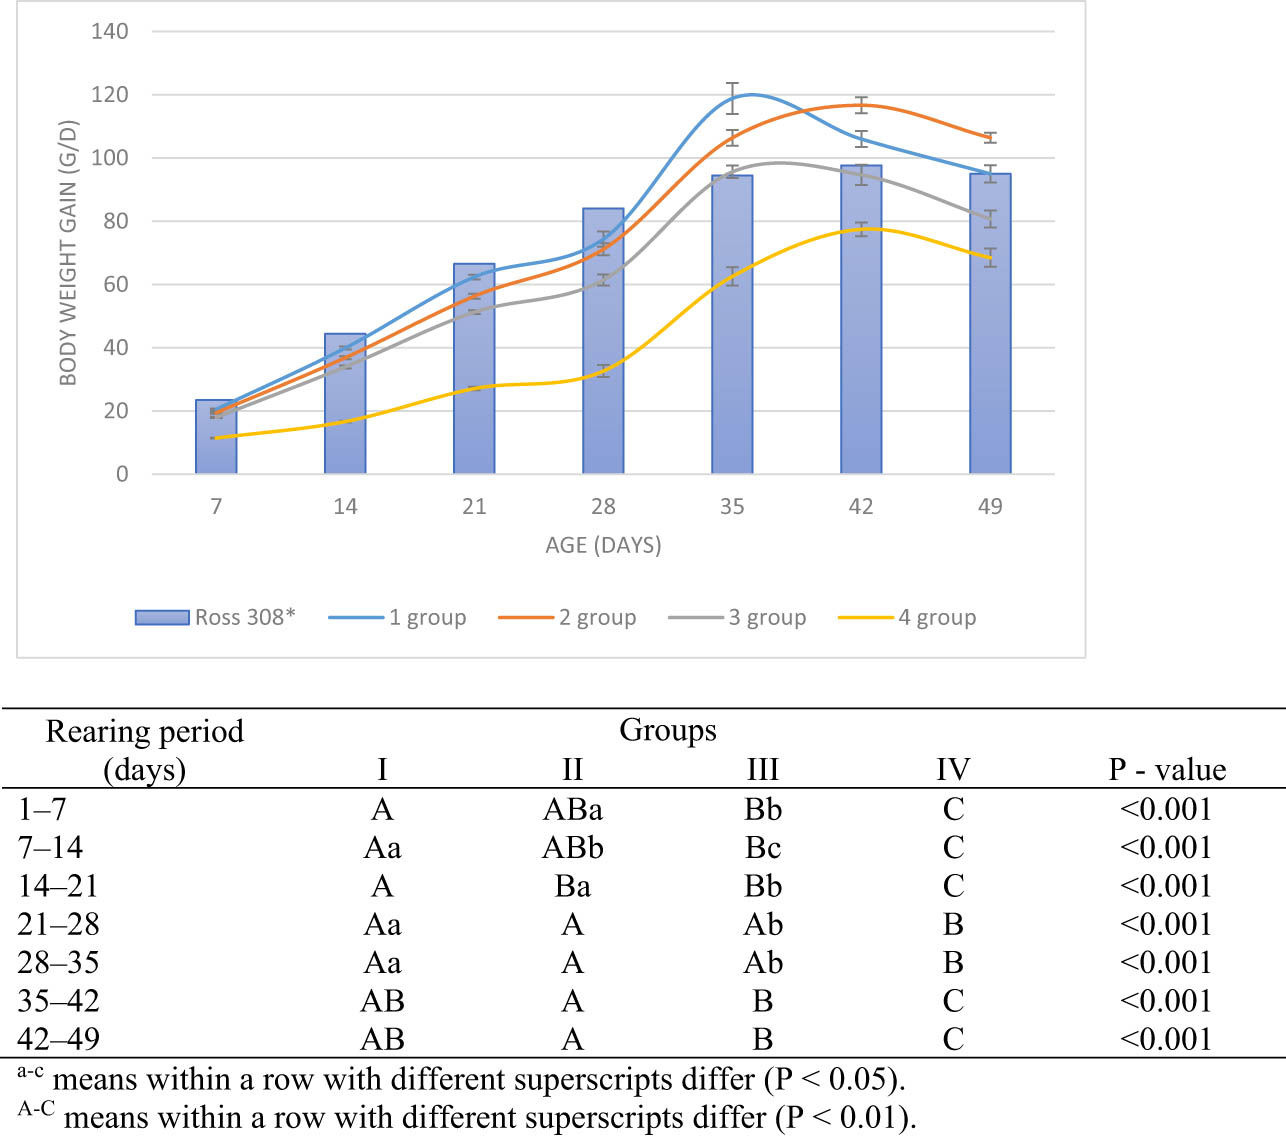
Figure 1
Average body weight gain (BWG) of broiler chickens fed with different high-protein wheat (HPW) contents (mean value ± SEM, n = 7).
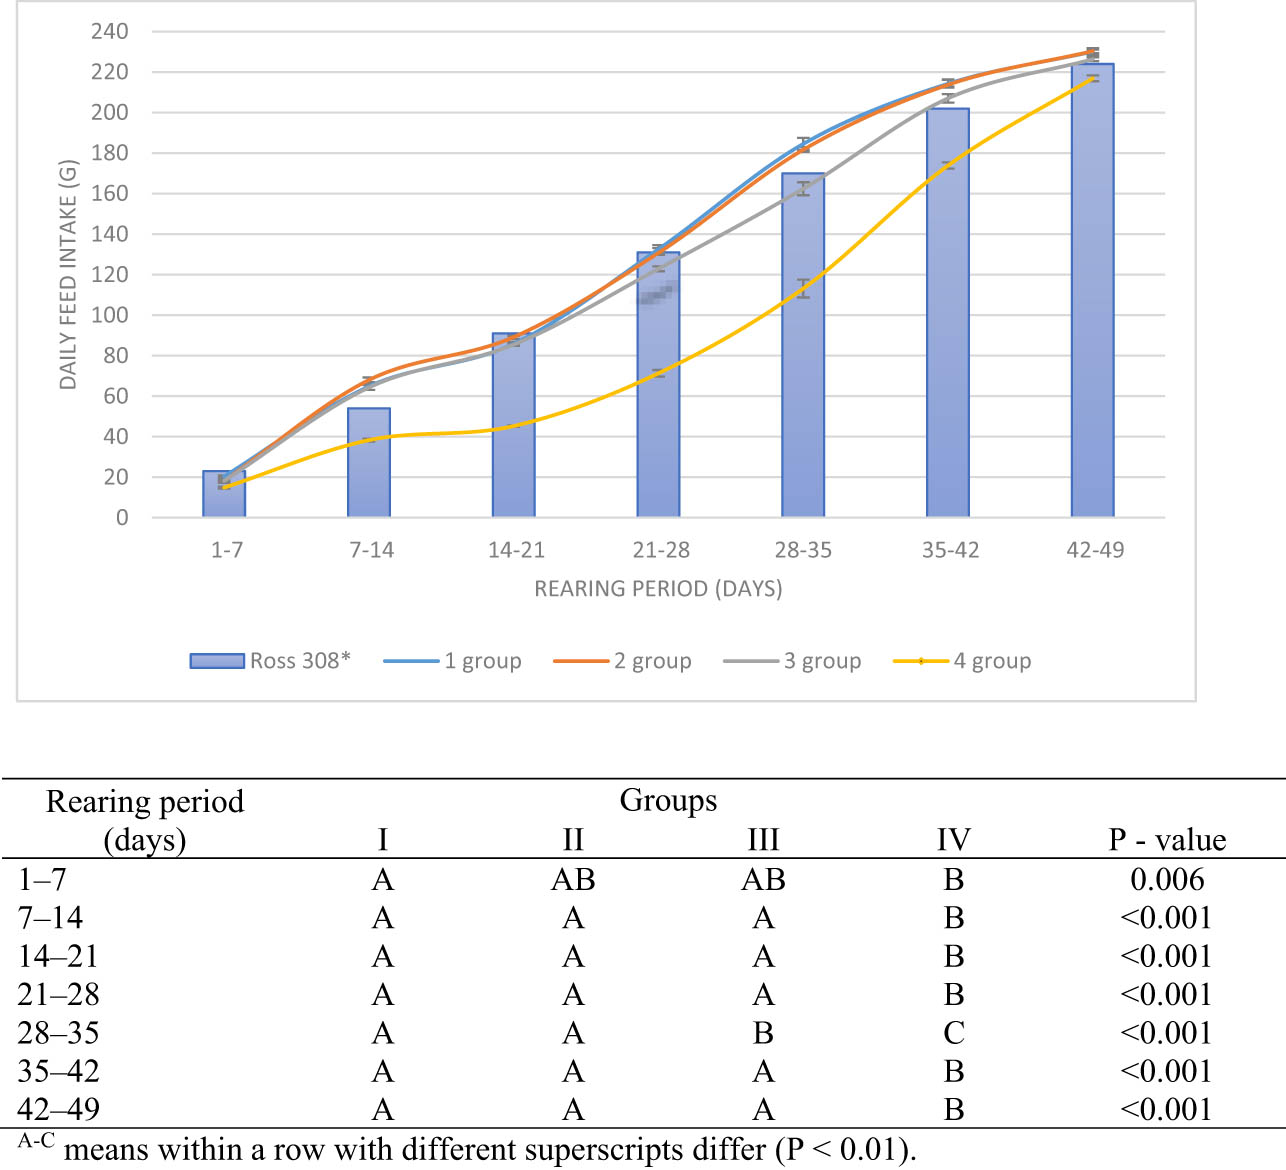
Figure 2
Average daily feed intake (FI) of broiler chickens fed with different high-protein wheat (HPW) contents (mean value ± SEM, n = 7).
Table 6
Average BW (g day–1) in broiler chickens fed with different HPW contents
| Day of life | Groups | SEM | P-value | |||
|---|---|---|---|---|---|---|
| I | II | III | IV | |||
| 1 | 45.82 | 46.10 | 45.09 | 46.52 | 0.576 | 0.373 |
| 7 | 189.52A | 182.13A | 170.86B | 126.50C | 3.282 | <0.001 |
| 14 | 468.92Aa | 439.98ABa | 408.45Bb | 243.01Cc | 7.919 | <0.001 |
| 21 | 905.40A | 834.02B | 767.17C | 432.50D | 15.933 | <0.001 |
| 28 | 1425.92A | 1332.11B | 1197.09C | 660.78D | 37.237 | <0.001 |
| 35 | 2257.85A | 2076.82B | 1866.56C | 1098.59D | 45.116 | <0.001 |
| 42 | 2999.80A | 2893.71A | 2529.28B | 1640.79C | 61.439 | <0.001 |
| 49 | 3664.80A | 3638.71A | 3094.28B | 2120.07C | 39.016 | <0.001 |
Abbreviations: BW – body weight, HPW – high-protein wheat.
SEM = pooled standard error of the mean derived from ANOVA model (based on n = 7 replicate pens per treatment group).
Table 7
Average FCR (kg kg–1) in broiler chickens fed with different HPW contents
| Rearing period (days) | Groups | SEM | P-value | |||
|---|---|---|---|---|---|---|
| I | II | III | IV | |||
| 1–7 | 0.75 | 0.70 | 0.75 | 0.82 | 0.044 | 0.290 |
| 7–14 | 1.04Bb | 1.10Bb | 1.14ABb | 1.25Aa | 0.029 | <0.001 |
| 14–21 | 1.20Bb | 1.33a | 1.38Aa | 1.44Aa | 0.027 | <0.001 |
| 21–28 | 1.42Bb | 1.52AB | 1.61a | 1.71A | 0.047 | 0.002 |
| 28–35 | 1.42B | 1.53AB | 1.58A | 1.67A | 0.030 | <0.001 |
| 35–42 | 1.54B | 1.58BC | 1.70AC | 1.73A | 0.026 | <0.001 |
| 42–49 | 1.69C | 1.69C | 1.88B | 2.02A | 0.021 | <0.001 |
| 1–49 | 1.71C | 1.71C | 1.91B | 2.06A | 0.022 | <0.001 |
Abbreviations: FCR – feed conversion ratio, HPW – high-protein wheat.
SEM = pooled standard error of the mean derived from ANOVA model (based on n = 7 replicate pens per treatment group).
Table 8
Average CPI (g per rearing period per head) of broiler chickens fed with different HPW contents
| Rearing period | Groups | SEM | P-value | |||
|---|---|---|---|---|---|---|
| I | II | III | IV | |||
| Starter | 115.85A | 103.51B | 94.43C | 57.09D | 1.836 | <0.001 |
| Grower | 344.50A | 309.00Ba | 283.87Bb | 150.55C | 5.657 | <0.001 |
| Finisher (to day 35) | 258.48A | 221.22B | 192.51C | 119.35D | 4.053 | <0.001 |
| Finisher (to day 42) | 549.54A | 495.68B | 441.75C | 297.34D | 8.824 | <0.001 |
| Finisher (to day 49) | 878.95A | 791.47B | 728.37C | 558.64D | 10.219 | <0.001 |
Abbreviations: CPI – crude protein intake, HPW – high-protein wheat.
SEM = pooled standard error of the mean derived from ANOVA model (based on n = 7 replicate pens per treatment group).
Table 9
Average PER (g g–1) of broiler chickens fed with different HPW contents
| Rearing period | Groups | SEM | P-value | |||
|---|---|---|---|---|---|---|
| I | II | III | IV | |||
| Starter | 3.66ab | 3.81a | 3.85a | 3.45b | 0.099 | 0.036 |
| Grower | 2.79 | 2.89 | 2.77 | 2.77 | 0.117 | 0.874 |
| Finisher (to day 35) | 3.22 | 3.37 | 3.35 | 3.38 | 0.183 | 0.920 |
| Finisher (to day 42) | 2.86b | 3.15ab | 3.02ab | 3.29a | 0.101 | 0.034 |
| Finisher (to day 49) | 2.49B | 2.96A | 2.61B | 2.61B | 0.044 | <0.001 |
Abbreviations: PER – protein efficiency ratio, HPW – high-protein wheat.
SEM = pooled standard error of the mean derived from ANOVA model (based on n = 7 replicate pens per treatment group).
Table 10
Price of the diet and the cost of feeding broiler chickens (EUR per tonne) fed with different HPW contents
| Item | Groups | SEM | P-value | |||
|---|---|---|---|---|---|---|
| I | II | III | IV | |||
| Price for a ton [EUR per ton] | ||||||
| Starter | 349.29 | 339.15 | 335.61 | 332.55 | ||
| Grower | 323.58 | 317.92 | 315.33 | 312.50 | ||
| Finisher | 302.59 | 295.28 | 292.92 | 291.04 | ||
| Cost of feeding (EUR per FI cumulatively in kg) | ||||||
| Starter | 0.17Aa | 0.17A | 0.16Ab | 0.10B | 0.003 | <0.001 |
| Grower | 0.50A | 0.49A | 0.46A | 0.25B | 0.010 | <0.001 |
| Finisher (to day 35) | 0.36A | 0.34AB | 0.30B | 0.21C | 0.011 | <0.001 |
| Finisher (to day 42) | 0.79A | 0.75AB | 0.69B | 0.50C | 0.017 | <0.001 |
| Finisher (to day 49) | 1.26A | 1.21ABa | 1.14Bb | 0.92C | 0.019 | <0.001 |
| Total cost of feeding (EUR per total FI cumulatively in kg) | ||||||
| To day 35 | 1.03A | 1.00AB | 0.92B | 0.56C | 0.022 | <0.001 |
| To day 42 | 1.46A | 1.41AB | 1.31B | 0.85C | 0.027 | <0.001 |
| To day 49 | 1.93A | 1.87A | 1.76B | 1.28C | 0.029 | <0.001 |
Abbreviations: HPW – high-protein wheat.
SEM = pooled standard error of the mean derived from ANOVA model (based on n = 7 replicate pens per treatment group).
Table 11
Average EPEF of broiler chickens fed with different HPW contents during the last feeding phase
| Rearing period | Groups | SEM | P-value | |||
|---|---|---|---|---|---|---|
| I | II | III | IV | |||
| Finisher (to day 35) | 454.48A | 387.22B | 337.96C | 189.55D | 7.803 | <0.001 |
| Finisher (to day 42) | 463.37A | 435.49A | 355.88B | 227.68C | 8.174 | <0.001 |
| Finisher (to day 49) | 443.13A | 440.34A | 336.18B | 214.49C | 7.913 | <0.001 |
Table 12
Hematological parameters in the serum of broiler chickens fed with different HPW contents
| Day | Normal range* | Groups | SEM | P-value | |||
|---|---|---|---|---|---|---|---|
| I | II | III | IV | ||||
| RBC, 106 µL–1 | |||||||
| 14th | 1.4–2.4 | 1.98 | 2.20 | 2.24 | 1.88 | 0.148 | 0.2685 |
| 21st | 2.1–3.2 | 2.47 | 2.42 | 2.30 | 2.17 | 0.153 | 0.5118 |
| 35th | 1.6–3.2 | 2.33 | 2.22 | 2.32 | 2.32 | 0.146 | 0.9314 |
| 42nd | 2.1–2.7 | 2.41 | 2.74 | 2.61 | 2.36 | 0.129 | 0.1503 |
| 49th | 2.2–2.9 | 2.52 | 2.56 | 2.36 | 2.49 | 0.124 | 0.7077 |
| WBC, 103 µL–1 | |||||||
| 14th | 26–47 | 33.87 | 32.48 | 28.39 | 38.00 | 4.990 | 0.6014 |
| 21st | 42–68 | 54.67 | 41.68 | 46.89 | 37.37 | 4.791 | 0.0914 |
| 35th | 19–39 | 27.68 | 34.48 | 28.64 | 29.52 | 2.307 | 0.1896 |
| 42nd | 24–66 | 38.77 | 43.30 | 45.52 | 43.17 | 4.749 | 0.8529 |
| 49th | 34–66 | 45.65 | 44.48 | 42.03 | 55.46 | 1.294 | 0.1165 |
Abbreviations: RBC – red blood cells, WBC – white blood cells.
SEM = pooled standard error of the mean derived from ANOVA model (based on n = 7 replicate pens per treatment group).
Table 13
Serum enzyme profile in broiler chickens fed with different HPW contents
| Day | Normal range* | Groups | SEM | P-value | |||
|---|---|---|---|---|---|---|---|
| I | II | III | IV | ||||
| ALT, U L–1 | |||||||
| 14th | 7.2–14.8 | 10.09 | 10.06 | 8.83 | 11.59 | 1.076 | 0.368 |
| 21st | 6.0 –9.8 | 8.09 | 8.64 | 8.84 | 8.39 | 0.796 | 0.916 |
| 35th | 8.1–11.9 | 9.67 | 11.03 | 12.10 | 10.34 | 1.256 | 0.572 |
| 42nd | 4.6–8.1 | 5.86 | 9.00 | 9.54 | 8.17 | 0.999 | 0.072 |
| 49th | 5.2–9.7 | 7.26 | 7.87 | 9.14 | 8.16 | 1.089 | 0.672 |
| AST, U L–1 | |||||||
| 14th | 177–214 | 199.31 | 207.66 | 191.06 | 186.94 | 7.559 | 0.246 |
| 21st | 165–240 | 197.81 | 189.47 | 170.36 | 174.94 | 7.561 | 0.060 |
| 35th | 250–586 | 376.37B | 470.64A | 342.49B | 186.33C | 50.181 | 0.005 |
| 42nd | 224–537 | 348.44B | 490.84A | 385.97B | 224.04C | 37.745 | 0.001 |
| 49th | 408–838 | 625.39 | 492.04 | 567.89 | 393.96 | 74.611 | 0.174 |
| ALP, U L–1 | |||||||
| 14th | 1000–4236 | 2712.57 | 2351.42 | 1950.85 | 1752.28 | 35.179 | 0.246 |
| 21st | 385–2796 | 1088.28 | 1878.85 | 1216.00 | 1248.57 | 33.189 | 0.353 |
| 35th | 302–597 | 417.71 | 265.14 | 363.42 | 396.57 | 7.619 | 0.512 |
| 42nd | 212–559 | 351.42 | 471.42 | 283.42 | 452.57 | 8.762 | 0.403 |
| 49th | 150–223 | 186.85A | 149.71A | 178.28A | 257.71B | 1.802 | 0.002 |
Abbreviations: ALT – alanine aminotransferase, AST – aspartate aminotransferase, ALP – alkaline phosphatase, HPW – high-protein wheat.
SEM = pooled standard error of the mean derived from ANOVA model (based on n = 7 replicate pens per treatment group).
Table 14
Protein and lipid metabolism in the serum of broiler chickens fed with different HPW contents
| Day | Normal range* | Groups | SEM | P-value | |||
|---|---|---|---|---|---|---|---|
| I | II | III | IV | ||||
| TP, g dL–1 | |||||||
| 14th | 2.1–3.2 | 2.59ab | 2.81ab | 2.87a | 2.11b | 0.188 | 0.035 |
| 21st | 2.1–3.1 | 2.73 | 2.67 | 2.63 | 2.33 | 0.110 | 0.073 |
| 35th | 2.2–3.3 | 2.84 | 3.01 | 2.76 | 2.71 | 0.219 | 0.078 |
| 42nd | 2.4–3.4 | 2.79 | 3.07 | 3.19 | 2.61 | 0.159 | 0.068 |
| 49th | 2.9–3.7 | 3.12 | 3.34 | 3.10 | 3.17 | 0.131 | 0.617 |
| Alb, g dL–1 | |||||||
| 14th | 1.2–1.6 | 1.37 A | 1.44 A | 1.37 A | 1.05B | 0.044 | <0.001 |
| 21st | 1.2–1.5 | 1.4a | 1.38ab | 1.38ab | 1.21b | 0.046 | 0.027 |
| 35th | 1.4–1.7 | 1.58 | 1.54 | 1.62 | 1.56 | 0.318 | 0.834 |
| 42nd | 1.6–2.2 | 1.81a | 1.82a | 1.82a | 1.57b | 0.328 | 0.034 |
| 49th | 1.4–2.0 | 1.64 | 1.78 | 1.61 | 1.66 | 0.086 | 0.516 |
| TCh, mg dL–1 | |||||||
| 14th | 95–149 | 121.16 | 140.73 | 124.43 | 124.70 | 8.217 | 0.350 |
| 21st | 104–124 | 115.59 | 119.23 | 121.46 | 120.02 | 5.283 | 0.875 |
| 35th | 122–175 | 143.80 | 120.39 | 131.16 | 126.24 | 7.330 | 0.166 |
| 42nd | 102–148 | 124.81 A | 90.37B | 86.11B | 87.91B | 5.710 | <0.001 |
| 49th | 64–102 | 85.63 | 84.69 | 77.80 | 90.60 | 3.941 | 0.176 |
Abbreviations: TP – total protein, Alb – albumin, TCh – total cholesterol concentration, HPW – high-protein wheat.
Pooled SEM = pooled standard error of the mean derived from ANOVA model (based on n = 7 replicate pens per treatment group).
Table 15
Renal function and mineral status in the serum of broiler chickens fed with different HPW contents
| Day | Normal range* | Groups | SEM | P-value | |||
|---|---|---|---|---|---|---|---|
| I | II | III | IV | ||||
| Cr, mg dL–1 | |||||||
| 14th | 0.3–0.3 | 0.301 | 0.300 | 0.300 | 0.300 | 0.001 | 0.998 |
| 21st | 0.3–0.4 | 0.314 | 0.343 | 0.286 | 0.271 | 0.020 | 0.087 |
| 35th | 0.2–0.3 | 0.286b | 0.329ab | 0.371a | 0.314ab | 0.020 | 0.039 |
| 42nd | 0.3–0.4 | 0.314 | 0.300 | 0.300 | 0.300 | 0.007 | 0.410 |
| 49th | 0.3–0.4 | 0.314 | 0.314 | 0.314 | 0.314 | 0.014 | 0.998 |
| P, mg dL–1 | |||||||
| 14th | 6.0–37.0 | 15.476 | 11.011 | 12.536 | 12.304 | 3.268 | 0.802 |
| 21st | 6.3–18.0 | 8.511 | 8.511 | 9.126 | 8.725 | 0.772 | 0.934 |
| 35th | 7.4–12.7 | 9.246 | 9.246 | 10.690 | 11.927 | 1.337 | 0.438 |
| 42nd | 7.1–10.6 | 9.169 | 9.169 | 8.184 | 5.496 | 1.194 | 0.125 |
| 49th | 6.6–11.6 | 8.310 | 8.310 | 7.519 | 8.006 | 0.622 | 0.782 |
Abbreviations: Cr – creatinine, P – phosphorus, HPW – high-protein wheat.
SEM = pooled standard error of the mean derived from ANOVA model (based on n = 7 replicate pens per treatment group).