
1. Introduction
The European Union is increasingly shifting toward reducing the use of genetically modified (GMO) plant-based feed ingredients, particularly soybean meal (SBM), which remains the primary protein source in poultry and pig production (Directive 2015/412/EU; Sieradzki et al., 2021; Pope et al., 2023). The majority of SBM used in the EU is imported and derived from GMO crops. Although non-GMO soybean varieties can provide comparable production results and may exhibit higher crude protein (CP) content under similar agronomic conditions (Di Mauro et al., 2023), their availability is limited. Non-GMO crops, including soybeans and maize, account for only approximately 10% of global production, which restricts their capacity to meet the growing demand for non-GMO feed materials (Liu et al., 2025). Consequently, interest in alternative protein sources has increased; however, their practical use is often constrained by the presence of anti-nutritional factors, limited availability, and variable nutritional value (Babatunde et al., 2021; Lestingi, 2024).
Wheat (Triticum aestivum) is widely used in poultry nutrition due to its high metabolizable energy (ME) content (12.9–15.8 MJ ME·kg–1) and moderate CP content (8–20%) across varieties and processing conditions (Pirgozliev et al., 2024). Nevertheless, its biological value (BV) is relatively low because of deficiencies in essential amino acids (EAAs), particularly lysine (Lys), threonine (Thr), methionine (Met), and tryptophan (Trp), as well as the predominance of glutamine (Gln) and proline (Pro) in wheat protein fractions (Shewry, 2023; Szuba-Trznadel et al., 2024). Wheat can constitute up to 40% of broiler feed mixtures, provided that exogenous enzymes are included to mitigate the effects of non-starch polysaccharides (NSPs) and reduce intestinal viscosity (Smulikowska & Rutkowski, 2018; Lee et al., 2024). Recently, high-protein wheat (HPW) cultivars containing 16–17% CP and improved amino acid profiles have gained attention as potential partial substitutes for SBM (Sułek et al., 2023). However, the replacement of SBM with HPW typically requires supplementation with crystalline amino acids (AAs), which may not only reduce feed costs and nitrogen excretion but can also influence feed conversion ratio (FCR) and body fat deposition (Garcia Neto et al., 2000; Saleh et al., 2021). Additionally, the high starch content of wheat-based diets may affect energy utilization efficiency and carcass composition (Cordero et al., 2025).
The aim of this study was to investigate whether increasing levels of HPW can partially replace SBM in broiler diets without adversely affecting growth performance, FCR, or selected blood and serum biochemical parameters, while simultaneously reducing feed costs. Furthermore, the study aimed to evaluate whether increasing the proportion of locally produced feed components at the expense of imported ingredients could improve economic outcomes. An additional objective was to consider the potential environmental benefits of such dietary strategies, particularly in terms of reducing the carbon footprint associated with feed production and transport. We hypothesized that the partial or complete substitution of SBM with HPW would maintain optimal growth performance and physiological status (reflected by haematological and biochemical parameters) in broiler chickens, while simultaneously improving the economic efficiency of production and potentially reducing its environmental impact.
2. Material and methods
2.1. Animal ethics
All experimental procedures, including the humane euthanasia of birds for blood sampling via CO2 stunning and decapitation, were reviewed and approved by the Animal Welfare Advisory Team at Wrocław University of Environmental and Life Sciences (Ethical statement no. 04/2023) in compliance with Directive 2010/63/EU.
2.2. Feed component
The study evaluated HPW supplied by Saatbau Poland Sp. z o.o. (Środa Śląska, Poland) as a protein substitute in broiler diets.
The HPW utilized in this study was Activus, a winter wheat cultivar classified in the A quality class, bred by Saatbau Linz GmbH (Austria). This cultivar is characterized by an elevated grain protein content and high baking quality. The batch used in this trial was analysed for its basic nutritional profile, showing a total protein content of 16% (Szuba-Trznadel et al., 2024), making it suitable for high-spec poultry diet formulations.
2.3. Animals and husbandry
The experiment was conducted at the Research and Education Station in Swojczyce, Wrocław University of Environmental and Life Sciences. A total of 196 one-day-old Ross 308 broiler chickens were obtained from ModerHatch hatchery (Magnuszowice, Poland). Upon arrival, broilers were individually weighed and randomly allocated to pens to achieve a uniform initial pen body weight (BW) (46 g ± 1.53 per pen), following a completely randomized design.
Birds were assigned to four experimental groups: group I (control), and groups II, III, and IV. Each group consisted of seven pens with seven birds per pen. Broilers were reared under standard conditions in accordance with Polish animal welfare regulations (Journal of Laws of the Republic of Poland, 2015, item 266, as amended in 2023, item 465) and Ross 308 management guidelines (Ross Broiler Management Handbook, 2018).
The ambient temperature was set at 32°C on day 1, gradually reduced to 24°C by the end of the second week, and maintained at 20–21°C thereafter. Relative humidity ranged from 60 to 73%. The lighting program provided 22 h of light and 2 h of darkness during the first week, adjusted to 18 h of light and 6 h of darkness from the second week onward. Feed and water were provided ad libitum. Each pen was equipped with a hopper feeder and two nipple drinkers with adjustable heights.
2.4. Dietary treatments
Birds were fed starter (days 1–14), grower (days 15–29), and finisher (days 30–49) diets. The finisher phase was extended by 1 week beyond the typical rearing period. Group I served as a wheat-based control (58% inclusion), while groups II–IV received diets with progressively increasing levels of HPW at the expense of SBM. The detailed composition of experimental diets is shown in Tables 1–3. Changes in SBM and HPW inclusion across feeding phases are presented in Table 4, while selected nutritional parameters are shown in Table 5.
Table 1
Composition of feed mixtures for broiler chickens (starter)
| Ingredient, g·kg–1 | Groups | |||
|---|---|---|---|---|
| I | II | III | IV | |
| Wheat (Activus cv.) | 580.1 | 711.1 | 776.1 | 840.6 |
| Soybean meal (CP 48%) | 256.5 | 128.0 | 64.0 | — |
| Feed wheat flour | 85.0 | 85.0 | 85.0 | 85.0 |
| Soybean oil | 35.0 | 17.8 | 9.3 | 1.0 |
| Choline chloride 60% | 2.8 | 2.8 | 2.8 | 2.8 |
| Sodium bicarbonate (NaHCO3) | 1.5 | 1.5 | 1.5 | 1.5 |
| 1-Ca phosphate | 7.4 | 8.5 | 9.0 | 9.5 |
| Chalk | 12.8 | 13.2 | 13.5 | 14.1 |
| Premix (Broiler Starter Green Line)1 | 2.0 | 2.0 | 2.0 | 2.0 |
| dl-methionine (99%)2 | 4.1 | 5.3 | 5.9 | 6.5 |
| l-arginine (97%)2 | 1.7 | 5.5 | 7.3 | 9.2 |
| l-lysine HCl (78.9%)2 | 4.8 | 8.8 | 10.8 | 12.8 |
| l-threonine (99%)2 | 2.0 | 3.8 | 4.7 | 5.6 |
| l-tryptophan (98%)2 | — | 0.6 | 0.9 | 1.1 |
| l-valine (96.5%)2 | 0.4 | 2.6 | 3.6 | 4.7 |
| Sodium sulphate | 1.0 | 1.0 | 1.0 | 1.0 |
| Salt | 1.1 | 1.0 | 0.9 | 0.9 |
| Sacox 120 microGranulate3 | 1.3 | 1.3 | 1.3 | 1.3 |
| Enzyme phytase4 | 0.2 | 0.2 | 0.2 | 0.2 |
| Enzyme xylanase5 | 0.2 | 0.2 | 0.2 | 0.2 |
[i] 1Each 1 kg of premix contained (Broiler Starter Green Line): Vitamins: A 6000000.00 IU, D3 1250000.00 IU, 25-hydroxycholeciferol 18750.00 mcg, E 50000.00 mg, K3 2000.00 mg, B1 1750.00 mg, B2 4500.00 mg, Ca pantothenate 7499.94 mg, B6 2500.00 mg, B12 15000.00 mcg, niacin 32500.00 mg, folic acid 1000.00 mg, biotin 100000.00 mcg. Minerals: Ca 14.53%, Mg 0.01%, Na 1.76%. Fe 10000.00 mg, Cu 8000.00 mg, Mn 60000.00 mg, Zn 55000.00 mg, I 625.00 mg, Se 150.00 mg. Enzymes: 6-phytase 750000.00 FYT, endo–1,4-beta-xylanase 100000.00 FXU. Others: citric acid 12.00 mg, butylhydroxytoluene 48.19 mg. propyl gallate 3.96 mg, clinoptilolite of sedimentary origin 20000.00 mg·kg–1.
[iii] 3Sacox 120 microGranulate – salinomycin sodium salt 120 g: salinomycin sodium: 114–132 g; silicon dioxide: 10–100 g·kg–1; calcium carbonate: 500–700 g.
[vi] *Digestible amino acid – according to nutritional recommendations for poultry (Smulikowska & Rutkowski, 2018) – crystalline AAs are completely absorbed in the small intestine and their availability is assumed to be 100%.
Table 2
Composition of feed mixtures for broiler chickens (grower)
| Ingredient, g·kg–1 | Groups | |||
|---|---|---|---|---|
| I | II | III | IV | |
| Wheat (Activus cv.) | 669.3 | 777.7 | 831.1 | 884.5 |
| Soybean meal (CP 48%) | 211.4 | 105.0 | 52.5 | — |
| Feed wheat flour | 49.9 | 50.0 | 50.0 | 50.0 |
| Soybean oil | 30.5 | 16.3 | 9.3 | 2.3 |
| Choline chloride 60% | 2.7 | 2.7 | 2.7 | 2.7 |
| Sodium bicarbonate (NaHCO3) | 1.5 | 1.5 | 1.5 | 1.5 |
| 1-Ca phosphate | 5.9 | 6.8 | 7.2 | 7.7 |
| Chalk | 11.2 | 11.5 | 11.7 | 11.8 |
| Premix (Broiler Grower Green Line)1 | 2.0 | 2.0 | 2.0 | 2.0 |
| dl-methionine (99%)2 | 3.9 | 4.9 | 5.4 | 5.9 |
| l-arginine (97%)2 | 4.5 | 7.8 | 9.5 | 11.1 |
| l-lysine HCl (79.8%)2 | 1.6 | 3.1 | 3.8 | 4.6 |
| l-threonine (99%)2 | — | 0.4 | 0.7 | 0.9 |
| l-tryptophan (98%)2 | 0.2 | 1.9 | 2.8 | 3.7 |
| l-valine (96.5%)2 | 1.0 | 1.0 | 1.0 | 1.0 |
| Sodium sulphate | 1.0 | 0.9 | 0.9 | 0.8 |
| Sacox 120 microGranulate3 | 1.3 | 1.3 | 1.3 | 1.3 |
| Enzyme phytase4 | 0.2 | 0.2 | 0.2 | 0.2 |
| Enzyme xylanase5 | 0.2 | 0.2 | 0.2 | 0.2 |
[i] 1Each 1 kg of premix contained (Broiler Grower Green Line): Vitamins: A 5000000.00 IU, D3 2000000.00 IU, E 50000.00 mg, K3 2000.00 mg, B1 1500.00 mg, B2 4000.00 mg, Ca pantothenate 7499.94 mg, B6 2500.00 mg, B12 15000.00 mcg, niacin 32500.00 mg, folic acid 1000.00 mg, biotin 125000.00 mcg. Minerals: Ca 14.59%, Mg 0.01%, Na 1.76%. Fe 10000.00 mg, Cu 8000.00 mg, Mn 60000.00 mg, Zn 55000.00 mg, I 625.00 mg, Se 150.00 mg. Enzymes: 6-phytase 750000.00 FYT, endo–1,4-beta-xylanase 100000.00 FXU. Others: citric acid 12.00 mg, butylhydroxytoluene 48.19 mg, propyl gallate 3.96 mg, clinopptilolite of sedimentary origin 20000.00 mg.
[iii] 3Sacox 120 microGranulate – salinomycin sodium salt 120 g·kg–1: salinomycin sodium: 114–132 g·kg–1; silicon dioxide: 10–100 g·kg–1; calcium carbonate: 500–700 g·kg–1.
[vi] *Digestible amino acid – according to nutritional recommendations for poultry (Smulikowska & Rutkowski, 2018) – crystalline AAs are completely absorbed in the small intestine and their availability is assumed to be 100%.
Table 3
Composition of feed mixtures for broiler chickens (finisher)
| Ingredient, g·kg–1 | Groups | |||
|---|---|---|---|---|
| I | II | III | IV | |
| Wheat (Activus cv.) | 726.6 | 810.4 | 851.7 | 891.9 |
| Soybean meal (CP 48%) | 161.9 | 80.0 | 40.0 | — |
| Feed wheat flour | 50.0 | 50.0 | 49.7 | 50.0 |
| Soybean oil | 28.5 | 17.5 | 12.0 | 6.8 |
| Choline chloride 60% | 2.7 | 2.7 | 2.7 | 2.7 |
| Sodium bicarbonate (NaHCO3) | 1.1 | 1.1 | 1.1 | 1.1 |
| 1-Ca phosphate | 4.5 | 5.2 | 5.5 | 5.9 |
| Chalk | 10.4 | 10.4 | 10.3 | 10.7 |
| Premix (Broiler Finisher Green Line)1 | 2.0 | 2.0 | 2.0 | 2.0 |
| dl-methionine (99%)2 | 3.2 | 4.0 | 4.4 | 4.7 |
| l-arginine (97%)2 | 1.6 | 4.0 | 5.2 | 6.3 |
| l-lysine HCl (79.8%)2 | 4.3 | 6.9 | 8.2 | 9.4 |
| l-threonine (99%)2 | 1.3 | 2.4 | 3.0 | 3.5 |
| l-tryptophan (98%)2 | — | 0.2 | 0.4 | 0.6 |
| l-valine (96.5%)2 | — | 1.4 | 2.0 | 2.7 |
| Sodium sulphate | 1.0 | 1.0 | 1.0 | 1.0 |
| Salt | 0.5 | 0.4 | 0.4 | 0.3 |
| Enzyme phytase3 | 0.2 | 0.2 | 0.2 | 0.2 |
| Enzyme xylanase4 | 0.2 | 0.2 | 0.2 | 0.2 |
[i] 1Each 1 kg of premix contained (Broiler Finisher Green Line): Vitamins: A 5000000.00 IU, D3 2000000.00 IU, E 40000.00 mg, K3 1500.00 mg, B1 1000.00 mg, B2 3500.00 mg, Ca pantothenate 6250.44 mg, B6 2000.00 mg, B12 10000.00 mcg, niacin 25000.00 mg, folic acid 1000.00 mg, biotin 100000.00 mcg. Minerals: Ca 15.83%, Mg 0.01%, Na 1.76%. Fe 10000.00 mg, Cu 8000.00 mg, Mn 60000.00 mg, Zn 55000.00 mg, I 625.00 mg, Se 150.00 mg. Enzymes: 6-phytase 750000.00 FYT, endo–1,4-beta-xylanase 100000.00 FXU. Others: citric acid 12.00 mg·kg–1, butylhydroxytoluene 48.19 mg·kg–1, propyl gallate 3.96 mg·kg–1, clinoptilolite of sedimentary origin 20000.00 mg·kg–1.
[v] *Digestible amino acid – according to nutritional recommendations for poultry (Smulikowska & Rutkowski, 2018) – crystalline AAs are completely absorbed in the small intestine and their availability is assumed to be 100%.
Table 4
Wheat and soybean meal content in experimental mixtures (%)
| Group I | Group II | Group III | Group IV | |
|---|---|---|---|---|
| SBM | 30 | 15 | 7.5 | 0100 |
| HPW | 60 | 75 | 82.5 | 100 |
Table 5
Nutritional value (in kg of feed mixture) of diets for broiler chickens
| Groups | I | II | III | IV | I | II | III | IV | I | II | III | IV |
|---|---|---|---|---|---|---|---|---|---|---|---|---|
| Starter phase (1–14) | Grower phase (15–29) | Finisher phase (30–49) | ||||||||||
| CA, g | 59.8 | 48.6 | 42.5 | 56.8 | 46.7 | 46.6 | 42.8 | 30.4 | 41.7 | 39.4 | 23.3 | 31.7 |
| CP, g | 236.4 | 217.6 | 214.5 | 196.8 | 225.0 | 215.1 | 206.2 | 199.5 | 207.0 | 196.1 | 187.4 | 176.8 |
| EE, g | 36.6 | 22.8 | 23.2 | 23.8 | 40.4 | 34.1 | 27.1 | 19.3 | 38.5 | 28.2 | 22.3 | 19.7 |
| CF, g | 26.4 | 21.6 | 18.4 | 16.0 | 21.0 | 18.5 | 18.5 | 25.7 | 26.0 | 24.2 | 23.1 | 20.4 |
| Ca, g | 9.80 | 9.12 | 9.53 | 9.45 | 8.50 | 8.93 | 8.56 | 9.18 | 8.59 | 8.79 | 8.54 | 7.77 |
| P, g | 6.42 | 6.60 | 6.71 | 6.15 | 6.17 | 6.33 | 6.18 | 6.67 | 6.47 | 6.49 | 6.32 | 6.67 |
| Na, g | 2.09 | 2.02 | 2.06 | 2.01 | 1.60 | 2.09 | 1.47 | 1.45 | 1.69 | 1.25 | 1.53 | 1.43 |
| Lys, g | 17.96 | 18.70 | 18.19 | 18.03 | 13.24 | 13.20 | 13.27 | 13.04 | 11.68 | 11.27 | 11.64 | 11.93 |
| Met + Cys, g | 9.64 | 9.11 | 9.04 | 9.30 | 9.52 | 9.17 | 8.93 | 8.72 | 9.12 | 9.25 | 9.67 | 9.82 |
| Thr, g | 9.93 | 9.48 | 9.46 | 9.41 | 8.54 | 8.77 | 8.68 | 9.26 | 6.71 | 6.73 | 6.18 | 7.10 |
| Trp, g | 2.58 | 2.40 | 2.39 | 2.30 | 1.68 | 1.48 | 1.49 | 1.43 | 1.35 | 1.29 | 1.33 | 1.15 |
| Arg, g | 14.80 | 15.01 | 14.89 | 14.93 | 12.83 | 13.35 | 13.91 | 13.24 | 10.13 | 10.03 | 10.31 | 10.35 |
| Val, g | 10.06 | 9.93 | 10.18 | 10.10 | 8.17 | 8.18 | 8.77 | 8.68 | 8.17 | 8.14 | 8.40 | 8.73 |
CA, crude ash; CP, crude protein; EE, ether extract (crude fat); CF, crude fibre; Ca, calcium; P, phosphorus; Na, sodium; Lys, lysine; Met + Cys, methionine + cystine; Thr, threonine; Trp, tryptophan; Arg, arginine; Val, valine.
All diets were formulated to be isoenergetic. ME was standardized at approximately 12.68 MJ·ME·kg−1 (starter), 13.02 MJ ME·kg−1 (grower), and 13.18 MJ ME·kg−1 (finisher) by adjusting soybean oil inclusion. While the CP content in group I was slightly higher than Polish standard recommendations, the formulation was adjusted in collaboration with the feed manufacturer (Neorol Sp. z o.o.) to align with the specific nutritional requirements of the Ross 308 lineage. Conversely, in groups II–IV, the CP content was intentionally and progressively reduced below reference values as HPW inclusion increased. EAAs requirements were met via crystalline amino acid supplementation according to Polish Nutritional Recommendations for Poultry (Smulikowska & Rutkowski, 2018). To mitigate potential adverse effects of high HPW inclusion, all diets were supplemented with commercial enzyme preparations: xylanase (Ronozyme® WX, DSM Nutritional Products, The Netherlands), containing endo–1,4-β-xylanase (EC 3.2.1.8); guaranteed minimum activity of 1,000 FXU·g−1, included at 0.02%, providing a final activity of 200 FXU·kg−1 of feed and phytase (Ronozyme® HiPhos, DSM Nutritional Products, The Netherlands), containing 6-phytase (EC 3.1.3.26); guaranteed minimum activity of 10,000 FYT·g−1, included at 0.02%, providing a final activity of 2,000 FYT·kg−1 of feed.
2.5. Performance measurement and sampling
The experimental period was extended to 49 days based on the specific nature of the dietary treatments (high to complete replacement of SBM with HPW). This extension enabled the assessment of altered growth trajectories and compensatory growth, as well as the physiological maturity and quality of the carcass.
2.5.1. Production performance
BW was recorded individually every week. Body weight gain (BWG) was calculated as the difference between initial and final BW over defined periods. Feed intake (FI) was measured daily per pen as the difference between feed offered and feed refusals. FCR is calculated as follows:
2.5.2. Rearing efficiency indicators
Crude protein intake (CPI) and protein efficiency ratio (PER) are calculated for each phase:
The cost of feeding (CostF) was calculated for each experimental group and feeding phase based on the cumulative FI and the price per kilogram of the respective diet (P), according to the following formula:The total feeding cost (TCostF) over the entire rearing period was determined as the sum of the costs incurred during the starter (S), grower (G), and finisher (F) phases:The European production efficiency factor (EPEF) is evaluated for the final phase:2.5.3. Blood sample collection and analysis
The number of birds per pen decreased progressively due to scheduled sampling (one bird per pen at each time point), and bird-days were accounted for in all performance calculations. Blood was collected once from each bird by the same well-trained operator, and the collected volume was divided into two sample aliquots. All analytical procedures for the determination of haematological and biochemical parameters were performed in technical duplicate. The duplicate measurements were averaged prior to statistical analysis.
Because individual haematological and biochemical parameters may exhibit age-dependent variation, the age-appropriate normal ranges were defined as the interval between the 2.5th and 97.5th percentiles of the distribution of values obtained from birds in the control group (group I).
2.5.3.1. Assessment of haematological parameters
Blood was collected into tubes containing K2EDTA (PROFILAB, No 324, Poland) as an anticoagulant. Quantitative assessments of erythrocytes (red blood cell (RBC)) and leukocytes (white blood cell (WBC)) were performed manually using a Bürker haemocytometer and Natt–Herrick solution in dilution 1:200 (self-made according to the recipe found in Thrall et al., 2006).
2.5.3.2. Assessment of biochemical parameters
Blood samples were collected into plastic tubes without anticoagulant and allowed to clot to obtain serum. Biochemical parameters were determined using kinetic methods for alanine aminotransferase – ALT (Alpha Diagnostics, No A6425–125, Poland), aspartate aminotransferase – AST (Alpha Diagnostic, No A6461–125, Poland), alkaline phosphatase – ALP (Alpha Diagnostics, No A6406-075, Poland), and creatinine – Cr (Pointe Scientific, No C7539–100, USA), and colorimetric methods for total protein – TP (Pointe Scientific, No C7528–100, USA), albumin – Alb (Alpha Diagnostics, No A6502–100, Poland), total cholesterol – TCh (CHOD–PAP method, Pointe Scientific, No C7510–100, USA), and phosphorus – P (Alpha Diagnostics, No A6516–100, Poland) using appropriate commercial kits. For enzymatic assays, the rate of increase in absorbance was directly proportional to the enzyme activity. In colorimetric methods, the colour intensity of the sample corresponded to the concentration of the parameter. All parameters were measured using the biochemical analyser Pointe 180 (Pointe Scientific, Poland). Reagents were reconstituted, and the appropriate wavelengths were selected following the manufacturer’s guidelines.
2.6. Data analysis
Data were organized using Microsoft Excel (Microsoft Corp., Redmond, WA, USA, 2019). Statistical analyses were performed with Statistica 13 (Tibco Software Inc., Palo Alto, CA, USA, 2017). Data distribution was checked separately within each group using the Shapiro–Wilk test. Homogeneity of variance between groups was assessed with Levene’s test. One-way analysis of variance (ANOVA) was used for statistical comparison, followed by Tukey’s honestly significant difference test to determine significant differences between group means. Statistical significance was set at P < 0.05 and P < 0.01. Obtained results are presented in tables and figures. Results in tables are presented as arithmetic means with the standard error of the mean (SEM). The SEM values presented in the tables represent pooled SEMs calculated from the residual mean square error obtained from the ANOVA/generalized linear model. Figures 1 and 2 show means with error bars. Significant differences between groups (indicated by different superscript letters) and corresponding P-values are presented in tables below each figure.
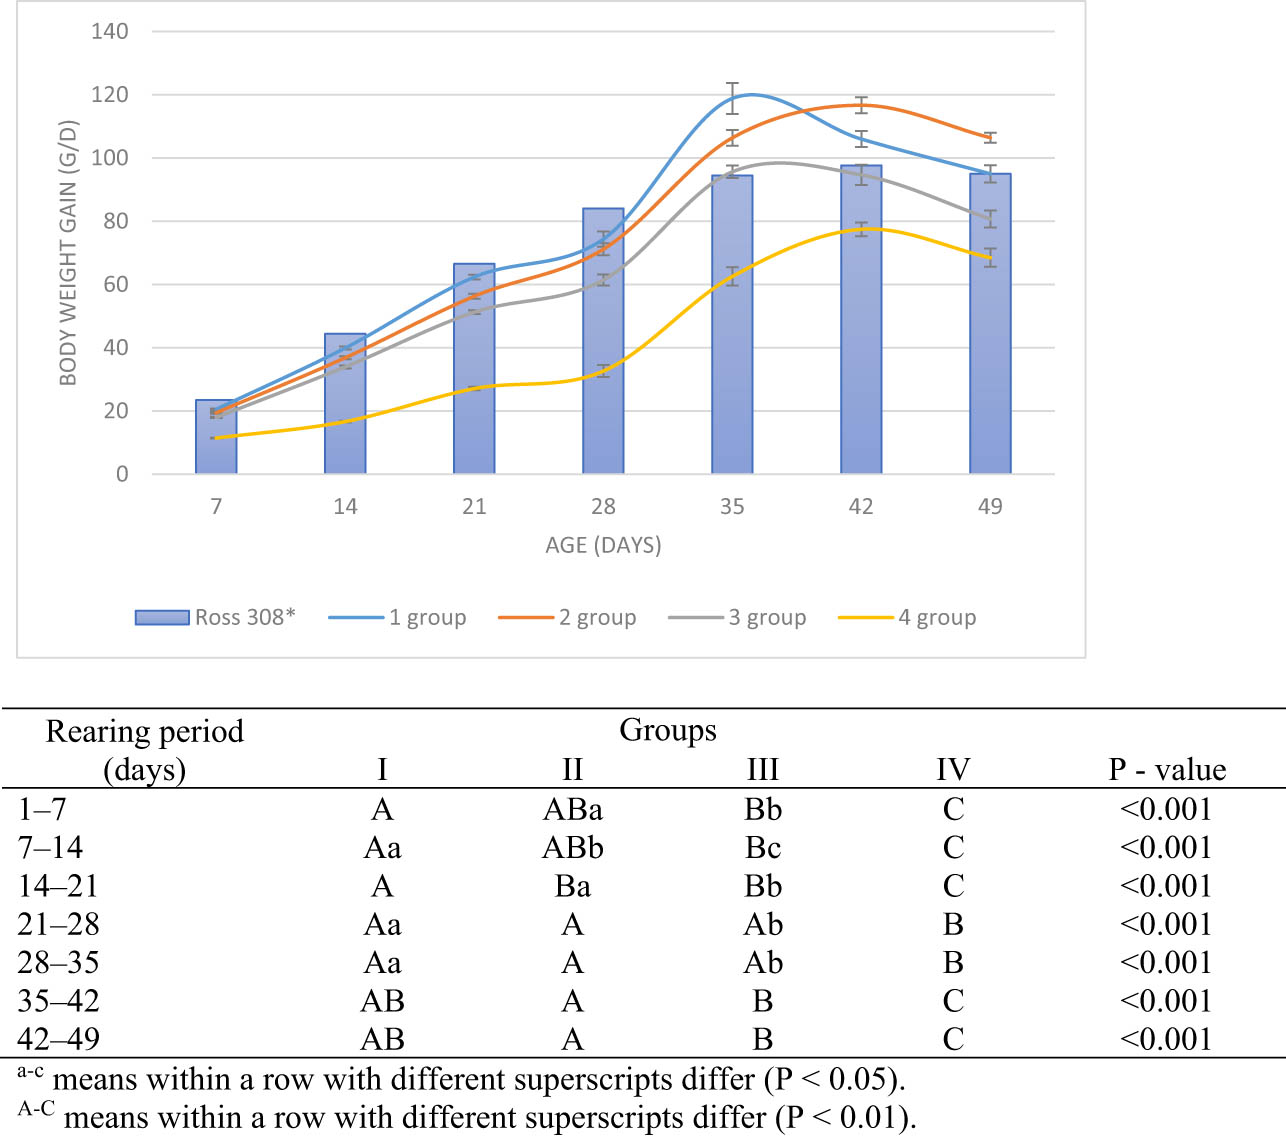
Figure 1
Average body weight gain (BWG) of broiler chickens fed with different high-protein wheat (HPW) contents (mean value ± SEM, n = 7).
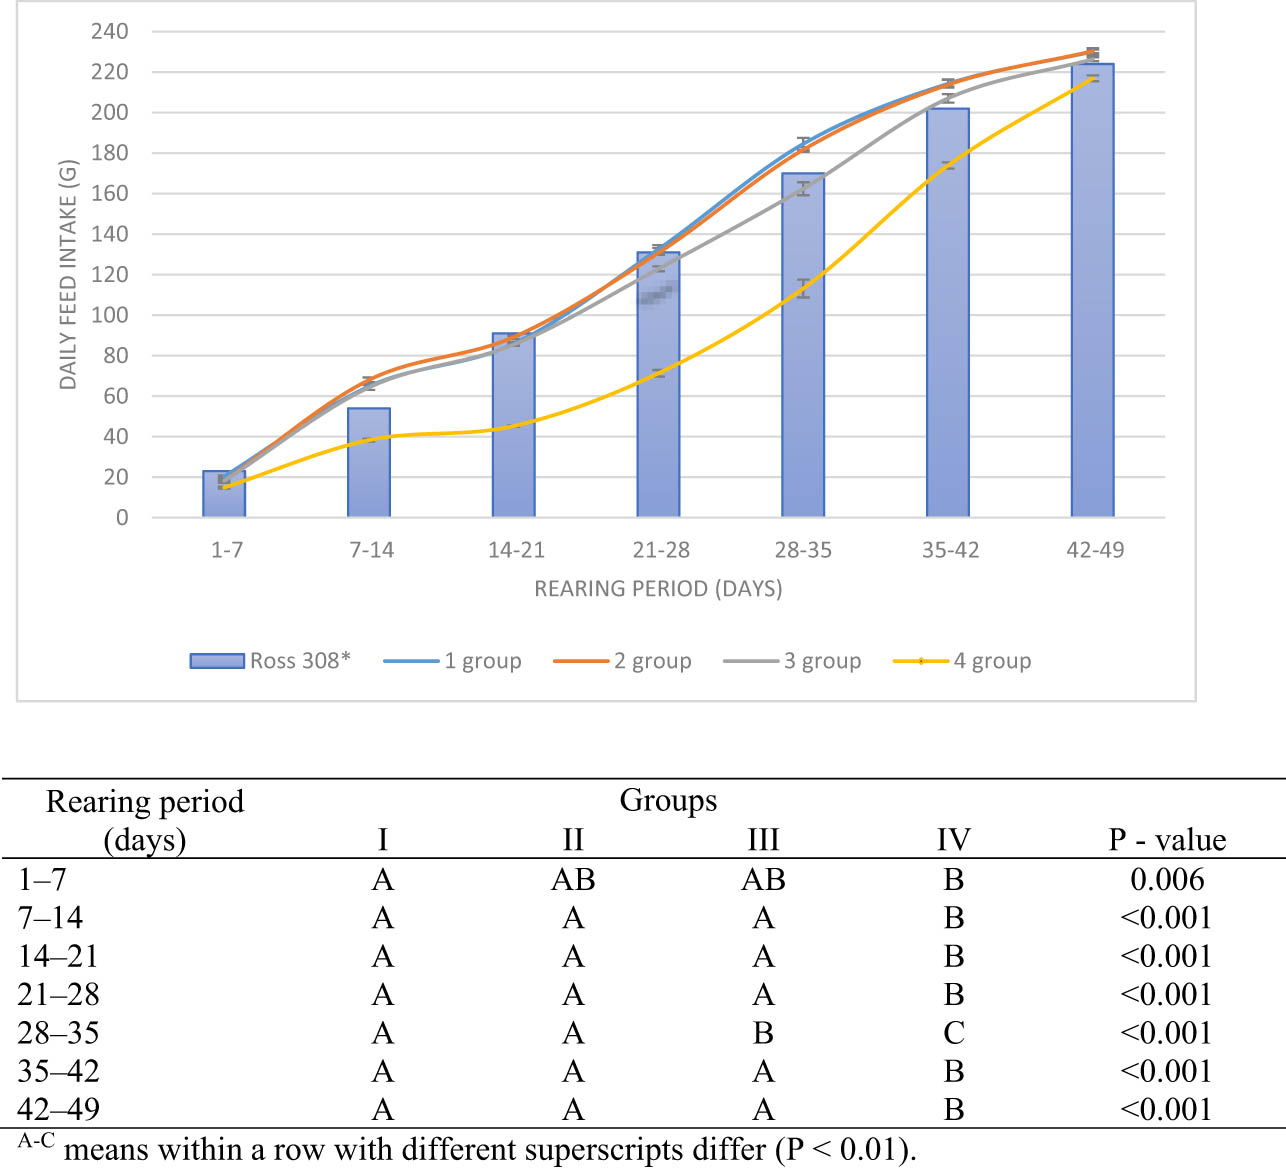
Figure 2
Average daily feed intake (FI) of broiler chickens fed with different high-protein wheat (HPW) contents (mean value ± SEM, n = 7).
3. Results
3.1. Performance
Weekly BW values of broiler chickens are presented in Table 6. No significant differences among groups were observed during the first week of life. However, from day 7 onward, birds in group I (58% HPW) and group II (71.1% HPW) exhibited significantly higher BW (P < 0.01) compared with groups III (77.6% HPW) and IV (84.1% HPW). On day 14, groups I and II remained heavier (P < 0.01) than group IV, while group III showed a significant reduction in BW compared to both the control group and group II (P < 0.05).
Table 6
Average BW (g day–1) in broiler chickens fed with different HPW contents
| Day of life | Groups | SEM | P-value | |||
|---|---|---|---|---|---|---|
| I | II | III | IV | |||
| 1 | 45.82 | 46.10 | 45.09 | 46.52 | 0.576 | 0.373 |
| 7 | 189.52A | 182.13A | 170.86B | 126.50C | 3.282 | <0.001 |
| 14 | 468.92Aa | 439.98ABa | 408.45Bb | 243.01Cc | 7.919 | <0.001 |
| 21 | 905.40A | 834.02B | 767.17C | 432.50D | 15.933 | <0.001 |
| 28 | 1425.92A | 1332.11B | 1197.09C | 660.78D | 37.237 | <0.001 |
| 35 | 2257.85A | 2076.82B | 1866.56C | 1098.59D | 45.116 | <0.001 |
| 42 | 2999.80A | 2893.71A | 2529.28B | 1640.79C | 61.439 | <0.001 |
| 49 | 3664.80A | 3638.71A | 3094.28B | 2120.07C | 39.016 | <0.001 |
Abbreviations: BW – body weight, HPW – high-protein wheat.
SEM = pooled standard error of the mean derived from ANOVA model (based on n = 7 replicate pens per treatment group).
By day 21, BW decreased linearly as HPW inclusion increased (P < 0.01), with the highest BW recorded in the control group. This linear pattern persisted through days 28 and 35 (P < 0.01). By day 42, no significant difference was observed between groups I and II; however, both were significantly heavier than groups III and IV (P < 0.01). At the end of the experiment (day 49), groups I and II exhibited comparable BW, whereas groups III and IV remained significantly lighter (P < 0.01). Overall, group II maintained a BW similar to the control group, while higher HPW inclusion levels resulted in BW reductions of approximately 16% and 42% in groups III and IV, respectively.
Daily BWG is illustrated in Figure 1. Notably, group II showed an upward trend in BWG during the later stages of rearing, approaching or even exceeding control values.
FI across the rearing phases is summarized in Figure 2. During the starter phase, group IV consumed significantly less feed (14.85 g·day–1·bird–1) than the control group (20.35 g·day–1·bird–1; P < 0.01). Between days 7 and 14, FI was comparable among groups with HPW inclusion up to 77.6% (64.29–67.96 g·day–1·bird–1) but remained significantly lower in group IV (38.28 g·day–1·bird–1; P < 0.01). This reduction in FI associated with higher HPW inclusion persisted throughout the duration of the experiment.
FCR results are presented in Table 7. During the first week, FCR averaged 0.75 kg·kg–1, with no significant differences among groups. From the second week onward, group IV consistently exhibited the poorest (highest) FCR (P < 0.05 to P < 0.01), whereas groups I and II remained comparable. This trend persisted throughout the entire experimental period.
Table 7
Average FCR (kg kg–1) in broiler chickens fed with different HPW contents
| Rearing period (days) | Groups | SEM | P-value | |||
|---|---|---|---|---|---|---|
| I | II | III | IV | |||
| 1–7 | 0.75 | 0.70 | 0.75 | 0.82 | 0.044 | 0.290 |
| 7–14 | 1.04Bb | 1.10Bb | 1.14ABb | 1.25Aa | 0.029 | <0.001 |
| 14–21 | 1.20Bb | 1.33a | 1.38Aa | 1.44Aa | 0.027 | <0.001 |
| 21–28 | 1.42Bb | 1.52AB | 1.61a | 1.71A | 0.047 | 0.002 |
| 28–35 | 1.42B | 1.53AB | 1.58A | 1.67A | 0.030 | <0.001 |
| 35–42 | 1.54B | 1.58BC | 1.70AC | 1.73A | 0.026 | <0.001 |
| 42–49 | 1.69C | 1.69C | 1.88B | 2.02A | 0.021 | <0.001 |
| 1–49 | 1.71C | 1.71C | 1.91B | 2.06A | 0.022 | <0.001 |
Abbreviations: FCR – feed conversion ratio, HPW – high-protein wheat.
SEM = pooled standard error of the mean derived from ANOVA model (based on n = 7 replicate pens per treatment group).
Regarding mortality, no bird losses or health complications were observed during the entire 49-day experimental period. Because there was no mortality, no adjustments for missing bird-days due to the death were required in the final FCR and EPEF calculations.
3.2. Rearing efficiency indicators
3.2.1. Protein utilization indicators
Average CPI during each feeding phase is shown in Table 8. In the starter phase, CPI was the highest in the control group (P < 0.01) and decreased progressively as HPW inclusion increased, with the most substantial reduction observed in group IV. During the grower phase, significant differences (P < 0.01) were observed between the control group, group II, and the remaining experimental groups. Cumulative CPI up to day 49 was highest in the control group, with all groups differing significantly from one another (P < 0.01). Compared with the control group, cumulative CPI was reduced by 8.9%, 17.3%, and 36.3% in groups II, III, and IV, respectively.
Table 8
Average CPI (g per rearing period per head) of broiler chickens fed with different HPW contents
| Rearing period | Groups | SEM | P-value | |||
|---|---|---|---|---|---|---|
| I | II | III | IV | |||
| Starter | 115.85A | 103.51B | 94.43C | 57.09D | 1.836 | <0.001 |
| Grower | 344.50A | 309.00Ba | 283.87Bb | 150.55C | 5.657 | <0.001 |
| Finisher (to day 35) | 258.48A | 221.22B | 192.51C | 119.35D | 4.053 | <0.001 |
| Finisher (to day 42) | 549.54A | 495.68B | 441.75C | 297.34D | 8.824 | <0.001 |
| Finisher (to day 49) | 878.95A | 791.47B | 728.37C | 558.64D | 10.219 | <0.001 |
Abbreviations: CPI – crude protein intake, HPW – high-protein wheat.
SEM = pooled standard error of the mean derived from ANOVA model (based on n = 7 replicate pens per treatment group).
Protein efficiency ratio values are presented in Table 9. During the starter phase, groups II and III exhibited the highest PER values (P < 0.05), while the lowest PER was recorded in group IV. Although group IV did not differ significantly from the control group, PER was 10.6% and 12.5% lower than in groups II and III, respectively. No significant differences among groups were observed during the grower and early finisher phases (up to day 35). However, during the final two weeks, birds from group II exhibited significantly higher PER value compared with those fed the control diet, whereas no differences were observed between the remaining groups (P < 0.05–0.01).
Table 9
Average PER (g g–1) of broiler chickens fed with different HPW contents
| Rearing period | Groups | SEM | P-value | |||
|---|---|---|---|---|---|---|
| I | II | III | IV | |||
| Starter | 3.66ab | 3.81a | 3.85a | 3.45b | 0.099 | 0.036 |
| Grower | 2.79 | 2.89 | 2.77 | 2.77 | 0.117 | 0.874 |
| Finisher (to day 35) | 3.22 | 3.37 | 3.35 | 3.38 | 0.183 | 0.920 |
| Finisher (to day 42) | 2.86b | 3.15ab | 3.02ab | 3.29a | 0.101 | 0.034 |
| Finisher (to day 49) | 2.49B | 2.96A | 2.61B | 2.61B | 0.044 | <0.001 |
Abbreviations: PER – protein efficiency ratio, HPW – high-protein wheat.
SEM = pooled standard error of the mean derived from ANOVA model (based on n = 7 replicate pens per treatment group).
3.2.2. Feed cost and EPEF
The economic analysis (Table 10) revealed that both the price of feed mixtures and the cumulative cost of feeding were significantly affected by the dietary inclusion of HPW. A consistent downward trend in feed prices per tonne was observed as the proportion of HPW increased across all feeding phases. Specifically, the total cost of feeding over the 49-day rearing period was reduced by 3.1%, 8.8%, and 33.7% in groups II, III, and IV, respectively, compared to the control group (P < 0.01).
Table 10
Price of the diet and the cost of feeding broiler chickens (EUR per tonne) fed with different HPW contents
| Item | Groups | SEM | P-value | |||
|---|---|---|---|---|---|---|
| I | II | III | IV | |||
| Price for a ton [EUR per ton] | ||||||
| Starter | 349.29 | 339.15 | 335.61 | 332.55 | ||
| Grower | 323.58 | 317.92 | 315.33 | 312.50 | ||
| Finisher | 302.59 | 295.28 | 292.92 | 291.04 | ||
| Cost of feeding (EUR per FI cumulatively in kg) | ||||||
| Starter | 0.17Aa | 0.17A | 0.16Ab | 0.10B | 0.003 | <0.001 |
| Grower | 0.50A | 0.49A | 0.46A | 0.25B | 0.010 | <0.001 |
| Finisher (to day 35) | 0.36A | 0.34AB | 0.30B | 0.21C | 0.011 | <0.001 |
| Finisher (to day 42) | 0.79A | 0.75AB | 0.69B | 0.50C | 0.017 | <0.001 |
| Finisher (to day 49) | 1.26A | 1.21ABa | 1.14Bb | 0.92C | 0.019 | <0.001 |
| Total cost of feeding (EUR per total FI cumulatively in kg) | ||||||
| To day 35 | 1.03A | 1.00AB | 0.92B | 0.56C | 0.022 | <0.001 |
| To day 42 | 1.46A | 1.41AB | 1.31B | 0.85C | 0.027 | <0.001 |
| To day 49 | 1.93A | 1.87A | 1.76B | 1.28C | 0.029 | <0.001 |
Abbreviations: HPW – high-protein wheat.
SEM = pooled standard error of the mean derived from ANOVA model (based on n = 7 replicate pens per treatment group).
The EPEF values are presented in Table 11. During the early finisher phase (up to day 35), the control group showed significantly higher EPEF values (P < 0.01) than groups II and III, and all three groups significantly outperformed group IV. By days 42 and 49, groups I and II maintained significantly higher EPEF values than groups III and IV (P < 0.01), indicating that moderate HPW inclusion does not adversely affect overall production efficiency.
Table 11
Average EPEF of broiler chickens fed with different HPW contents during the last feeding phase
| Rearing period | Groups | SEM | P-value | |||
|---|---|---|---|---|---|---|
| I | II | III | IV | |||
| Finisher (to day 35) | 454.48A | 387.22B | 337.96C | 189.55D | 7.803 | <0.001 |
| Finisher (to day 42) | 463.37A | 435.49A | 355.88B | 227.68C | 8.174 | <0.001 |
| Finisher (to day 49) | 443.13A | 440.34A | 336.18B | 214.49C | 7.913 | <0.001 |
3.3. Blood parameters
The effects of dietary HPW inclusion on selected haematological and biochemical blood parameters are presented in Tables 12–15.
Table 12
Hematological parameters in the serum of broiler chickens fed with different HPW contents
| Day | Normal range* | Groups | SEM | P-value | |||
|---|---|---|---|---|---|---|---|
| I | II | III | IV | ||||
| RBC, 106 µL–1 | |||||||
| 14th | 1.4–2.4 | 1.98 | 2.20 | 2.24 | 1.88 | 0.148 | 0.2685 |
| 21st | 2.1–3.2 | 2.47 | 2.42 | 2.30 | 2.17 | 0.153 | 0.5118 |
| 35th | 1.6–3.2 | 2.33 | 2.22 | 2.32 | 2.32 | 0.146 | 0.9314 |
| 42nd | 2.1–2.7 | 2.41 | 2.74 | 2.61 | 2.36 | 0.129 | 0.1503 |
| 49th | 2.2–2.9 | 2.52 | 2.56 | 2.36 | 2.49 | 0.124 | 0.7077 |
| WBC, 103 µL–1 | |||||||
| 14th | 26–47 | 33.87 | 32.48 | 28.39 | 38.00 | 4.990 | 0.6014 |
| 21st | 42–68 | 54.67 | 41.68 | 46.89 | 37.37 | 4.791 | 0.0914 |
| 35th | 19–39 | 27.68 | 34.48 | 28.64 | 29.52 | 2.307 | 0.1896 |
| 42nd | 24–66 | 38.77 | 43.30 | 45.52 | 43.17 | 4.749 | 0.8529 |
| 49th | 34–66 | 45.65 | 44.48 | 42.03 | 55.46 | 1.294 | 0.1165 |
Abbreviations: RBC – red blood cells, WBC – white blood cells.
SEM = pooled standard error of the mean derived from ANOVA model (based on n = 7 replicate pens per treatment group).
Table 13
Serum enzyme profile in broiler chickens fed with different HPW contents
| Day | Normal range* | Groups | SEM | P-value | |||
|---|---|---|---|---|---|---|---|
| I | II | III | IV | ||||
| ALT, U L–1 | |||||||
| 14th | 7.2–14.8 | 10.09 | 10.06 | 8.83 | 11.59 | 1.076 | 0.368 |
| 21st | 6.0 –9.8 | 8.09 | 8.64 | 8.84 | 8.39 | 0.796 | 0.916 |
| 35th | 8.1–11.9 | 9.67 | 11.03 | 12.10 | 10.34 | 1.256 | 0.572 |
| 42nd | 4.6–8.1 | 5.86 | 9.00 | 9.54 | 8.17 | 0.999 | 0.072 |
| 49th | 5.2–9.7 | 7.26 | 7.87 | 9.14 | 8.16 | 1.089 | 0.672 |
| AST, U L–1 | |||||||
| 14th | 177–214 | 199.31 | 207.66 | 191.06 | 186.94 | 7.559 | 0.246 |
| 21st | 165–240 | 197.81 | 189.47 | 170.36 | 174.94 | 7.561 | 0.060 |
| 35th | 250–586 | 376.37B | 470.64A | 342.49B | 186.33C | 50.181 | 0.005 |
| 42nd | 224–537 | 348.44B | 490.84A | 385.97B | 224.04C | 37.745 | 0.001 |
| 49th | 408–838 | 625.39 | 492.04 | 567.89 | 393.96 | 74.611 | 0.174 |
| ALP, U L–1 | |||||||
| 14th | 1000–4236 | 2712.57 | 2351.42 | 1950.85 | 1752.28 | 35.179 | 0.246 |
| 21st | 385–2796 | 1088.28 | 1878.85 | 1216.00 | 1248.57 | 33.189 | 0.353 |
| 35th | 302–597 | 417.71 | 265.14 | 363.42 | 396.57 | 7.619 | 0.512 |
| 42nd | 212–559 | 351.42 | 471.42 | 283.42 | 452.57 | 8.762 | 0.403 |
| 49th | 150–223 | 186.85A | 149.71A | 178.28A | 257.71B | 1.802 | 0.002 |
Abbreviations: ALT – alanine aminotransferase, AST – aspartate aminotransferase, ALP – alkaline phosphatase, HPW – high-protein wheat.
SEM = pooled standard error of the mean derived from ANOVA model (based on n = 7 replicate pens per treatment group).
Table 14
Protein and lipid metabolism in the serum of broiler chickens fed with different HPW contents
| Day | Normal range* | Groups | SEM | P-value | |||
|---|---|---|---|---|---|---|---|
| I | II | III | IV | ||||
| TP, g dL–1 | |||||||
| 14th | 2.1–3.2 | 2.59ab | 2.81ab | 2.87a | 2.11b | 0.188 | 0.035 |
| 21st | 2.1–3.1 | 2.73 | 2.67 | 2.63 | 2.33 | 0.110 | 0.073 |
| 35th | 2.2–3.3 | 2.84 | 3.01 | 2.76 | 2.71 | 0.219 | 0.078 |
| 42nd | 2.4–3.4 | 2.79 | 3.07 | 3.19 | 2.61 | 0.159 | 0.068 |
| 49th | 2.9–3.7 | 3.12 | 3.34 | 3.10 | 3.17 | 0.131 | 0.617 |
| Alb, g dL–1 | |||||||
| 14th | 1.2–1.6 | 1.37 A | 1.44 A | 1.37 A | 1.05B | 0.044 | <0.001 |
| 21st | 1.2–1.5 | 1.4a | 1.38ab | 1.38ab | 1.21b | 0.046 | 0.027 |
| 35th | 1.4–1.7 | 1.58 | 1.54 | 1.62 | 1.56 | 0.318 | 0.834 |
| 42nd | 1.6–2.2 | 1.81a | 1.82a | 1.82a | 1.57b | 0.328 | 0.034 |
| 49th | 1.4–2.0 | 1.64 | 1.78 | 1.61 | 1.66 | 0.086 | 0.516 |
| TCh, mg dL–1 | |||||||
| 14th | 95–149 | 121.16 | 140.73 | 124.43 | 124.70 | 8.217 | 0.350 |
| 21st | 104–124 | 115.59 | 119.23 | 121.46 | 120.02 | 5.283 | 0.875 |
| 35th | 122–175 | 143.80 | 120.39 | 131.16 | 126.24 | 7.330 | 0.166 |
| 42nd | 102–148 | 124.81 A | 90.37B | 86.11B | 87.91B | 5.710 | <0.001 |
| 49th | 64–102 | 85.63 | 84.69 | 77.80 | 90.60 | 3.941 | 0.176 |
Abbreviations: TP – total protein, Alb – albumin, TCh – total cholesterol concentration, HPW – high-protein wheat.
Pooled SEM = pooled standard error of the mean derived from ANOVA model (based on n = 7 replicate pens per treatment group).
Table 15
Renal function and mineral status in the serum of broiler chickens fed with different HPW contents
| Day | Normal range* | Groups | SEM | P-value | |||
|---|---|---|---|---|---|---|---|
| I | II | III | IV | ||||
| Cr, mg dL–1 | |||||||
| 14th | 0.3–0.3 | 0.301 | 0.300 | 0.300 | 0.300 | 0.001 | 0.998 |
| 21st | 0.3–0.4 | 0.314 | 0.343 | 0.286 | 0.271 | 0.020 | 0.087 |
| 35th | 0.2–0.3 | 0.286b | 0.329ab | 0.371a | 0.314ab | 0.020 | 0.039 |
| 42nd | 0.3–0.4 | 0.314 | 0.300 | 0.300 | 0.300 | 0.007 | 0.410 |
| 49th | 0.3–0.4 | 0.314 | 0.314 | 0.314 | 0.314 | 0.014 | 0.998 |
| P, mg dL–1 | |||||||
| 14th | 6.0–37.0 | 15.476 | 11.011 | 12.536 | 12.304 | 3.268 | 0.802 |
| 21st | 6.3–18.0 | 8.511 | 8.511 | 9.126 | 8.725 | 0.772 | 0.934 |
| 35th | 7.4–12.7 | 9.246 | 9.246 | 10.690 | 11.927 | 1.337 | 0.438 |
| 42nd | 7.1–10.6 | 9.169 | 9.169 | 8.184 | 5.496 | 1.194 | 0.125 |
| 49th | 6.6–11.6 | 8.310 | 8.310 | 7.519 | 8.006 | 0.622 | 0.782 |
Abbreviations: Cr – creatinine, P – phosphorus, HPW – high-protein wheat.
SEM = pooled standard error of the mean derived from ANOVA model (based on n = 7 replicate pens per treatment group).
3.3.1. Haematological parameters
Dietary HPW inclusion did not significantly affect RBC. In contrast, WBC varied both among groups within the same age interval and across successive sampling points. Compared to the control group, similar trends were observed on days 14 and 49, characterized by a decrease in WBC in groups II and III and an increase in group IV. An opposite trend was noted on days 21 and 35. On day 42, an increase in WBC was observed across all groups. Although these fluctuations were noticeable, the values only slightly exceeded the established normal limits. On day 21, WBC counts in groups II and IV were below the lower limit of the normal range (with a maximum deviation of approximately 11% in group IV). On day 35, values exceeded the upper limit in group II (approximately 5%), and a similar trend was observed in group IV on day 49.
3.3.2. Biochemical parameters
Biochemical parameters exhibited more pronounced fluctuations in response to feed composition and bird age (Table 9). On day 42, all experimental groups showed higher ALT activity compared to the control group (P = 0.072), with group III reaching the highest level (approximately 17.8% above the upper normal limit). Slightly elevated ALT was also observed in group III on days 35 and 49.
From day 35, the activity of AST differed significantly from the control group. On days 35 and 42, AST was higher (P < 0.01) in group II, while it was markedly lower in group IV (by 25.5% below the lower limit of the normal range) on day 35. By day 49, AST was reduced in all experimental groups, with the lowest activity recorded in group IV (3.4% reduction below the lower limit of the normal range), but the statistical significance of the difference was not confirmed.
The activity of ALP alternately decreased and increased relative to the control group across all groups. Reductions below the lower reference limit were recorded in group II on day 35 (by 12.2%) and 49. Conversely, ALP exceeded the upper normal level in group IV on day 49 (by 16.9%). Significant differences between group IV and three others were stated on day 49 (P < 0.01).
Fluctuations in plasma protein concentrations (TP as well as Alb) and Cr observed in the experimental chickens were minor. Although statistical analysis revealed significant differences in Alb concentrations between groups, the variations were minimal. The slight decreases below the lower normal limit were observed in group IV on day 14 (by 12.5%) and 42 (by 1.9%). Cr exceeded the upper normal level in all groups on day 35 (maximum by 23.7% in group III). The observed differences were minor, but they were statistically significant (P < 0.05). Small decreases below the normal level were noted on day 21 in groups III and IV, by 4.7% and 9.7%, respectively.
Dietary HPW content did not significantly affect TCh or P concentrations. Although statistically significant (P < 0.01) small decreases of TCh, relative to both group I and the lower limit of the normal range were observed in all experimental groups (groups II, III, and IV) on day 42, with the greatest decrease (by approximately 15.6%) noted in group III. TCh lowered below the normal level (approximately 1.3%) was also in group II on day 35. Lowered P was observed in all groups on day 14 and in group IV (by approximately 23% below normal level) on day 42.
4. Discussion
Previous studies have demonstrated that the complete replacement of genetically modified SBM in monogastric animal diets remains challenging (Soisontes et al., 2024). One of the main limitations of alternative protein sources is the presence of anti-nutritional factors, which may impair nutrient utilization and animal performance. Nevertheless, these constraints can be partially or fully mitigated through appropriate processing methods or by optimizing the inclusion levels of such feed ingredients (Marchal et al., 2024). Another strategy to reduce SBM use involves lowering dietary CP levels by approximately 2–3 percentage points relative to standard nutritional recommendations. This approach is feasible through supplementation with crystalline AAs, which enhances the BV of dietary protein and supports efficient protein synthesis in broilers (Maynard et al., 2022).
4.1. Production performance
The progressive reduction in bird numbers per pen during the experiment may have influenced FI and contributed to increased variability in performance parameters, particularly during the final phase. Previous studies have shown that a reduction in stocking density below certain thresholds can affect FI and growth performance. Moreover, it has been reported that low stocking density can increase the coefficient of variation in BW (Feddes et al., 2002). While this reduction was a necessary consequence of the longitudinal sampling design, it should be considered when interpreting the finisher phase data.
In the present study, high inclusion levels of HPW, particularly above 77%, were associated with reduced BW. The pronounced reduction in BW observed in group IV (–42% vs. group I at day 49) appears to be driven primarily by markedly reduced FI, which directly limited the energy and amino acid supply necessary for growth. This is supported by the substantially lower FI recorded in this group, suggesting that reduced nutrient intake, rather than the diet composition per se, was the primary constraint on performance. A strong relationship between FI and growth rate in broilers has been consistently demonstrated in previous studies (Selle et al., 2023). In addition, several secondary mechanisms may have contributed to this growth depression. High inclusion levels of wheat are associated with increased NSP content, which may elevate digesta viscosity and impair nutrient digestibility (Selle et al., 2023). Although xylanase was included in the present study, its efficacy depends on the enzyme dose, substrate characteristics, and gut conditions. Consequently, it may not have been sufficient to fully counteract NSP-related effects at such extreme wheat inclusion levels (84%). Therefore, the growth failure in group IV is best characterized as a multi-factorial response, in which reduced FI acted as the primary driver, while NSP-related effects on digestibility likely contributed additively. This interpretation aligns with previous reports, indicating that excessive wheat inclusion, particularly under reduced CP conditions, can impair performance through the combined effects of diminished intake, impaired digestibility, and reduced metabolic efficiency (Choct et al., 2004; Selle et al., 2023). Comparable results were reported by Steenfeldt (2001), who observed decreased BW in broilers fed diets containing 81.5% wheat derived from 16 cultivars (112–127 g·kg–1 CP), compared with diets containing 65% wheat. Choct et al. (2004) reported improvements in daily BWG, FCR, and excreta moisture content in broilers fed xylanase-supplemented wheat-based diets under low-energy conditions, suggesting that enzyme supplementation may partially alleviate the negative effects of high wheat inclusion. Furthermore, it has also been suggested that higher xylanase inclusion rates, the incorporation of 1–3% insoluble fibre, or the use of coarser wheat particle size may further mitigate the adverse effects of arabinoxylans on gut function (Hikawczuk et al., 2023; Naeem et al., 2024).
The absence of significant differences in BW between group I (control) and group II during both the starter (71.1% HPW) and grower (77.8% HPW) phases, combined with the relatively high CP content of the HPW used (163 g·kg–1), indicates that partial replacement of SBM with HPW is feasible during early rearing. The lack of significant differences in FCR among groups during the first week of life is likely attributable to residual yolk sac reserves providing a buffer for nutritional requirements.
Biesek et al. (2022) demonstrated that partial substitution of ground wheat with whole wheat grain (10% of the diet) improved BW and FI without affecting FCR. Similarly, Yin et al. (2020) observed no significant differences in BW and FI between broilers fed high CP (215 g·kg–1) and low-CP (165 g·kg–1) wheat-based diets, although FCR was slightly higher in the low-CP group (1.58 vs. 1.49 kg·kg–1). Interestingly, mortality was numerically lower in birds fed whole wheat, without detrimental effects on performance.
Reducing CP levels in wheat-based broiler diets remains a significant challenge, as it is frequently associated with impaired growth performance, characterized by reduced BWG and increased FCR (Selle et al., 2023). In the present study, feed efficiency during later rearing phases was most favourable in groups I and II, whereas higher HPW inclusion levels (groups III and IV) were associated with increased FI per kilogram of BWG. Similar findings were reported by Wang et al. (2024), who observed increased FI and FCR when wheat inclusion reached 55.77% during the grower phase and 62.38% during the finisher phase, despite enzyme supplementation. Chrystal et al. (2021) reported that reducing dietary CP to 193 g·kg–1 in wheat-based diets (63.7% wheat inclusion) between days 7–35 resulted in only a 0.42% reduction in daily BWG and a 3.9% increase in FCR compared with maize-based diets. Likewise, Greenhalgh et al. (2022) reported a 3.39% reduction in BWG and a 3.47% increase in FCR when dietary CP was reduced to 180 g·kg–1 in wheat-based diets during days 21–35.
4.2. Rearing efficiency indicators
4.2.1. Protein indicators
The reduction in CPI observed during the first 2 weeks of rearing in the present study may indicate limited protein availability for optimal protein synthesis and growth at higher HPW inclusion levels. Cheng et al. (2023), comparing alternative protein sources with SBM, reported increased CPI in non-SBM formulations but found no significant differences in the PER when diets were balanced with crystalline amino acids to match SBM profiles. These findings emphasize the importance of precise amino acid balancing when SBM is partially or fully replaced to ensure that the lower CP levels do not become the limiting factor for muscle development.
4.2.2. Feeding cost and EPEF
The EPEF values calculated in the present study confirmed the absence of significant differences between groups I and II throughout the rearing period. Minor deviations were observed only during the first week of the finisher phase (up to day 35), which were not maintained in later stages (days 42 and 49). In contrast, significantly lower EPEF values were recorded in groups III and IV, reflecting the poor growth performance and feed efficiency noted earlier.
Kiczorowska et al. (2015) reported EPEF values ranging from 233 in broilers fed diets containing more than 47% irradiated pea seeds to 337 in the control group, with a profitability threshold in Poland defined at EPEF = 259. In the present study, all EPEF values in group IV fell below this profitability threshold, rendering high HPW inclusion economically unviable. The highest profitability was observed on day 42 in group I and on day 49 in group II. Similarly, Biesek et al. (2022) reported improved EPEF values in 42-day-old broilers fed wheat-based diets containing 10% whole wheat, suggesting that the physical form and inclusion level of wheat are critical determinants of economic outcome.
4.2.3. Blood parameters
The analysis of haematological and biochemical parameters confirmed that the inclusion of HPW, despite the intentional reduction in CP levels, maintained homeostatic balance and did not adversely affect the metabolic health of the broilers. These results suggest that HPW-based diets were physiologically well tolerated during the rapid growth phase, with key blood markers remaining within established normal ranges.
Alterations in WBC, involved in immunological defence and regulatory pathways, only marginally exceed established age-specific reference intervals. In the absence of concomitant changes in RBC, it may be reasonably concluded that the dietary modification exerted only a limited effect on circulating blood cell populations. The observed systemic response was therefore most likely adaptive rather than indicative of relevant stress or inflammatory activations and suggests the absence of additional exposure to deleterious environmental or management-related factors.
Plasma TP and Alb concentrations reflect digestive efficiency, amino acid absorption, and subsequent utilization to meet the high energetic demands of growth (Macelline et al., 2021). These levels also depend on hepatic synthetic capacity and the incorporation of amino acids into muscle tissue (Rajman et al., 2006). HPW supplementation did not significantly alter TP or Alb concentration, aligning with reports by Lee et al. (2010), El-Katcha et al. (2014), and Seyedoshohadaei et al. (2024). These results indicate that the modified diet did not substantially impair overall protein metabolism and protein synthesis in the liver. However, due to the lack of data regarding gastrointestinal morphology and digestive enzyme activity, it is difficult to reliably assess digestive efficiency as well as amino acid and protein absorption.
Fluctuations in the activities of ALT and AST suggest that HPW may influence the liver status (El-Katcha et al., 2014); however, the stability of TP and Alb indicates that hepatic protein synthetic capacity remained preserved. Additionally, these enzymatic patterns may be age dependent. While some studies show no age correlation for ALT, AST typically increases with age (Rajman et al., 2006; Senanayake et al., 2015). The activity of alkaline phosphatase showed slight variability and reflects presumably the natural age-related decline observed in poultry (Rajman et al., 2006).
Creatinine is a limited diagnostic marker in birds because they primarily excrete uric acid as the end-product of nitrogen metabolism. Increase in Cr is interpreted as an indicator of muscle damage or renal dysfunction (Macelline et al., 2021; Rajman et al., 2006). In this study, Cr concentrations, although statistically different, were relatively slight, suggesting the absence of adverse effects on muscles and renal function, maintenance of systemic protein and amino acid metabolism, and adequacy of the dietary amino acid profile (Seyedoshohadaei et al., 2024). The concurrent decrease in AST further suggests a lack of muscle membrane disruption, as elevated AST is often linked to muscle injury (Rajman et al., 2006).
Serum P concentrations remained stable throughout the experiment, suggesting that wheat-derived P effectively met nutritional requirements without increasing environmental load. A transient decrease in P at 14 days may be attributed to temporary shifts in intestinal absorption during early development. Regarding lipid metabolism, HPW supplementation did not exert a sustained effect on TCh. A minor, transient decrease in TCh below reference limits at 42 days normalized quickly, indicating a marginal impact on systemic lipid metabolism (Zarghi & Golian, 2009; Seyedoshohadaei et al., 2024). The lack of significant changes in TCh and TP further supports the conclusion that HPW did not induce a systemic stress response, which typically elevates these markers (Rajman et al., 2006).
5. Conclusion
This study demonstrates that HPW can effectively replace SBM protein when included at moderate levels (approximately 71–77% of the diet, as in group II) and supplemented with appropriate exogenous enzymes. Under these conditions, growth performance and EPEF values remained comparable to those of the control group. In contrast, higher HPW inclusion levels (groups III and IV) resulted in significantly impaired growth and a substantial reduction in production efficiency.
Although feed costs decreased progressively with increasing HPW inclusion, only group II dietary protocol achieved a meaningful reduction in total feeding costs (approximately 2.8–3.1%) while maintaining production standards. These findings indicate that moderate HPW inclusion represents a viable and economically sound strategy for partial SBM replacement in broiler diets.
Further research is warranted to define the safe upper limits of HPW inclusion across different feeding phases and to assess the potential benefits of partially replacing ground wheat with whole grain, particularly during the grower and finisher periods. Importantly, reducing reliance on imported protein sources through the use of locally produced HPW may potentially contribute to improved environmental sustainability by lowering the estimated carbon footprint of poultry feed formulations, primarily by reducing transport-related emissions.
Acknowledgments
The authors are indebted to Saatbau Poland Sp. z o.o. for kindly providing the HPW grains used in this study. The authors are also indebted to Neorol Sp z o.o. for preparing feed mixtures used in the presented study.
Funding information
This research was supported by the Wroclaw University of Environmental and Life Sciences (Poland) as part of the Ph.D. research program “MISTRZ”, No N090/0011/22. The APC is co-financed by Wrocław University of Environmental and Life Sciences and Saatbau Poland Sp. z o.o.
Author contributions
Conceptualization, A.S.-T., A.P.-K., and A.Rz.; data curation, A.S.-T., A.P.-K., T.H., and A.Rz.; formal analysis, A.S.-T., A.P.-K., T.H., and A.Rz.; funding acquisition, A.S.-T.; investigation, A.S.-T., A.P.-K., A.L., A.J.-R., and A.Rz.; methodology, A.S.-T., A.P.-K., and A.Rz.; project administration, A.S.-T.; software, A.S.-T., A.P.-K., T.H., and A.Rz.; supervision, A.S.-T. and A.Rz.; validation, Z.K. and B.F.; visualization, T.H.; writing – original draft, A.S.-T., A.P.-K., and A.Rz.; writing – review and editing, A.S.-T., A.P.-K., T.H., A.L., A.J.-R., Z.K., B.F., and A.Rz.
Conflict of interest statement
The authors declared no conflicts of interest.