
Table 1
Influence of fish stocking density on key water quality indicators in the culture system
| Water quality parameters | Stocking density (fish m–3) | |||
|---|---|---|---|---|
| 75 | 150 | 250 | 300 | |
| Dissolved oxygen (mg L–1) | 7.19 ± 0.03 a | 6.96 ± 0.09 b | 6.57 ± 0.05 c | 6.20 ± 0.10 d |
| pH | 7.63 ± 0.19 | 7.83 ± 0.13 | 7.90 ± 0.15 | 7.55 ± 0.17 |
| Total alkalinity (as CaCO₃, mg L–1) | 141 ± 1.51 a | 137 ± 3.50 a | 136 ± 0.76 ab | 132 ± 1.51 b |
| TAN (mg L–1) | 0.77 ± 0.02 c | 1.09 ± 0.01 b | 1.22 ± 0.07 b | 1.40 ± 0.09 a |
| Unionized ammonia (NH3–N, mg L–1) | 0.03 ± 0.01 c | 0.04 ± 0.01 bc | 0.06 ± 0.02 ab | 0.06 ± 0.01 a |
| Nitrite nitrogen (NO2⁻–N, mg L–1) | 0.07 ± 0.02 c | 0.08 ± 0.01 bc | 0.10 ± 0.01 ab | 0.12 ± 0.01 a |
| Nitrate nitrogen (NO3⁻–N, mg L–1) | 0.29 ± 0.02 a | 0.28 ± 0.02 ab | 0.26 ± 0.01 b | 0.12 ± 0.01 c |
| TDS (g L–1) | 15.80 ± 0.93 c | 30.20 ± 2.35 b | 46.20 ± 1.21 a | 48.90 ± 1.87 a |
| TSS (mg L–1) | 425 ± 14.63 ab | 412 ± 17.01 b | 414 ± 20.27 ab | 455 ± 8.85 a |
| BFV (mL L–1) | 30.10 ± 0.78 d | 33.30 ± 0.93 c | 36.50 ± 0.93 b | 39.20 ± 1.21 a |
Values are presented as mean value ± SD. Different letters within the same row indicate significant differences among stocking densities (P < 0.05, n = 3 pooled samples).
Table 2
Proximate composition of biofloc under different fish stocking densities in the BFT system
| BFT analysis | Stocking density (fish m–3) | |||
|---|---|---|---|---|
| 75 | 150 | 250 | 300 | |
| Moisture content (%) | 76.10 ± 0.07 a | 75.80 ± 0.09 a | 75.00 ± 0.14 b | 74.80 ± 0.05 c |
| Dry matter (%) | 23.90 ± 0.07 d | 24.20 ± 0.09 c | 24.90 ± 0.03 b | 25.20 ± 0.05 a |
| Crude protein (%) | 25.30 ± 0.19 d | 26.30 ± 0.29 c | 28.40 ± 0.14 b | 30.20 ± 0.28 a |
| Crude lipid (%) | 4.75 ± 0.16 c | 5.09 ± 0.09 bc | 5.38 ± 0.17 b | 5.79 ± 0.12 a |
| Ash content (%) | 23.80 ± 0.10 a | 22.80 ± 0.16 b | 21.40 ± 0.10 c | 19.50 ± 0.10 d |
Values are presented as mean value ± SD. Different letters within the same row indicate significant differences among stocking densities (P < 0.05, n = 3 pooled samples).
Table 3
Growth performance and yield of fish reared at different stocking densities
| Growth parameters | Stocking density (fish m–3) | |||
|---|---|---|---|---|
| 75 | 150 | 250 | 300 | |
| AFW (g fish–1) | 254 ± 2.63 a | 252 ± 5.35 a | 251 ± 3.29 a | 226 ± 3.12 b |
| Weight gain (g fish–1) | 244 ± 1.99 a | 241 ± 4.68 a | 240 ± 3.64 a | 215 ± 3.81 b |
| SGR (% day–1) | 1.77 ± 0.10 | 1.73 ± 0.09 | 1.74 ± 0.03 | 1.68 ± 0.07 |
| Survival rate (%) | 94 ± 0.57 a | 93 ± 1.16 ab | 91.8 ± 0.38 bc | 90.4 ± 0.19 c |
| Total yield (TY, kg m–3) | 17.94 ± 0.17 d | 35.18 ± 0.80 c | 56.8 ± 0.48 b | 61.35 ± 0.48 a |
Values are presented as mean value ± SD. Different letters within the same row indicate significant differences among stocking densities (P < 0.05, n = 3 pooled samples).
Table 4
Feed utilization, somatic indices, and condition factor of fish reared at different stocking densities
| Parameters | Stocking density (fish m–3) | |||
|---|---|---|---|---|
| 75 | 150 | 250 | 300 | |
| FI (g fish–1) | 285 ± 6.16 b | 306 ± 3.52 b | 370 ± 6.18 a | 358 ± 18.71 a |
| FCR | 1.17 ± 0.02 d | 1.27 ± 0.02 c | 1.54 ± 0.02 b | 1.69 ± 0.05 a |
| PER | 3.45 ± 0.09 a | 3.11 ± 0.02 b | 2.57 ± 0.02 c | 2.39 ± 0.09 d |
| HSI (%) | 1.97 ± 0.02 b | 2.03 ± 0.04 b | 2.29 ± 0.05 a | 2.21 ± 0.02 a |
| VSI (%) | 6.98 ± 0.26 b | 7.16 ± 0.02 ab | 7.37 ± 0.04 a | 7.21 ± 0.07 ab |
| Condition factor | 3.12 ± 0.04 a | 2.92 ± 0.07 b | 2.58 ± 0.04 c | 2.34 ± 0.09 d |
Values are presented as mean value ± SD. Different letters within the same row indicate significant differences among stocking densities (P < 0.05, n = 3 pooled samples).
Table 5
Whole-body proximate composition of fish reared at different stocking densities
| Body composition | Stocking density (fish m–3) | |||
|---|---|---|---|---|
| 75 | 150 | 250 | 300 | |
| Moisture content (%) | 71.50 ± 0.31 c | 71.70 ± 0.17 bc | 73.30 ± 1.21 ab | 74.50 ± 0.14 a |
| Dry matter (%) | 28.50 ± 0.31 a | 28.30 ± 0.17 ab | 26.70 ± 1.21 bc | 25.50 ± 0.14 c |
| Crude protein (%) | 26.80 ± 0.29 a | 26.50 ± 0.07 a | 26.40 ± 0.17 a | 25.80 ± 0.14 b |
| Crude lipid (%) | 2.64 ± 0.04 b | 2.61 ± 0.04 b | 2.73 ± 0.04 ab | 3.03 ± 0.24 a |
| Ash content (%) | 25.70 ± 0.05 a | 25.40 ± 0.19 ab | 24.70 ± 0.52 bc | 24.40 ± 0.19 c |
Values are presented as mean value ± SD. Different letters within the same row indicate significant differences among stocking densities (P < 0.05, n = 3 pooled samples).
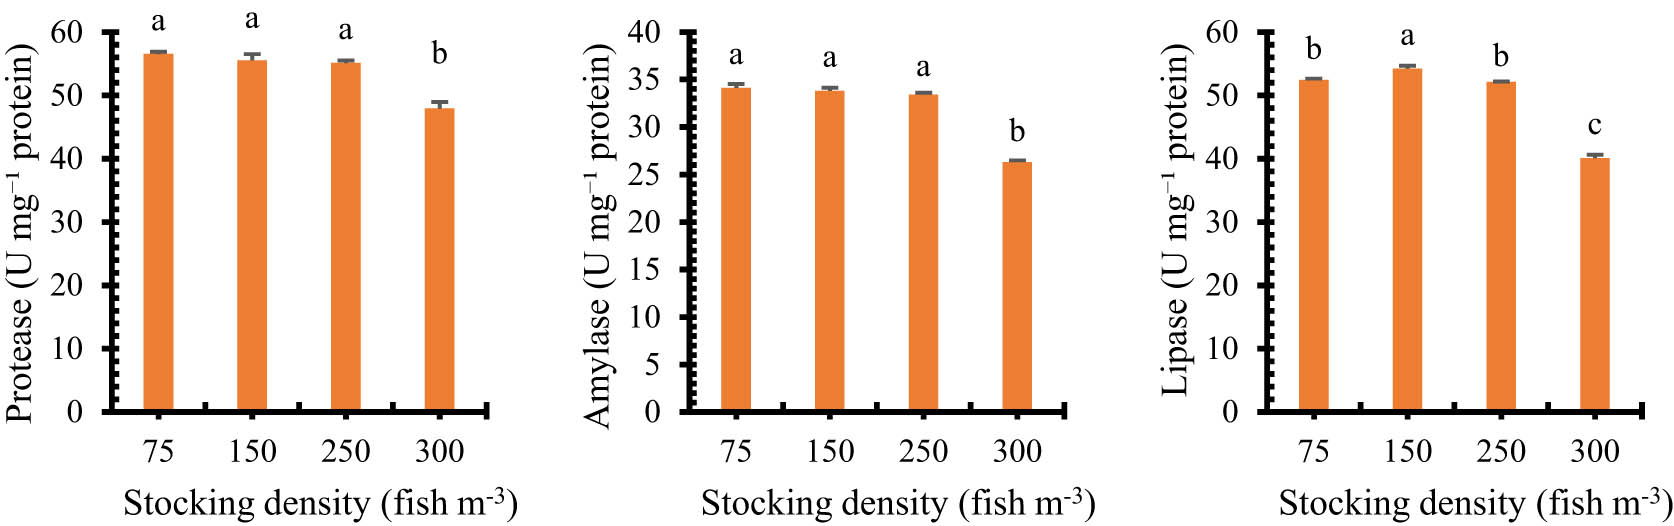
Figure 1
Digestive enzyme activities of red tilapia reared under different stocking densities in a biofloc system.
Table 6
Hematological responses of fish reared at different stocking densities
| Parameters | Stocking density (fish m–3) | |||
|---|---|---|---|---|
| 75 | 150 | 250 | 300 | |
| RBC count (×10⁶ µL–1) | 2.87 ± 0.17 a | 2.19 ± 0.12 b | 1.66 ± 0.09 c | 1.54 ± 0.02 c |
| Hb concentration (g dL–1) | 6.38 ± 0.16 a | 6.51 ± 0.24 a | 5.98 ± 0.14 a | 3.87 ± 0.26 b |
| HCT (%) | 19.70 ± 2.34 a | 18.30 ± 0.83 a | 17.00 ± 0.71 a | 12.10 ± 0.29 b |
| WBC count (×10³ µL–1) | 21.90 ± 0.50 a | 21.10 ± 0.42 a | 21.00 ± 0.59 a | 17.2 ± 1.23 b |
| Lymphocytes (%) | 58.20 ± 6.62 a | 56.70 ± 6.24 a | 51.10 ± 7.00 ab | 37.90 ± 4.17 b |
| Monocytes (%) | 2.27 ± 0.09 a | 2.18 ± 0.05 a | 1.95 ± 0.05 b | 1.31 ± 0.05 c |
| Neutrophils (%) | 17.10 ± 0.57 a | 16.6 0 ± 0.40 ab | 15.80 ± 0.40 b | 13.2 ± 0.45 c |
Values are presented as mean value ± SD. Different letters within the same row indicate significant differences among stocking densities (P < 0.05, n = 3 pooled samples).
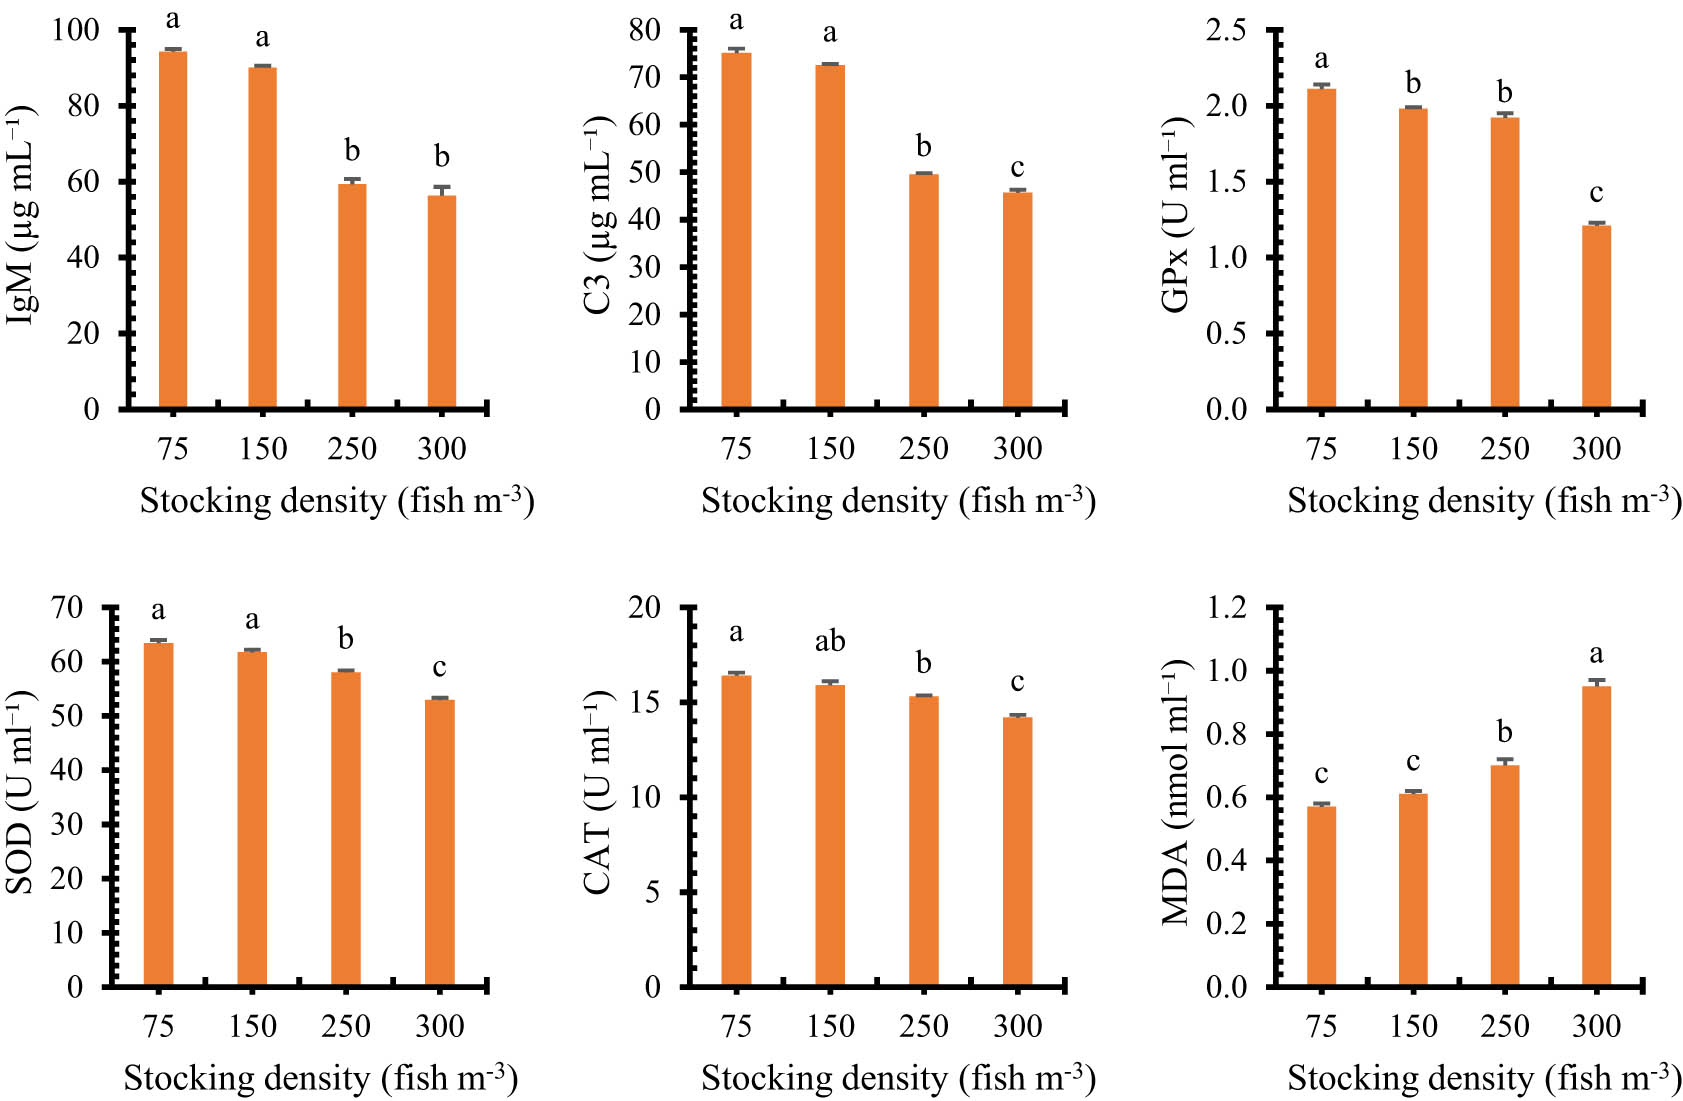
Figure 2
Serum immune and antioxidant responses of red tilapia reared at different stocking densities in a biofloc system.
Table 7
Serum biochemical, hormonal, and stress indicators of fish reared at different stocking densities
| Parameters | Stocking density (fish m–3) | |||
|---|---|---|---|---|
| 75 | 150 | 250 | 300 | |
| Total protein (g dL–1) | 3.76 ± 0.04 a | 3.73 ± 0.04 ab | 3.65 ± 0.05 b | 3.19 ± 0.01 c |
| Albumin (g dL–1) | 0.47 ± 0.05 b | 0.49 ± 0.05 b | 0.53 ± 0.07 b | 0.67 ± 0.02 a |
| Globulin (g dL–1) | 3.29 ± 0.02 a | 3.24 ± 0.02 b | 3.12 ± 0.02 c | 2.52 ± 0.02 d |
| A/G ratio | 0.14 ± 0.02 b | 0.15 ± 0.02 b | 0.17 ± 0.02 b | 0.27 ± 0.01 a |
| AST (IU L–1) | 56.70 ± 1.04 c | 58.20 ± 0.48 bc | 59.90 ± 0.21 b | 74.10 ± 0.80 a |
| ALT (IU L–1) | 30.30 ± 0.88 b | 31.2 ± 0.94 b | 32.1 ± 0.62 b | 45.00 ± 0.74 a |
| Urea (mg dL–1) | 37.80 ± 0.40 c | 38.70 ± 0.76 c | 40.30 ± 0.31 b | 41.80 ± 0.52 a |
| Uric acid (mg dL–1) | 2.37 ± 0.02 c | 2.51 ± 0.07 c | 2.76 ± 0.02 b | 3.01 ± 0.09 a |
| GH (ng mL–1) | 2.86 ± 0.05 a | 2.58 ± 0.16 b | 2.25 ± 0.04 c | 2.08 ± 0.04 c |
| Lysozyme activity (µg mL–1) | 1.04 ± 0.04 a | 0.85 ± 0.04 b | 0.78 ± 0.04 b | 0.65 ± 0.02 c |
| Cortisol (pg mL–1) | 196 ± 1.40 b | 204 ± 1.16 b | 216 ± 16.43 b | 248 ± 2.01 a |
Values are presented as mean value ± SD. Different letters within the same row indicate significant differences among stocking densities (P < 0.05, n = 3 pooled samples).