
1. Introduction
Global aquaculture is expanding rapidly into arid and semi-arid regions where conventional freshwater supplies are critically limited and increasingly contested by competing agricultural, industrial, and domestic demands (Nabi et al., 2025; Shehata et al., 2026b). In these water-scarce landscapes, vast reserves of brackish and hypersaline groundwater, long regarded as agronomically unusable, are being reappraised as a strategic resource for food production (Musie & Gonfa, 2023; Agbasi et al., 2025). Harnessing this resource requires species capable of tolerating elevated ionic and osmotic loads under intensive rearing conditions and species. Red tilapia (Oreochromis spp.) has emerged as a leading candidate for such systems owing to its comparatively high salinity tolerance, rapid growth, and strong commercial demand, making it well-suited for intensive desert-based aquaculture operations that depend entirely on saline groundwater (Sallam et al., 2024, 2025a, 2025b). However, productive and sustainable use of hypersaline groundwater in aquaculture demands not only a tolerant species but also a culture technology capable of maintaining water quality stability without continuous exchange, a requirement that biofloc technology (BFT) is uniquely positioned to fulfil (Khanjani et al., 2024a; Liu et al., 2025).
BFT, a system in which high carbon-to-nitrogen ratios, intensive aeration, and minimal water exchange collectively promote the development of dense, protein-rich microbial aggregates, has established itself as one of the most resource-efficient strategies available for sustainable intensive aquaculture (Sallam et al., 2025a; Shovon et al., 2025). Within a mature BFT system, heterotrophic microbial communities assimilate inorganic nitrogenous waste, principally ammonia excreted by fish, into living microbial biomass that is directly consumed by fish as a supplementary protein source, simultaneously remediating water quality and improving feed utilization efficiency (Kumar et al., 2024; Sun et al., 2024). This dual function, waste remediation and nutritional supplementation, makes BFT particularly attractive for hypersaline groundwater systems, where conventional water exchange is constrained by salinity management costs and environmental regulations. Nevertheless, sustaining a stable and productive biofloc community is operationally demanding: precise control over the carbon-to-nitrogen ratio, continuous high-intensity aeration, and active solids management are all required, and these demands intensify as stocking density increases (Xu et al., 2016; Shourbela et al., 2021). In hypersaline environments, the additional osmotic and ionic burden placed on fish further compounds the physiological challenge of intensive rearing, creating a complex multi-stressor environment that the technology alone cannot fully mitigate (Dauda, 2020; Said et al., 2024). It is precisely at the intersection of high stocking density, elevated salinity, and biofloc system dynamics that the most consequential and least understood risks to fish welfare and production sustainability arise (Abdel-Rahim et al., 2024; Said et al., 2024; Sallam et al., 2025c).
Increasing stocking density is one of the most widely adopted strategies for maximizing output per unit volume in land-limited aquaculture, yet it simultaneously imposes a well-characterized suite of physiological consequences. Chronic crowding activates the hypothalamic–pituitary–interrenal (HPI) axis, elevating circulating cortisol, suppressing immune gene expression, reducing lymphocyte proliferation, and impairing antibody synthesis, collectively increasing susceptibility to opportunistic pathogens (Fuentes-Andraca et al., 2025). In parallel, high stocking density degrades water quality through the accumulation of total ammonia nitrogen (TAN), nitrite, and suspended solids, placing additional oxidative and osmoregulatory stress on fish (El-Dahhar et al., 2024). In saline biofloc systems in particular, fish simultaneously contend with overcrowding, elevated suspended particulate matter, fluctuating nitrogenous metabolites, and osmotic pressure, a convergence of stressors that can threaten physiological homeostasis, deplete antioxidant defenses, and erode innate immune competence to a degree that neither individual stressor would produce alone (Abdel-Rahim et al., 2024; Sallam et al., 2024, 2025a). Recent studies confirm that moderate combinations of salinity and stocking density can enhance growth performance and economic returns in tilapia BFT systems (Kumari et al., 2021; Serafini et al., 2025), whereas hypersaline conditions coupled with excessive densities significantly impair performance, feed efficiency, and physiological integrity (Li et al., 2021; Taheri et al., 2025). Critically, however, the existing evidence base is characterized by three important limitations that prevent firm management recommendations from being drawn.
First, the majority of previous studies have examined stocking density effects over short experimental windows that do not capture the cumulative physiological costs of chronic crowding across a full commercial production cycle (Haridas et al., 2017; Khanjani et al., 2024b; Raza et al., 2024). Second, most investigations have focused narrowly on growth and feed efficiency or on isolated water quality parameters, without providing the integrative, multi-system physiological assessment, spanning hematological, immune, antioxidant, endocrine, and digestive responses, necessary to locate the true welfare threshold (Abakari et al., 2021; Abdel-Rahim et al., 2024). Third, and most critically, no study to date has systematically quantified the upper safe limit of stocking density for red tilapia specifically under long-term hypersaline (36 ppt) biofloc conditions, a salinity level approaching the upper physiological tolerance boundary for this species and one that is known to exacerbate the harmful effects of elevated suspended solids and nitrogenous metabolites (Abdel-Rahim et al., 2024; Sallam et al., 2024; Metwaly et al., 2025; Xu et al., 2025). Resolving this tripartite gap is the central motivation of the present study.
Accordingly, the present study tested two primary hypotheses: (H1) increasing stocking density progressively impairs individual growth performance, feed utilization efficiency, and physiological homeostasis in red tilapia reared in a hypersaline BFT system; and (H2) a discrete threshold density exists below which the nutritional and water-quality benefits of biofloc-mediated microbial assimilation outweigh the cumulative costs of social crowding and elevated organic loading. To test these hypotheses, we conducted a 180 days trial, designed to reflect commercial-scale production cycles in desert aquaculture, assessing four stocking densities (75, 150, 250, and 300 fish m–3) across a comprehensive suite of biological endpoints: water quality, biofloc proximate composition, growth and feed utilization, whole-body composition, hematological parameters, innate immune function, oxidative status, digestive enzyme activities, and serum biochemical and endocrine indicators. The findings are intended to provide the first empirically grounded, long-term density threshold recommendation for red tilapia production in inland hypersaline biofloc systems, directly addressing the biomass–welfare trade-off that currently constrains the optimization of this emerging production model.
2. Material and methods
2.1. Ethical approval and animal welfare
All experimental procedures were approved by the Institutional Animal Care and Use Committee of Alexandria University, Egypt (Alex-IACUC; approval no. AU: 19/24/06/11/1/34), and conducted in accordance with the ARRIVE 2.0 guidelines. Fish handling, sampling, and euthanasia were performed using the following procedural safeguards: (i) all sampling was performed before the morning feed to avoid the additional metabolic perturbation of the post-prandial state; (ii) anesthesia was induced rapidly using MS-222 (100 mg L–1; tricaine methanesulfonate, buffered to tank hydrogen ion potential (pH) with sodium bicarbonate) to reduce the conscious handling interval to the minimum practicable duration; and (iii) blood was collected from the caudal vein within 60 s of initial fish contact. Euthanasia was performed by a lethal overdose of MS-222 (300 mg L–1) prior to tissue collection.
2.2. Experimental site and culture facilities
The experiment was conducted at the Triangle Unit of the El-Max Applied Research Station (31°08′40.54″ N, 29°51′07.43″ E), National Institute of Oceanography and Fisheries, Alexandria, Egypt. The facility was partially shaded to limit direct solar radiation and reduce excessive increases in water temperature during peak sunlight hours, thereby minimizing thermal stress while maintaining natural photoperiod conditions. Twelve rectangular concrete tanks (1.0 m × 0.75 m × 1.5 m; effective volume: 1 m3) were used. The raw artesian groundwater had a salinity of approximately 42–45 g L–1. This was diluted with freshwater from the station’s reserve supply to reach the target salinity of 36 g L–1. Salinity was verified daily with a calibrated refractometer and adjusted as needed to compensate for evaporative concentration.
2.3. Biofloc system establishment and quality management
The biofloc system was established in all 12 tanks 21 days prior to fish stocking. Tanks were filled with hypersaline artesian groundwater adjusted to 36 g L–1 and inoculated with 200 mL L–1 of mature biofloc biomass obtained from an established red tilapia BFT system operating at the same facility, providing a seed community of heterotrophic bacteria, microalgae, and associated microorganisms. Sugarcane molasses (technical-grade, with standard dry-weight carbon content of 40%) was added daily as an external carbon source at a dose calculated to achieve and maintain a target carbon-to-nitrogen (C:N) ratio of approximately 15:1, consistent with common practice in BFT literature and following the frameworks of Avnimelech (2009) and Ebeling et al. (2006). Carbon inputs were computed daily based on the nitrogen content of the applied inoculum feed ration and an assumed bacterial nitrogen assimilation efficiency of 50%, consistent with established BFT carbon supplementation protocols. Continuous aeration was maintained throughout the pre-stocking maturation period using high-capacity regenerative air blowers (0.75 kW) connected to perforated PVC diffuser pipes installed along the tank floor. System maturity was confirmed when biofloc volume (BFV) stabilized between 15 and 25 mL L–1, measured using Imhoff settling cones after 30 min of quiescent settling, and TAN remained below 1.0 mg L–1 on three consecutive monitoring days (Ahmad et al., 2019; Khanjani et al., 2024a). Only after these stability criteria were met, the fish were introduced to the tanks.
Water temperature, pH, and dissolved oxygen were measured daily using calibrated portable meters (Hanna Instruments, Italy; YSI DO200A). TAN, nitrite (NO2 ––N), nitrate (NO3 ––N), and total alkalinity were measured every 10 days using YSI 9300 photometer. Unionized ammonia (NH3–N) was calculated according to Emerson et al. (1975) using TAN, pH, and temperature values. Total suspended solids (TSS) were determined gravimetrically by vacuum filtration, and BFV was measured using Imhoff cones after 30 min of settling, following Ahmad et al. (2019). Total dissolved solids (TDS) were measured using a calibrated conductivity/TDS probe (HI98192, Hanna Instruments, Italy) at the same sampling intervals as TSS.
Active management of TSS, TDS, and BFV was conducted throughout the experiment to prevent excessive accumulation. When BFV exceeded 50 mL L–1 or TSS exceeded 500 mg L–1, settled sludge was removed by draining approximately 10–15% of the tank volume from the bottom outlet, retaining the supernatant fraction to preserve the active suspended microbial community. The removed volume was immediately replaced with fresh hypersaline groundwater pre-adjusted to 36 g L–1 to maintain salinity and tank volume. TDS was not adjusted; it rose progressively with stocking density because of the cumulative ionic input from fish excretion and evaporative concentration under minimal water exchange, and it was monitored as an indicator of overall dissolved load rather than controlled as an experimental variable.
2.4. Fish source, acclimation, and experimental design
Red tilapia (Oreochromis sp., Florida strain) fingerlings were obtained from a GAFRD-certified hatchery (Km 21, west of Alexandria, Egypt). A total of approximately 2,500 fingerlings were acclimated for 15 days under experimental water conditions. Following acclimation, 2,325 (initial body weight: 10.90 ± 0.14 g and initial total length (TL): 7.2 ± 0.3 cm) fish were stocked into tanks in which a mature biofloc community was already established, at the following densities: 75, 150, 250, and 300 fish m–3, each with three replicates (Sallam et al., 2025c). The experiment lasted for 180 days under a completely randomized design.
Fish were fed a commercial floating tilapia diet containing 30% crude protein (Skretting, Egypt) (Sallam et al., 2025c). Feeding was conducted to apparent satiation, three times daily (09:00, 14:00, and 16:00 h). Feed intake (FI) was quantified at each meal by subtracting the oven-dried weight of uneaten pellets recovered from tank outlets after a 30 min post-feeding interval from the weight of feed offered, yielding a daily FI value per tank. Cumulative FI per tank was summed across the trial to calculate total FI per fish. Feeding rations were adjusted biweekly following each biomass sampling event, in accordance with NRC (2011) recommendations, to account for increasing biomass and to minimize residual organic loading of the biofloc system.
2.5. Growth performance and biometric indices
At each biweekly sampling event, 10 fish per tank (30 fish per treatment) were dip-netted, weighed to the nearest 0.1 g using a digital balance, and measured for TL to the nearest 0.1 cm using a measuring board, before being returned to their respective tanks. At the end of the trial, all fish were harvested, counted, individually weighed, and measured. Growth and feed utilization parameters, including final body weight, weight gain, average daily gain, specific growth rate (SGR), FI, feed conversion ratio (FCR), protein efficiency ratio (PER), and survival rate, were calculated following standard equations (Sallam et al., 2024, 2025b; Tefal et al., 2024). Biological indices were calculated as follows: hepatosomatic index (HSI, %) = (liver weight/body weight) × 100; viscerosomatic index (VSI, %) = (viscera weight/body weight) × 100; and condition factor (K) = (W/L³) × 100, where W is the body weight in grams, and L is the total length in centimeters.
2.6. Blood sampling and hematological analysis
At the end of the experiment, 5 fish per tank (15 fish per treatment) were anesthetized, and blood was collected from the caudal vein using sterile syringes. Heparinized blood was used for hematological analysis. Red blood cell (RBC) and white blood cell (WBC) counts were determined using a Neubauer hemocytometer following the methods of Hendricks (1952) and Shaw (1930), respectively. Hemoglobin (Hb) concentration and hematocrit (HCT) values were measured according to van Kampen and Zijlstra (1961).
2.7. Serum biochemical, antioxidant, hormonal, and immune responses
Serum was separated by centrifugation (3,000 × g, 10 min, 4°C) and stored at −80°C until analysis. Serum biochemical parameters, including total protein, albumin, aspartate aminotransferase (AST), alanine aminotransferase (ALT), urea, and uric acid, were determined using commercial diagnostic kits (Bio-Diagnostic Co., Egypt) following established methods (Reitman & Frankel, 1957; Fawcett & Scott, 1960; Doumas et al., 1971). Cortisol and growth hormone (GH) concentrations were quantified using commercial ELISA kits (CUSABIO), with absorbance measured at 450 nm. Innate immune responses were assessed by measuring serum lysozyme activity using the turbidimetric method described by Ellis (1990), while immunoglobulin M (IgM) and complement component (C3) were quantified following protocols reported in Sallam et al. (2024). Antioxidant status was assessed by measuring the activities of superoxide dismutase (SOD) (Marklund and Marklund, 1974), catalase (CAT) (Bergmeyer, 2012), glutathione peroxidase (GPx) (Nakano et al., 1992), as well as the level of malondialdehyde (MDA) (Mendes et al., 2009) using standard colorimetric methods.
2.8. Whole-body, biofloc proximate composition, and digestive enzymes
To ascertain whole-body composition, 30 fish from each treatment were randomly selected at the conclusion of the trial. Three replicate biofloc samples (one per tank) were collected per treatment at the end of the trial for proximate composition analysis. Both fish and biofloc samples were examined for moisture, dry matter, crude protein, crude fat, and ash content using the AOAC’s standard protocols (AOAC, 2016). Five fish in each tank (15 fish per treatment) were chosen at random for the digestive enzyme tests. The intestinal contents were gathered for enzymatic investigation after the intestines were properly removed. A Teflon-coated tissue homogenizer was used to homogenize the contents with a cold 0.25 M sucrose solution in glass test tubes. The contents were then centrifuged at 5,000 × g for 30 min at 4°C. According to the protocols described by Makled et al. (2019), the resultant supernatant was extracted, stored at −20°C, and all enzyme activity assessments were carried out within 24 h of extraction.
Digestive enzyme activities were expressed as specific activity (U mg–1 protein) after normalization of protein content using the Bradford method (Bradford, 1976). Protease activity was measured using bovine serum albumin as the substrate following Walter (1984), amylase activity was determined using soluble starch and the dinitrosalicylic acid method according to Bernfeld (1955), and lipase activity was assayed using β-naphthyl caprylate following Versaw et al. (1989). Absorbance was measured using a microplate reader.
2.9. Statistical analysis
The data for growth performance, survival, hematological, immunological, biochemical, and proximate composition characteristics are shown as the mean value ± standard error of the mean. The experimental tank was treated as a statistical unit throughout. Individual fish measurements were first averaged within each tank to yield a single tank-level mean per parameter, and these tank means (n = 3 per treatment) were used as observations in all subsequent analyses. One-way analysis of variance was performed using SPSS version 20 (IBM Corp., Armonk, NY, USA) to determine significant differences among stocking density treatments. When significant effects were seen (P < 0.05), means were compared utilizing Tukey’s post hoc test. Before the analysis, it was checked that the assumptions of normality and homogeneity of variance were met.
3. Results
3.1. Biofloc quality
3.1.1. Water quality dynamics under different stocking densities
As shown in Table 1, increasing fish stocking density significantly affected water quality in the biofloc system. Dissolved oxygen declined progressively from 7.19 mg L–1 at 75 fish m–3 to 6.20 mg L–1 at 300 fish m–3, while pH varied significantly among densities (7.55–7.9). Total alkalinity decreased significantly at the highest density (132 mg L–1 at 300 fish m–3) compared to lower densities. Concentrations of TAN, unionized ammonia, and nitrite increased significantly with stocking density, reaching maximum values at 300 fish m–3 (1.4, 0.06, and 0.12 mg L–1, respectively), whereas nitrate levels declined from 0.29 mg L–1 at 75 fish m–3 to 0.12 mg L–1 at 300 fish m–3. TDS and TSS also increased with density, with TDS peaking at 48.9 g L–1 and TSS at 455 mg L–1 in the 300 fish m–3 group. BFV increased significantly with density, from 30.1 mL L–1 at 75 fish m–3 to 39.2 mL L–1 at 300 fish m–3.
Table 1
Influence of fish stocking density on key water quality indicators in the culture system
| Water quality parameters | Stocking density (fish m–3) | |||
|---|---|---|---|---|
| 75 | 150 | 250 | 300 | |
| Dissolved oxygen (mg L–1) | 7.19 ± 0.03 a | 6.96 ± 0.09 b | 6.57 ± 0.05 c | 6.20 ± 0.10 d |
| pH | 7.63 ± 0.19 | 7.83 ± 0.13 | 7.90 ± 0.15 | 7.55 ± 0.17 |
| Total alkalinity (as CaCO₃, mg L–1) | 141 ± 1.51 a | 137 ± 3.50 a | 136 ± 0.76 ab | 132 ± 1.51 b |
| TAN (mg L–1) | 0.77 ± 0.02 c | 1.09 ± 0.01 b | 1.22 ± 0.07 b | 1.40 ± 0.09 a |
| Unionized ammonia (NH3–N, mg L–1) | 0.03 ± 0.01 c | 0.04 ± 0.01 bc | 0.06 ± 0.02 ab | 0.06 ± 0.01 a |
| Nitrite nitrogen (NO2⁻–N, mg L–1) | 0.07 ± 0.02 c | 0.08 ± 0.01 bc | 0.10 ± 0.01 ab | 0.12 ± 0.01 a |
| Nitrate nitrogen (NO3⁻–N, mg L–1) | 0.29 ± 0.02 a | 0.28 ± 0.02 ab | 0.26 ± 0.01 b | 0.12 ± 0.01 c |
| TDS (g L–1) | 15.80 ± 0.93 c | 30.20 ± 2.35 b | 46.20 ± 1.21 a | 48.90 ± 1.87 a |
| TSS (mg L–1) | 425 ± 14.63 ab | 412 ± 17.01 b | 414 ± 20.27 ab | 455 ± 8.85 a |
| BFV (mL L–1) | 30.10 ± 0.78 d | 33.30 ± 0.93 c | 36.50 ± 0.93 b | 39.20 ± 1.21 a |
Values are presented as mean value ± SD. Different letters within the same row indicate significant differences among stocking densities (P < 0.05, n = 3 pooled samples).
3.1.2. Proximate composition of biofloc
As shown in Table 2, stocking density significantly influenced the proximate composition of biofloc. Moisture content decreased with increasing density, from 76.1% at 75 fish m–3 to 74.8% at 300 fish m–3. Conversely, dry matter, crude protein, and crude lipid contents increased significantly with density, reaching their highest values (25.2%, 30.2%, and 5.79%, respectively) at 300 fish m–3. In contrast, ash content declined progressively with higher densities, from 23.8% at 75 fish m–3 to 19.5% at 300 fish m–3.
Table 2
Proximate composition of biofloc under different fish stocking densities in the BFT system
| BFT analysis | Stocking density (fish m–3) | |||
|---|---|---|---|---|
| 75 | 150 | 250 | 300 | |
| Moisture content (%) | 76.10 ± 0.07 a | 75.80 ± 0.09 a | 75.00 ± 0.14 b | 74.80 ± 0.05 c |
| Dry matter (%) | 23.90 ± 0.07 d | 24.20 ± 0.09 c | 24.90 ± 0.03 b | 25.20 ± 0.05 a |
| Crude protein (%) | 25.30 ± 0.19 d | 26.30 ± 0.29 c | 28.40 ± 0.14 b | 30.20 ± 0.28 a |
| Crude lipid (%) | 4.75 ± 0.16 c | 5.09 ± 0.09 bc | 5.38 ± 0.17 b | 5.79 ± 0.12 a |
| Ash content (%) | 23.80 ± 0.10 a | 22.80 ± 0.16 b | 21.40 ± 0.10 c | 19.50 ± 0.10 d |
Values are presented as mean value ± SD. Different letters within the same row indicate significant differences among stocking densities (P < 0.05, n = 3 pooled samples).
3.2. Growth performance
As presented in Table 3, stocking density significantly affected the growth performance and survival of red tilapia (P < 0.05). Average final weight (AFW) and weight gain were not significantly different across 75–250 fish m–3 but significantly declined at 300 fish m–3 (226 g and 215 g fish–1). SGR showed minor, non-significant differences among treatments (P = 0.092). Survival decreased progressively with increasing density, from 94% at 75 fish m–3 to 90.4% at 300 fish m–3. In contrast, total biomass yield increased significantly with stocking density, reaching a maximum of 61.35 kg m–3 at 300 fish m–3.
Table 3
Growth performance and yield of fish reared at different stocking densities
| Growth parameters | Stocking density (fish m–3) | |||
|---|---|---|---|---|
| 75 | 150 | 250 | 300 | |
| AFW (g fish–1) | 254 ± 2.63 a | 252 ± 5.35 a | 251 ± 3.29 a | 226 ± 3.12 b |
| Weight gain (g fish–1) | 244 ± 1.99 a | 241 ± 4.68 a | 240 ± 3.64 a | 215 ± 3.81 b |
| SGR (% day–1) | 1.77 ± 0.10 | 1.73 ± 0.09 | 1.74 ± 0.03 | 1.68 ± 0.07 |
| Survival rate (%) | 94 ± 0.57 a | 93 ± 1.16 ab | 91.8 ± 0.38 bc | 90.4 ± 0.19 c |
| Total yield (TY, kg m–3) | 17.94 ± 0.17 d | 35.18 ± 0.80 c | 56.8 ± 0.48 b | 61.35 ± 0.48 a |
Values are presented as mean value ± SD. Different letters within the same row indicate significant differences among stocking densities (P < 0.05, n = 3 pooled samples).
3.3. Feed utilization, somatic indices, and condition factor
As shown in Table 4, stocking density influenced feed utilization and somatic indices. FI increased with density, reaching a maximum of 370 g fish–1 at 250 fish m–3. FCR worsened at higher densities, from 1.17 at 75 fish m–3 to 1.69 at 300 fish m–3, while PER declined from 3.45 to 2.39 across the same densities. HSI and VSI increased significantly at higher densities, indicating enhanced liver and visceral development. In contrast, condition factor (K) decreased progressively with density, from 3.12 at 75 fish m–3 to 2.34 at 300 fish m–3.
Table 4
Feed utilization, somatic indices, and condition factor of fish reared at different stocking densities
| Parameters | Stocking density (fish m–3) | |||
|---|---|---|---|---|
| 75 | 150 | 250 | 300 | |
| FI (g fish–1) | 285 ± 6.16 b | 306 ± 3.52 b | 370 ± 6.18 a | 358 ± 18.71 a |
| FCR | 1.17 ± 0.02 d | 1.27 ± 0.02 c | 1.54 ± 0.02 b | 1.69 ± 0.05 a |
| PER | 3.45 ± 0.09 a | 3.11 ± 0.02 b | 2.57 ± 0.02 c | 2.39 ± 0.09 d |
| HSI (%) | 1.97 ± 0.02 b | 2.03 ± 0.04 b | 2.29 ± 0.05 a | 2.21 ± 0.02 a |
| VSI (%) | 6.98 ± 0.26 b | 7.16 ± 0.02 ab | 7.37 ± 0.04 a | 7.21 ± 0.07 ab |
| Condition factor | 3.12 ± 0.04 a | 2.92 ± 0.07 b | 2.58 ± 0.04 c | 2.34 ± 0.09 d |
Values are presented as mean value ± SD. Different letters within the same row indicate significant differences among stocking densities (P < 0.05, n = 3 pooled samples).
3.4. Whole-body proximate composition
As shown in Table 5, stocking density significantly affected the whole-body composition of red tilapia. Moisture content increased with density, from 71.5% at 75 fish m–3 to 74.5% at 300 fish m–3, whereas dry matter and ash content decreased, with the lowest values observed at the highest density. Crude protein content declined slightly at higher densities, from 26.8% at 75 fish m–3 to 25.8% at 300 fish m–3. In contrast, crude lipid content increased with density, reaching 3.03% at 300 fish m–3.
Table 5
Whole-body proximate composition of fish reared at different stocking densities
| Body composition | Stocking density (fish m–3) | |||
|---|---|---|---|---|
| 75 | 150 | 250 | 300 | |
| Moisture content (%) | 71.50 ± 0.31 c | 71.70 ± 0.17 bc | 73.30 ± 1.21 ab | 74.50 ± 0.14 a |
| Dry matter (%) | 28.50 ± 0.31 a | 28.30 ± 0.17 ab | 26.70 ± 1.21 bc | 25.50 ± 0.14 c |
| Crude protein (%) | 26.80 ± 0.29 a | 26.50 ± 0.07 a | 26.40 ± 0.17 a | 25.80 ± 0.14 b |
| Crude lipid (%) | 2.64 ± 0.04 b | 2.61 ± 0.04 b | 2.73 ± 0.04 ab | 3.03 ± 0.24 a |
| Ash content (%) | 25.70 ± 0.05 a | 25.40 ± 0.19 ab | 24.70 ± 0.52 bc | 24.40 ± 0.19 c |
Values are presented as mean value ± SD. Different letters within the same row indicate significant differences among stocking densities (P < 0.05, n = 3 pooled samples).
3.5. Digestive enzyme activities
As presented in Figure 1, stocking density significantly affected digestive enzyme activities in red tilapia. Protease and amylase activities were highest at lower densities (56.5 and 34.1 U mg–1 protein at 75 fish m–3, respectively) and decreased significantly at 300 fish m–3 (47.9 and 26.3 U mg–1 protein). Lipase activity showed a more complex pattern, peaking at 150 fish m–3 (54.2 U mg–1 protein) and declining at the highest density to 40.1 U mg–1 protein.
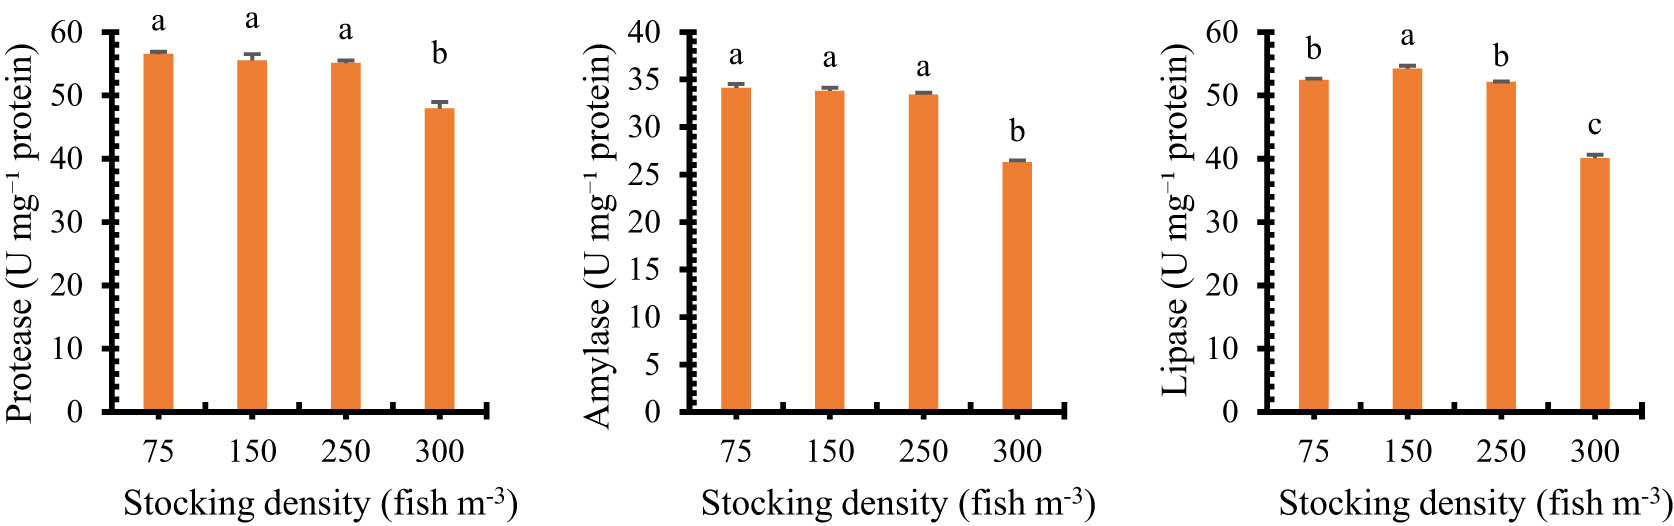
Figure 1
Digestive enzyme activities of red tilapia reared under different stocking densities in a biofloc system.
3.6. Hematological responses
As shown in Table 6, increasing stocking density significantly affected hematological parameters in red tilapia. RBC count, Hb concentration, and HCT declined progressively with density, with the lowest values observed at 300 fish m–3. WBC count and lymphocyte percentages also decreased at higher densities, while monocytes and neutrophils showed significant reductions in the 250 and 300 fish m–3 groups.
Table 6
Hematological responses of fish reared at different stocking densities
| Parameters | Stocking density (fish m–3) | |||
|---|---|---|---|---|
| 75 | 150 | 250 | 300 | |
| RBC count (×10⁶ µL–1) | 2.87 ± 0.17 a | 2.19 ± 0.12 b | 1.66 ± 0.09 c | 1.54 ± 0.02 c |
| Hb concentration (g dL–1) | 6.38 ± 0.16 a | 6.51 ± 0.24 a | 5.98 ± 0.14 a | 3.87 ± 0.26 b |
| HCT (%) | 19.70 ± 2.34 a | 18.30 ± 0.83 a | 17.00 ± 0.71 a | 12.10 ± 0.29 b |
| WBC count (×10³ µL–1) | 21.90 ± 0.50 a | 21.10 ± 0.42 a | 21.00 ± 0.59 a | 17.2 ± 1.23 b |
| Lymphocytes (%) | 58.20 ± 6.62 a | 56.70 ± 6.24 a | 51.10 ± 7.00 ab | 37.90 ± 4.17 b |
| Monocytes (%) | 2.27 ± 0.09 a | 2.18 ± 0.05 a | 1.95 ± 0.05 b | 1.31 ± 0.05 c |
| Neutrophils (%) | 17.10 ± 0.57 a | 16.6 0 ± 0.40 ab | 15.80 ± 0.40 b | 13.2 ± 0.45 c |
Values are presented as mean value ± SD. Different letters within the same row indicate significant differences among stocking densities (P < 0.05, n = 3 pooled samples).
3.7. Immune and antioxidant responses
As presented in Figure 2, stocking density significantly influenced both immune and antioxidant parameters in red tilapia (P < 0.05). IgM and C3 levels declined significantly at higher densities, with the lowest values observed at 300 fish m–3. Antioxidant enzyme activities, including GPx, SOD, and CAT, decreased progressively with increasing density. Conversely, MDA, an indicator of lipid peroxidation, increased significantly at higher densities, peaking at 0.95 nmol mL–1 in the 300 fish m–3 group.
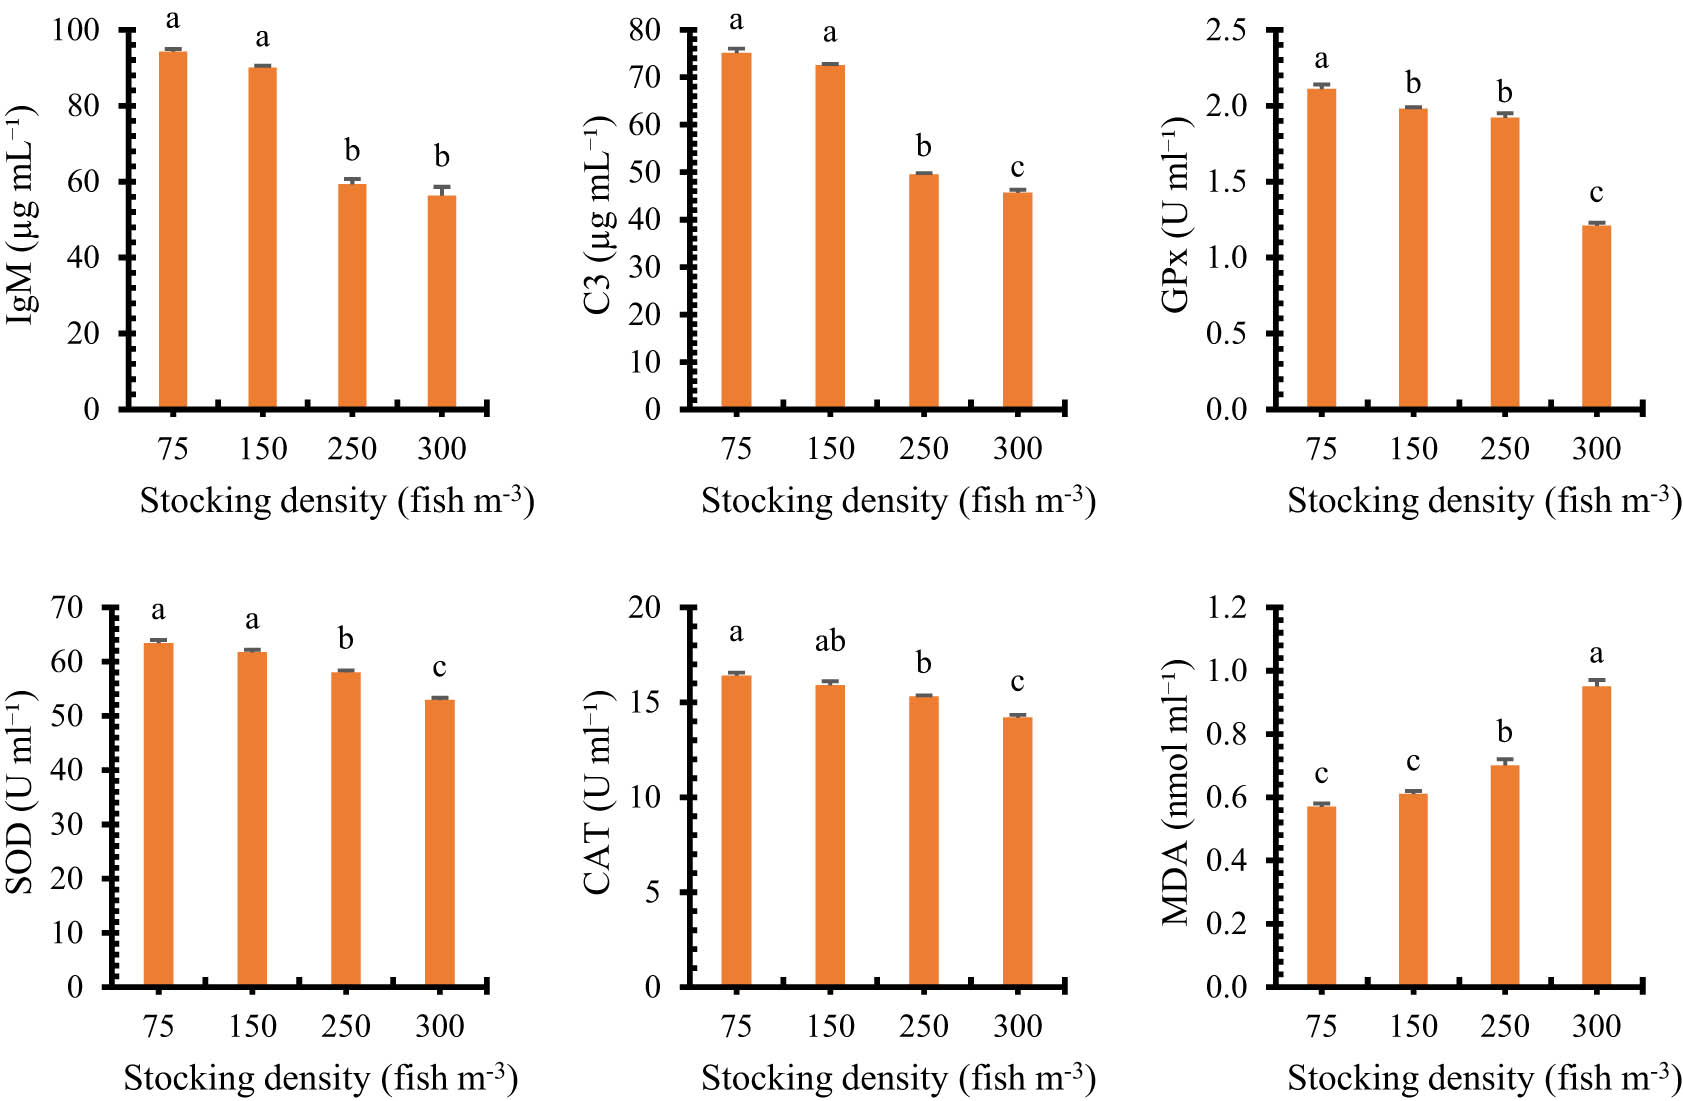
Figure 2
Serum immune and antioxidant responses of red tilapia reared at different stocking densities in a biofloc system.
3.8. Serum biochemical, hormonal, and stress indicators
As shown in Table 7, stocking density significantly affected serum biochemical, hormonal, and stress parameters in red tilapia. Total protein and globulin levels decreased progressively with increasing density, while albumin and the albumin/globulin (A/G) ratio increased, indicating alterations in protein metabolism. Liver enzymes, AST and ALT, as well as urea and uric acid concentrations increased significantly at higher densities, suggesting metabolic stress and hepatic strain. GH and lysozyme activity declined with density, whereas cortisol levels rose markedly, peaking at 248 pg mL–1 in the 300 fish m–3 group.
Table 7
Serum biochemical, hormonal, and stress indicators of fish reared at different stocking densities
| Parameters | Stocking density (fish m–3) | |||
|---|---|---|---|---|
| 75 | 150 | 250 | 300 | |
| Total protein (g dL–1) | 3.76 ± 0.04 a | 3.73 ± 0.04 ab | 3.65 ± 0.05 b | 3.19 ± 0.01 c |
| Albumin (g dL–1) | 0.47 ± 0.05 b | 0.49 ± 0.05 b | 0.53 ± 0.07 b | 0.67 ± 0.02 a |
| Globulin (g dL–1) | 3.29 ± 0.02 a | 3.24 ± 0.02 b | 3.12 ± 0.02 c | 2.52 ± 0.02 d |
| A/G ratio | 0.14 ± 0.02 b | 0.15 ± 0.02 b | 0.17 ± 0.02 b | 0.27 ± 0.01 a |
| AST (IU L–1) | 56.70 ± 1.04 c | 58.20 ± 0.48 bc | 59.90 ± 0.21 b | 74.10 ± 0.80 a |
| ALT (IU L–1) | 30.30 ± 0.88 b | 31.2 ± 0.94 b | 32.1 ± 0.62 b | 45.00 ± 0.74 a |
| Urea (mg dL–1) | 37.80 ± 0.40 c | 38.70 ± 0.76 c | 40.30 ± 0.31 b | 41.80 ± 0.52 a |
| Uric acid (mg dL–1) | 2.37 ± 0.02 c | 2.51 ± 0.07 c | 2.76 ± 0.02 b | 3.01 ± 0.09 a |
| GH (ng mL–1) | 2.86 ± 0.05 a | 2.58 ± 0.16 b | 2.25 ± 0.04 c | 2.08 ± 0.04 c |
| Lysozyme activity (µg mL–1) | 1.04 ± 0.04 a | 0.85 ± 0.04 b | 0.78 ± 0.04 b | 0.65 ± 0.02 c |
| Cortisol (pg mL–1) | 196 ± 1.40 b | 204 ± 1.16 b | 216 ± 16.43 b | 248 ± 2.01 a |
Values are presented as mean value ± SD. Different letters within the same row indicate significant differences among stocking densities (P < 0.05, n = 3 pooled samples).
4. Discussion
Despite the progressive intensification of organic and nitrogenous loading across the four stocking densities, the BFT system maintained environmental conditions within physiologically acceptable ranges throughout the 180 days trial. Dissolved oxygen declined from 7.19 to 6.20 mg L–1 with increasing density, reflecting heightened respiratory demand from both fish and the microbial community, yet remained above the recognized acute stress threshold for red tilapia at all densities, confirming that the aeration capacity deployed was sufficient to sustain aerobic metabolism under these stocking conditions (Abakari et al., 2020; Serafini et al., 2025). The accumulation of TAN and nitrite followed a density-dependent pattern, yet unionized ammonia remained remarkably low throughout (0.03–0.06 mg L–1), attributable to effective C:N management and active heterotrophic assimilation of ammonia nitrogen into microbial biomass (Jamal et al., 2020). The counter-intuitive decline in nitrate at the highest density most plausibly reflects either rapid assimilation of oxidized nitrogen by the expanding microbial community or localized denitrification within the anaerobic cores of dense floc aggregates, a dynamic reported in other high-density BFT systems (Khanjani et al., 2024a; Liu et al., 2025). The progressive increase in TSS, TDS, and BFV with stocking density is consistent with the well-documented relationship between organic loading and heterotrophic bacterial proliferation in BFT systems; a larger, more active microbial community at higher densities would be expected to enhance waste bioremediation capacity and increase the protein contribution of the floc to fish nutrition (Jamal et al., 2020; Kumar et al., 2021). Collectively, these water quality data demonstrate that the BFT system functioned as designed under all four tested densities, remediating nitrogenous waste and sustaining productive conditions, but did so with progressively narrowing safety margins as density increased.
The present results and previous studies highlight a biologically important distinction between two components of the density–growth relationship: individual weight performance and total biomass yield responded in opposite directions to increasing stocking density, creating a fundamental biomass–welfare trade-off (Yengkokpam et al., 2020; Saraiva et al., 2022). Individual final weight and weight gain were statistically equivalent across 75–250 fish m–3, indicating a physiological buffer zone within which the BFT system’s combined benefits (adequate oxygen, controlled nitrogenous metabolites, and protein-rich supplementary floc nutrition) were sufficient to sustain near-equivalent individual growth (Diao et al., 2023; Said et al., 2024). This plateau behavior was not maintained at 300 fish m–3, where both parameters declined significantly, suggesting that this density represents the point at which chronic crowding stress imposes metabolic costs that exceed the compensatory capacity of the biofloc system. The non-significant variation in SGR (P = 0.092) across all treatments reinforces this interpretation: the rate of proportional growth was broadly preserved, but its absolute expression over 180 days was attenuated at 300 fish m–3 by the energy-diverting effects of sustained HPI-axis activation (Barton, 2002; Canosa & Bertucci, 2023). In contrast, total biomass yield scaled positively with stocking density, reaching a maximum of 61.35 kg m–3 at 300 fish m–3. This yield compares favorably with values reported for tilapia reared in freshwater BFT systems (e.g., 28–52 kg m–3; Fuentes-Andraca et al., 2025; Serafini et al., 2025), recirculating aquaculture systems (e.g., 30–65 kg m–1; Croll et al., 2023), and conventional earthen ponds (typically <15 kg m–3; Yengkokpam et al., 2020), underscoring the volumetric efficiency advantage of BFT under hypersaline conditions. However, mean final weights at 250 and 300 fish m–3 (233 and 226 g, respectively) fell substantially below the widely cited commercial harvest threshold of ∼350 g for tilapia, implying an extension of the production cycle by an estimated 30–45 days and a corresponding increase in operational costs (feed, labor, energy) that partially erodes the economic advantage of the higher TY (Croll et al., 2023; Fuentes-Andraca et al., 2025). The impairment of FCR (1.17–1.69) and PER (3.45–2.39) with increasing density is mechanistically coherent with this picture: the observed increase in HSI and VSI at high densities reflects diversion of metabolic energy and nutrient substrates toward stress-associated hepatic lipid deposition and visceral organ development rather than lean somatic growth, while the concurrent decline in condition factor confirms a progressive deterioration of overall body condition (Abdel-Tawwab et al., 2015; Schreck & Tort, 2016).
The systematic improvement in biofloc nutritional quality with increasing stocking density (rising crude protein [25.3–30.2%], increasing crude lipid [4.75–5.79%], and declining ash content [23.8–19.5%]) represents one of the few genuinely positive outcomes of higher stocking density in the present study, and carries important mechanistic implications. The elevation of crude protein and lipid with increased organic loading reflects the proliferation of heterotrophic bacteria, microalgae, and zooplankton communities stimulated by the higher nitrogen and carbon inputs at greater fish densities (Said & Taha, 2022; Li et al., 2023). The inverse relationship between ash content and stocking density indicates a structural shift in floc composition toward a greater proportion of organic microbial biomass relative to inorganic mineral particulates, consistent with intensified bacterial nitrogen assimilation (Ekasari et al., 2014; Sallam et al., 2024). While this compositional improvement theoretically enhances the supplementary nutritional value of the biofloc for fish at higher densities, partially compensating for competitive feed access, it is important to note that the growth and physiological data presented above demonstrate that this nutritional benefit was insufficient to offset the compounding stress burden at 250–300 fish m–3. The density-enhanced biofloc quality therefore represents an important but limited buffering mechanism within the BFT system’s response to intensification.
The multi-system physiological responses documented across the hematological, immune, antioxidant, endocrine, and digestive data are most coherently interpreted within the framework of allostatic overload (Vindas et al., 2018; Park et al., 2025; Habib et al., 2026). Under moderate stocking conditions (75–150 fish m–3), the physiological demands of the rearing environment, social competition, elevated suspended solids, and the osmoregulatory cost of 36 ppt salinity, remained within the allostatic load that the fish could sustain through normal regulatory adjustment. At densities of 250–300 fish m–3, however, the cumulative burden of chronic crowding, deteriorating water quality margins, and sustained osmotic stress exceeded the system’s adaptive capacity, triggering a coordinated and self-reinforcing stress cascade that sequentially compromised every measured physiological system.
The cascade is initiated at the endocrine level. Elevated cortisol, peaking at 248 pg mL–1 at 300 fish m–3, is the primary hormonal signal of sustained HPI-axis activation and serves as the mechanistic bridge linking crowding stress to downstream physiological impairment across all other response systems (Barton, 2002; Tort, 2011). Cortisol simultaneously suppresses GH secretion and GH receptor sensitivity, directly impairing anabolic growth signaling and providing the endocrine explanation for the growth suppression observed at 300 fish m–3 (Canosa & Bertucci, 2023). It also down-regulates lymphocyte proliferation, immunoglobulin synthesis, and complement activation, producing the reductions in IgM and C3 that render high-density fish progressively less capable of mounting an effective immune response to pathogen challenge (Magnadóttir, 2006; Uribe et al., 2011). The hematological data provide corroborating evidence of this immune deterioration: progressive declines in RBC, Hb, and HCT indicate both reduced oxygen-carrying capacity, amplifying the metabolic challenge of crowding, and a general suppression of hemopoiesis consistent with chronic glucocorticoid elevation (Haghparast et al., 2020; Metwaly et al., 2025). The concurrent decreases in WBC and lymphocyte percentages directly reflect the cortisol-mediated lymphopenia characteristic of prolonged HPI-axis activation (Yarahmadi et al., 2016; Long et al., 2019; Liu et al., 2024).
At the cellular level, chronic cortisol elevation and the metabolic hyperactivity of intensive rearing drive an increase in mitochondrial reactive oxygen species (ROS) production that overwhelms the enzymatic antioxidant defense system. The progressive, density-dependent depletion of SOD, CAT, and GPx activities reflects this depletion of antioxidant reserve, leaving cellular macromolecules increasingly exposed to oxidative damage (Lushchak, 2011; Holhorea et al., 2023; Li et al., 2024). The near-doubling of MDA, the terminal product of lipid peroxidation, at 300 fish m–3 (0.95 nmol mL–1) quantifies the resulting oxidative damage to membrane phospholipids and provides a direct molecular index of cellular injury. This oxidative damage is not isolated but feeds back into immune suppression, since ROS-damaged immune cells have impaired proliferative and secretory capacity, creating a self-reinforcing cycle of deteriorating immune competence and escalating oxidative stress (Emerenciano et al., 2017; Kumar et al., 2021, 2023).
The digestive enzyme data close the cascade at the nutritional level (El Basuini et al., 2025; Shehata et al., 2026a). Protease and amylase activities declined significantly with increasing stocking density, while lipase showed a more complex pattern, peaking at the intermediate density of 150 fish m–3 before declining sharply at the highest density. This pattern is mechanistically consistent with stress-mediated suppression of gastrointestinal secretory function: cortisol elevation reduces enteric blood flow, impairs intestinal motility, and suppresses bile production, collectively depressing the secretion and activity of digestive enzymes (Liu et al., 2018; Trenzado et al., 2018). Critically, this digestive impairment means that even at adequate feed availability and with protein-enriched biofloc nutritional supplementation, high-density fish were progressively less able to assimilate ingested nutrients, providing a direct mechanistic link between HPI-axis activation and the worsening FCR and growth performance documented above (Adineh et al., 2022; Taheri et al., 2025). The deterioration of serum total protein and globulin alongside rising AST, ALT, urea, and uric acid at high densities further indicates hepatorenal strain under this combined metabolic and oxidative burden, with the liver increasingly functioning in a damage-repair mode rather than in an anabolic-growth mode (Shourbela et al., 2017; Abdel-Warith et al., 2021).
Taken together, these findings establish that in hypersaline BFT systems, the critical biological threshold lies between 150 and 250 fish m–3. Below 150 fish m–3, allostatic load remains manageable and all physiological systems function within normal adaptive ranges. Between 150 and 250 fish m–3, compensatory mechanisms are strained but partially functional. Above 250 fish m–3, allostatic overload is evident across every physiological domain assessed (endocrine, immune, oxidative, hematological, digestive, and hepatic), indicating that this density represents an unsustainable long-term rearing condition from a welfare standpoint, irrespective of the total biomass yield achieved.
5. Future prospects in tilapia production in hypersaline groundwater
Future research should address the following priorities. First, intermediate density increments (e.g., 175 and 225 fish m–3) should be assessed to define the allostatic threshold more precisely and to determine whether welfare-protective management interventions can extend the safe operating density range. Second, the interaction between stocking density and salinity should be systematically explored across a range of salinities (e.g., 15, 25, and 36 ppt) to generate salinity-specific density threshold recommendations applicable across the range of groundwater conditions encountered in arid-region aquaculture. Third, a pathogen-challenge component should be incorporated in future welfare studies to determine whether the observed immune parameter reductions at high density translate to clinically meaningful increases in disease susceptibility under real farm conditions. Fourth, formal techno-economic modelling integrating feed cost, time-to-market, energy consumption, and market price scenarios should be conducted to identify the density at which the marginal cost of the welfare and productivity losses at high stocking density begins to exceed the revenue benefit of higher TY (Croll et al., 2023; Fuentes-Andraca et al., 2025). Fifth, the effect of stocking density on individual size dispersion (coefficient of variation in body weight) should be quantified in future studies, as increased growth heterogeneity under high crowding conditions can substantially reduce the proportion of fish reaching commercial market size simultaneously and complicate harvest scheduling (Azaza et al., 2013). Evidence from other teleost species indicates that crowding amplifies size variance through differential access to feed, space, and dissolved oxygen (Song et al., 2026).
6. Conclusion
This 180 days study provides the first integrative, long-term assessment of stocking density effects on red tilapia reared in a hypersaline (36 ppt) biofloc system, simultaneously measuring water quality, biofloc nutrition, growth, hematology, immunity, oxidative status, digestive function, and serum endocrinology across four stocking densities. The BFT system successfully maintained environmental stability across all tested densities, demonstrating the system’s technical resilience under intensive conditions. However, above 150 fish m–3, this environmental stability was not matched by physiological stability in the fish. The data reveal a coherent allostatic overload cascade at 250–300 fish m–3, in which sustained HPI-axis activation and elevated cortisol sequentially impaired growth signaling, immune function, antioxidant defense, hematological integrity, and digestive enzyme activity, while simultaneously imposing hepatorenal metabolic strain. These multi-system responses collectively demonstrate that 250 fish m–3 and above are not physiologically sustainable as long-term rearing densities for red tilapia in hypersaline BFT systems. A stocking density of 75–150 fish m–3 is recommended as the optimal operational range for hypersaline BFT-based red tilapia production, delivering superior individual growth performance, efficient feed utilization, physiological homeostasis across all measured response systems, and commercially viable individual weights within the 180 days cycle. Producers who prioritize total biomass output may consider 250 fish m–3 as an upper operational limit with intensive health monitoring, corrective nutritional intervention (e.g., immunostimulant or antioxidant supplementation), and acceptance of the associated welfare cost and extended time-to-market. Stocking densities exceeding 250 fish m–3 are not recommended under these production conditions.
Funding information
Author state that no funding information.
Author contributions
Conceptualization, G.R.S., M.F.E.B., and A.I.S.; Methodology, G.R.S., M.H., E.T., S.Y.E., W.M.F., M.F.E.B., and A.I.S.; Software, G.R.S., E.T., S.Y.E., M.F.E.B., and A.I.S.; Validation, G.R.S., M.H., E.T., and S.Y.E.; Formal analysis, G.R.S., A.M.H., M.H., S.Y.E., Y.J.H., and W.M.F.; Investigation, G.R.S., M.H., S.Y.E., W.M.F., M.F.E.B., and A.I.S.; Resources, G.R.S., M.H., S.Y.E., M.F.E.B., and A.I.S.; Data curation, G.R.S., A.M.H., M.H., S.Y.E., and Y.J.H.; Visualization, G.R.S., S.Y.E., W.M.F., M.F.E.B., and A.I.S.; Writing – original draft, M.F.E.B. and A.I.S.; Writing – review & editing, G.R.S., A.M.H., E.T., Y.J.H., M.F.E.B., and A.I.S.
Conflict of interest statement
The authors declare no conflict of interest.
Data availability statement
Data are available on request from the first author (Prof. Dr. Ghada R. Sallam: rashadgha@gmail.com).