
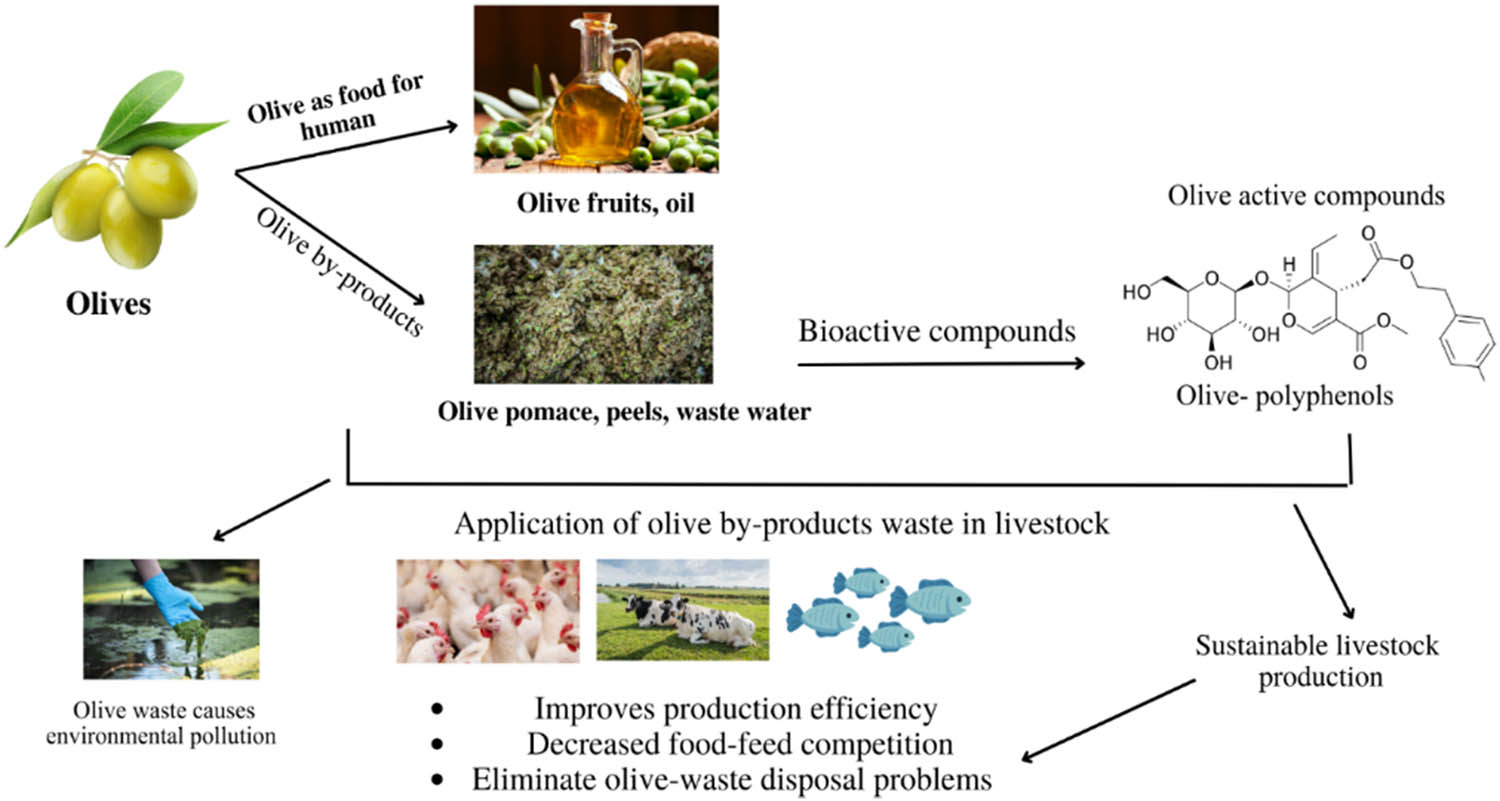
Figure 1
Schematic representation of the olive oil value chain highlighting the generation and potential utilization of olive oil industry by-products in livestock feeding systems.
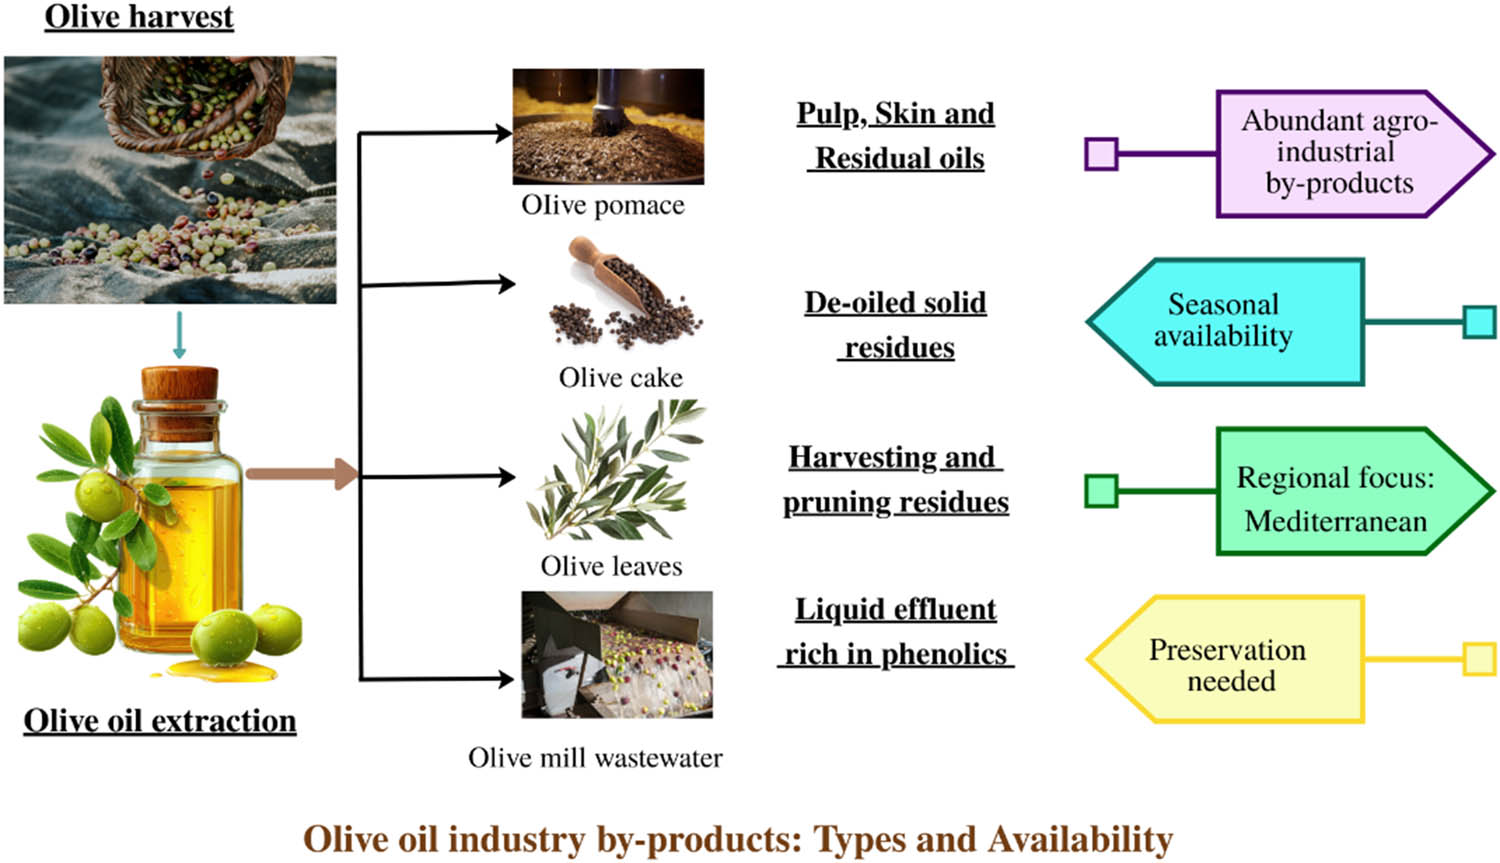
Figure 2
Schematic representation of the olive oil production process and the primary by-products produced, including OP, olive cake, olive leaves, and olive mill waste water.
Table 1
Chemical composition and energy-related characteristics of major olive oil industry by-products (DM basis)
| By-product | NDF (% DM) | CP (% DM) | Ether extract (% DM) | Ash (% DM) | Energy value* | References |
|---|---|---|---|---|---|---|
| OP | 45–65 | 6–10 | 6–15 | 5–8 | Moderate (due to residual oil) | Molina-Alcaide and Yáñez-Ruiz (2008); Abbeddou et al. (2011) |
| Olive cake (de-oiled) | 50–70 | 6–9 | <5 | 6–10 | Low–moderate | Bastante et al. (2019); Molina-Alcaide and Yáñez-Ruiz (2008) |
| Olive leaves | 40–55 | 8–12 | 2–5 | 7–12 | Low | Salem and Smith (2008); Martín-García et al. (2003) |
| OMWW† | — | — | — | High | — | El Ghadraoui et al. (2021); El-Kelawy and Refaie (2024) |
[i] *Energy value refers to relative metabolizable or net energy contribution depending on species and inclusion level. †OMWW is generally not used directly as a feed ingredient due to high moisture content and phenolic load, but may be considered after appropriate processing or as a source of bioactive compounds.
Source: Compiled from the references listed in the table.
Table 2
Species-specific utilization, digestibility, and indicative inclusion ranges of olive oil industry by-products in livestock diets
| Species | By-product | Digestibility characteristics (%) | Amino acid limitations | Typical inclusion (% DM) | Main constraints | References |
|---|---|---|---|---|---|---|
| Ruminants (cattle, sheep, goats) | OP | DM: 55–65; Olive meal (OM): 60–70; CP: 40–55 | Low essential amino acids (AA); microbial protein is primary AA source | 5–20 | High lignin; excessive fat at high levels | Molina-Alcaide and Yáñez-Ruiz (2008); Abbeddou et al. (2011) |
| Ruminants | Olive cake (de-oiled) | DM: 50–60; OM: 55–65; CP: 35–50 | Poor AA balance; low lysine | 5–15 | Low protein; high fiber | Alves et al. (2019); Molina-Alcaide and Yáñez-Ruiz (2008) |
| Ruminants | Olive leaves | DM: 45–55; OM: 50–60; CP: 30–45 | Moderate CP; low essential AA | ≤10 | Palatability; phenolics | Salem and Smith (2008); Martín-García et al. (2003) |
| Poultry | OP (processed) | DM: 35–45; Energy: 40–50 | Deficient in lysine and methionine | ≤5 | High fiber; low metabolizable energy (ME) | Zangeneh and Torki (2011); Gerasopoulos et al. (2015) |
| Swine | OP (low inclusion) | DM: 45–55; Energy: 50–60 | Low essential AA concentration | ≤5–8 | Fiber; palatability | Paiva-Martins et al. (2014); Tabera et al. (2004) |
| Fish | OP (extracts/low fiber forms) | DM: 40–55 | Limited AA contribution | ≤5 | Fiber; phenolics | Abasubong et al. (2024); Gunathilaka et al. (2020) |
Digestibility values represent estimated ranges affected by the processing methods, inclusion levels, and overall diet composition. Energy values are expressed as metabolizable or net energy depending on the species.
Note: Values represent indicative ranges compiled from multiple peer-reviewed studies rather than standardized experimental conditions and may vary depending on by-product type, processing conditions, and animal species.
Source: Compiled from the references listed in the table.
Table 3
Major phenolic compounds, functional properties, and nutritional implications of olive oil industry by-products
| By-product | Main phenolic compounds | Total phenolic level | Functional properties | Nutritional/feeding implications | References |
|---|---|---|---|---|---|
| OMWW | Hydroxytyrosol, tyrosol, oleuropein derivatives, oleacin, verbascoside, caffeic acid, gallic acid, luteolin, rutin | Very high (0.5–24 g/L) | Strong antioxidant and antimicrobial activity (primarily demonstrated in vitro), phytotoxic at higher concentrations | Not suitable for direct feeding; may serve as a source of phenolic extracts after appropriate treatment | Fabbri et al. (2004); Barbera et al. (2013); Cittan and Çelik (2018) |
| Olive leaves | Oleuropein (dominant), hydroxytyrosol, verbascoside, flavonoids | High | Antioxidant and antimicrobial potential; effects depend on dose and processing, antiparasitic | Limited inclusion in diet due to palatability constraints and possible negative effect on protein digestibility at higher levels | Ben Salem et al. (2015); Şahin and Bilgin (2018); Difonzo et al. (2017) |
| OP | Hydroxytyrosol, comselogoside (∼80%), tyrosol | Moderate–high | Antioxidant and antibacterial potential, antifungal, anticoccidial | May be used as a supplementary feed ingredient at controlled inclusion levels; digestibility may be limited by lignin and phenolic content | Nunes et al. (2018); Malapert et al. (2018); Debbou-Iouknane et al. (2019) |
Source: Compiled from the references listed in the table.
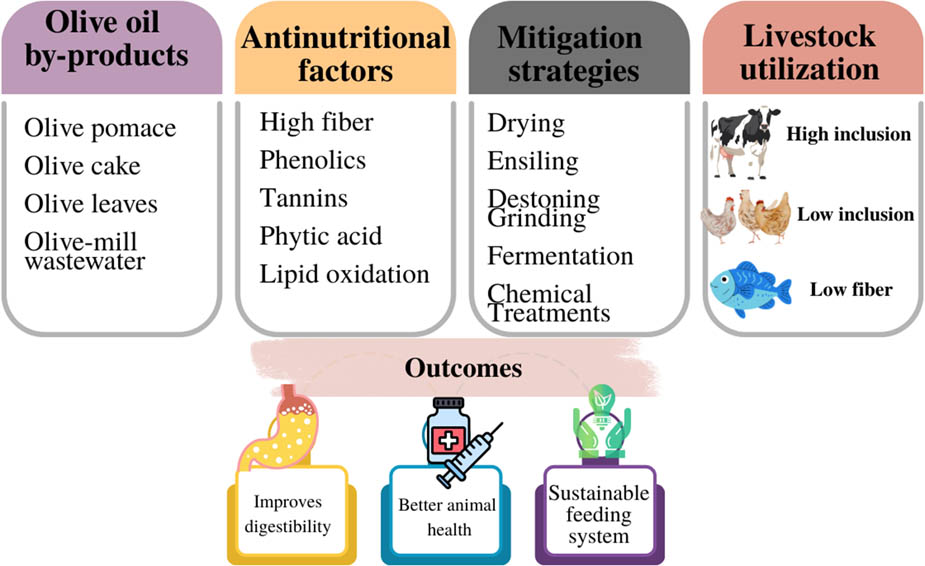
Figure 3
Schematic representation of olive oil industry by-products, their main ANFs, and corresponding mitigation strategies in livestock feeding systems.
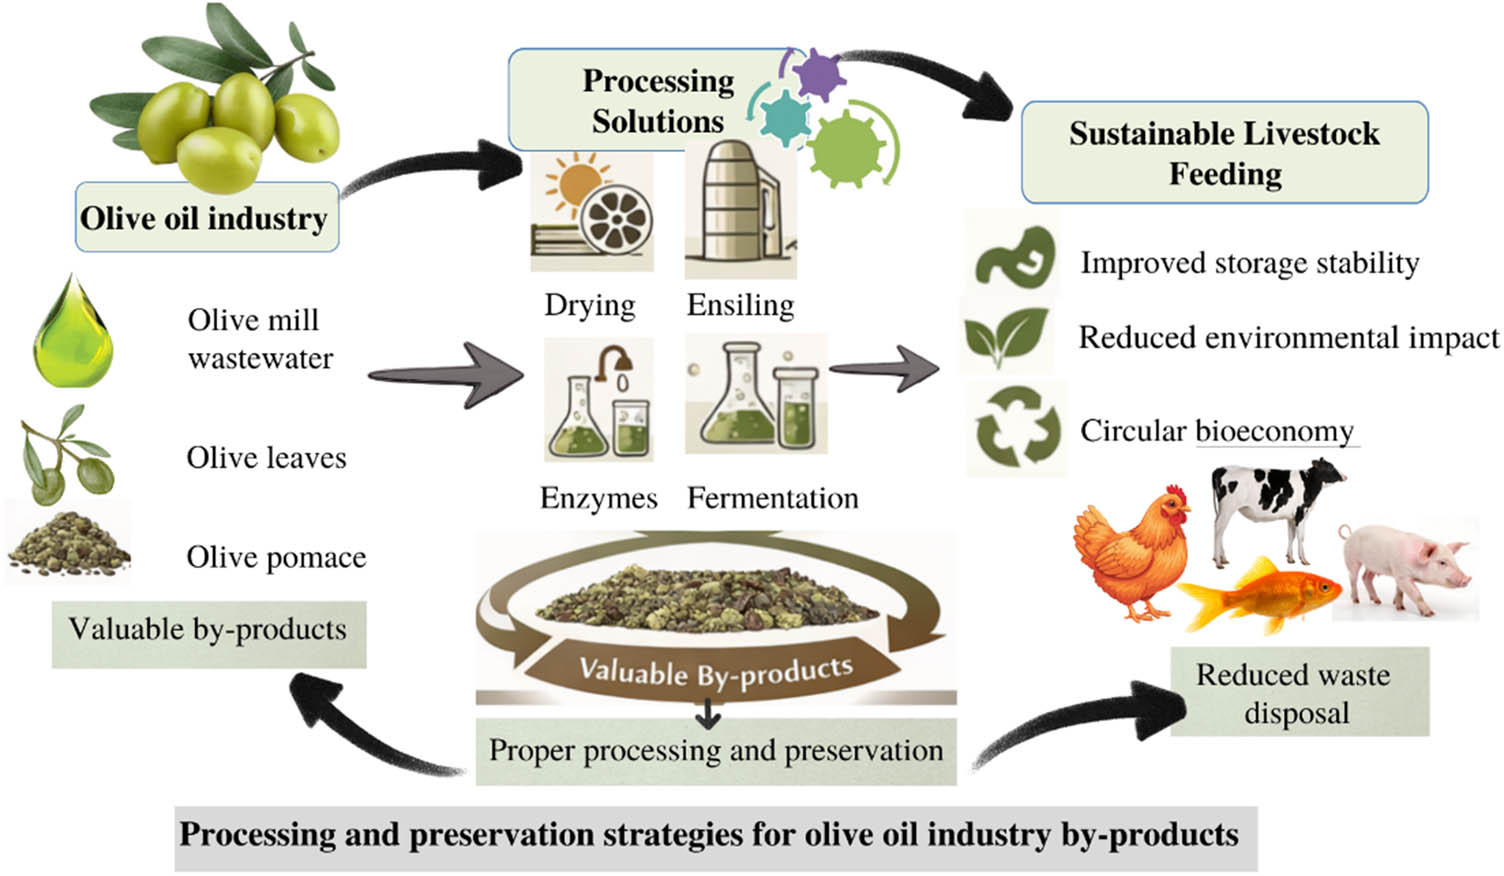
Figure 4
Schematic overview of processing and preservation methods utilized for olive oil industry by-products and their implications for livestock nutrition.
Table 4
Effects of processing and preservation methods on the feeding value of olive oil industry by-products
| Processing method | Main effect on by-products | Nutritional impact | Most suitable species | Key remarks | References |
|---|---|---|---|---|---|
| Drying (sun/forced air) | Moisture reduction, improved shelf life | Stabilizes nutrients; excessive heat may reduce phenolics | Ruminants, poultry, swine | Widely used; cost-effective | Al-Harthi (2016); Sayehban et al. (2016) |
| Ensiling | Fermentation, pH reduction | Improves palatability; partial reduction in phenolics | Ruminants | Requires fermentable carbohydrates | Nefzaoui and Vanbelle (1986); Molina-Alcaide and Yáñez-Ruiz (2008) |
| Grinding | Particle size reduction | Improves rumen microbial access; may reduce fiber effectiveness if excessive | Ruminants | Use moderate particle size | García et al. (2003); Macedo Júnior et al. (2007) |
| Pelleting | Increased bulk density, uniform feed | Improves intake and handling | All species | Heat may affect heat-sensitive compounds | Abd El-Moneim and Sabic (2019) |
| Alkaline treatment | Lignocellulose disruption | Improves fiber digestibility | Ruminants | Limited by safety and cost | Al Jassim et al. (1997); Abdullah et al. (2017) |
| Enzymatic treatment | Fiber and protein matrix degradation | Improves nutrient availability | Ruminants, monogastrics | Variable response | Hsu et al. (2013); Choct (2015) |
| Microbial fermentation | Phenolic modification | Reduces anti-nutritional effects | Ruminants | Still experimental | Aguilera et al. (1986); Chebaibi et al. (2019) |
| Phenolic extraction | Removal of bioactive compounds | Reduces phytotoxicity; lowers functional benefits | Indirect use | Residues require re-evaluation | Al-Harthi (2016); Sayehban et al. (2016) |
Source: Compiled from the references listed in the table.
Table 5
Effects of olive oil industry by-products on intake, growth performance, and milk yield in ruminants
| By-product | Species | Inclusion level (% of diet DM) | Performance response | Product quality effects | References |
|---|---|---|---|---|---|
| OP | Lambs | 5–20 | Average daily gain (ADG): 150–280 g/day | Improved meat FA profile | Molina-Alcaide and Yáñez-Ruiz (2008); Amato et al. (2024) |
| OP | Beef cattle | 5–15 | ADG: 0.8–1.2 kg/day | Increased MUFA content | Molina Alcaide and Yáñez-Ruiz (2008) |
| OP | Dairy cows | 10–15 | Milk yield: 18–30 kg/day | Higher oleic acid, improved oxidative stability | Lo Giudice et al. (2021) |
| OP | Dairy sheep/goats | 5–15 | Milk yield: 1.2–2.5 kg/day | Improved milk FA profile | Amato et al. (2024) |
| Olive cake (de-oiled) | Lambs | 5–15 | ADG: 120–250 g/day | Neutral | Lo Giudice et al. (2021) |
| Olive leaves | Sheep/goats | ≤10 | ADG: 100–200 g/day | Stable milk yield | Neofytou et al. (2023); Salem and Smith (2008) |
Note: Inclusion levels are expressed on a dietary DM basis. Values are compiled from multiple peer-reviewed studies and may vary depending on by-product characteristics, processing conditions, diet formulation, and animal production stage.
Source: Compiled from the references listed in the table.
Table 6
Inclusion levels, performance responses, and limitations of olive oil industry by-products in poultry nutrition
| By-product | Poultry class | Inclusion level (% diet) | Performance response | Product quality/health effects | Main limitations | References |
|---|---|---|---|---|---|---|
| OP (raw/dried) | Broilers | ≤5 | Neutral to slightly ↓ ADG at higher levels | ↑ Antioxidant status; ↓ meat lipid oxidation; anticoccidial effects; improved gut health markers | High fiber reduced digestibility; low ME; AA imbalance (Lys, Met); palatability | Zangeneh and Torki (2011); Debbou-Iouknane et al. (2019); Sayehban et al. (2016) |
| OP (processed) | Broilers | 2–5 | No adverse effects on ADG or FCR | ↑ Immune response; ↓ lipid oxidation | Processing required | Herrero-Encinas et al. (2020); Ferlisi et al. (2023) |
| Olive cake meal | Broilers | 3–6 | Maintained growth performance and intake | ↑ meat oxidative stability; ↑ vitamin E content | High NSP and lignin content | Abd El-Moneim and Sabic (2019); Alderey et al. (2023); Saleh and Alzawqari (2021) |
| Olive leaves (powder/extracts) | Broilers | ≤2 | No negative effects on performance | ↑ antioxidant and immune markers | Palatability and phenolics at high levels | Mumcu (2023); Šimat et al. (2022) |
| Olive oil | Broilers | 2–5 | No negative effects on performance | ↓ blood TG; ↑ HDL; ↓ SFA, ↑ UFA in meat | Energy density management; cost; oxidation risk | Papadopoulos et al. (2023); Yendou-Gname et al. (2024) |
| Dried olive pulp | Layers | 5–6 | No adverse effects on egg production | ↑ PUFA; ↓ SFA; improved yolk color | Fiber dilution; ME dilution | Dedousi et al. (2022); Corrales et al. (2023) |
| Olive oil | Layers | 2–5 | Stable laying rate | ↑ yolk PUFA; ↓ cholesterol; ↑ shell quality; ↑ yolk color | Cost; energy balance | Corrales et al. (2023); Cheng et al. (2023) |
| OM | Broilers | ≤9 | No negative effect on growth | ↓ Yolk cholesterol; ↑ fiber intake | High fiber; NSP | Zangeneh and Torki (2011); Ranalli et al. (2002) |
Abbreviations: ADG, average daily gain; FCR, feed conversion ratio; ME, metabolizable energy; AA, amino acids; SFA, saturated fatty acids; UFA, unsaturated fatty acids; TG, triglycerides.
Source: Compiled from the references listed in the table.
Table 7
Inclusion levels, performance responses, and limitations of olive oil industry by-products in swine nutrition
| By-product | Production stage | Inclusion level (% diet) | Performance response | Product quality/health effects | Main limitations | Key references |
|---|---|---|---|---|---|---|
| Olive leaves | Growers | 5–10 | ↓ ADG and feed efficiency at higher inclusion levels | ↑ α-tocopherol concentration in muscle and backfat; improved oxidative stability | High fiber content; reduced palatability | Paiva-Martins et al. (2009, 2014) |
| Olive leaves | Fatteners (extensive systems) | ≤5 | Slight reduction in growth performance | Improved meat oxidative stability without changes in FA profile | Fiber; intake limitation | Paiva-Martins et al. (2009) |
| Partially defatted olive cake | Fatteners | ∼12 (120 g/kg) | No significant effect on ADG, ADFI, FCR | ↑ MUFA content in subcutaneous fat; neutral effect on gut microbiota | Fiber content; dilution of ME | Ferrer et al. (2020); Liotta et al. (2019) |
| Dried olive pulp | Fatteners | ∼5 | No negative effect on carcass traits or meat tenderness | ↓ lipid oxidation during early storage; slight changes in meat color (yellowness) | Color changes at higher inclusion (yellowness) | Tsala et al. (2020) |
| Olive pulp | Gestating sows | ∼10 (100 g/kg) | No effect on BW, backfat thickness, or litter performance | ↑ serum antioxidant status; ↑ beneficial fecal microbes (Lactobacillus, Bifidobacterium spp.) | Excess fiber if inclusion is increased | Sánchez et al. (2022) |
Abbreviations: ADG, average daily gain; ADFI, average daily feed intake; FCR, feed conversion ratio; MUFA, monounsaturated fatty acids; BW, body weight.
Source: Compiled from the references listed in the table.
Table 8
Use of olive oil industry by-products and derived extracts in aquaculture: inclusion levels, functional effects, and limitations
| Olive by-product | Fish species (examples) | Inclusion level (% diet) | Main effects on performance | Functional/health effects | Key limitations | Key references |
|---|---|---|---|---|---|---|
| OP (processed/dried) | Gilthead seabream (Sparus aurata), European seabass (Dicentrarchus labrax) | ≤5 | No adverse effects on growth or FCR at low levels | ↑ antioxidant status; ↑ flesh oxidative stability | High fiber; low digestible energy | Abasubong et al. (2024); Gunathilaka et al. (2020) |
| OP extracts | European seabass (D. labrax) | ≤1 (extract) | Neutral growth performance | ↑ immune response; ↓ lipid peroxidation | Cost of extraction; standardization | Abasubong et al. (2024) |
| Olive oil | Nile tilapia (Oreochromis niloticus), seabream | 2–5 | Maintained growth and survival | Modifies fillet FA profile; ↑ MUFA | Excess replacement may ↓ n–3 LC-PUFA | Abasubong et al. (2024); Abasubong et al. (2024) |
| Olive leaf extracts | Nile tilapia (O. niloticus), carp | ≤1 | No negative effect on growth | ↑ antioxidant enzymes; ↑ disease resistance | Phenolics at high doses | Ghanbari et al. (2012); Leskovec et al. (2018) |
| OMWW extracts | Seabass, tilapia | ≤0.5 (extract) | Neutral growth | ↑antibacterial and antioxidative effects | Toxicity if unprocessed or at high doses | Fabbri et al. (2004); Ventura et al. (2019) |
Abbreviations: FCR, feed conversion ratio; FA, fatty acids; MUFA, monounsaturated fatty acids; LC-PUFA, long-chain polyunsaturated fatty acids. Extract-based interventions represent concentrated bioactive fractions and are not directly comparable to raw by-products in terms of nutritional value, inclusion levels, or practical application in feed formulation.
Source: Compiled from the references listed in the table.
Table 9
Integrative synthesis of cross-cutting benefits, limitations, and practical implications of olive oil industry by-products in livestock production systems
| Aspect | Benefits | Limitations | Key implications | References |
|---|---|---|---|---|
| Economic value | Reduces feed costs by replacing part of conventional ingredients; adds value to agro-industrial waste | Additional costs for drying, processing, and transport | Economic feasibility depends on local availability and processing scale | Molina-Alcaide and Yáñez-Ruiz (2008); Galanakis (2012); Gullón et al. (2020) |
| Environmental impact | Supports circular economy; reduces waste disposal and environmental pollution | High moisture and organic load require proper handling | Sustainable only with appropriate preservation strategies | Paraskeva and Diamadopoulos (2006); Barbera et al. (2013); Crippa et al. (2021) |
| Nutritional contribution | Contributes residual lipids, fiber, minerals, and bioactive compounds | Low digestible protein; imbalanced amino acid profile | Best used as complementary rather than primary feed ingredients | Abbeddou et al. (2011); Molina-Alcaide and Yáñez-Ruiz (2008) |
| Bioactive compounds | Rich in polyphenols with antioxidant, antimicrobial, and immunomodulatory effects | High phenolic levels may reduce palatability and nutrient digestibility | Inclusion level and processing are critical | Cioffi et al. (2010); Leskovec et al. (2018); Herrero-Encinas et al. (2020) |
| Fiber content | Structural carbohydrates beneficial in ruminant diets | High NSP, lignin, and tannins limit use in monogastrics and fish | Species-specific inclusion strategies required | García et al. (2003); Jiménez-Moreno et al. (2011) |
| Lipid fraction | Improves FA profile and oxidative stability of animal products | Susceptible to lipid oxidation during storage | Requires dehydration, antioxidants, and proper storage | Terramoccia et al. (2013); Kumar et al. (2016) |
| Processing requirements | Drying, ensiling, and treatments can enhance feed value | Processing increases cost and may reduce heat-sensitive compounds | Optimization needed to balance quality and economics | Sayehban et al. (2016); Molina-Alcaide and Yáñez-Ruiz (2008) |
| Product quality | Improves meat, milk, egg, and fish fillet quality and shelf life | Excess inclusion may impair performance | Functional benefits achieved at low to moderate inclusion levels | Tufarelli et al. (2013); Tsala et al. (2020); Dedousi et al. (2022) |
| Consistency of composition | Utilizes diverse olive residues | High variability due to cultivar, climate, and processing | Routine chemical characterization is necessary | Nunes et al. (2016); Malekjani and Jafari (2023) |
Source: Compiled from the references listed in the table.