
Table 1
Nutritional value of commercial pellets and high-fat diet
| Nutritional value | Commercial pellet | High-fat diet | ||
|---|---|---|---|---|
| g/kg of diet | kcal (%) | g/kg of diet | kcal (%) | |
| Fat | 30 | 7.8 | 346 | 57.8 |
| Protein | 220 | 25.4 | 160 | 11.9 |
| Carbohydrate | 580 | 66.8 | 408 | 30.3 |
| Total ash | 57 | — | 36 | — |
| Moisture | 113 | — | 50 | — |
| Energy (kcal/g) | ∼3.47 | ∼5.39 | ||
Table 2
Body weight progression, food consumption, and energy intake in all experimental groups
| Parameters | Groups | |||
|---|---|---|---|---|
| NOR | OB | OB + AB-Kefir | ||
| Body weight (g) | Week 0 | 159.4 ± 4.8 | 168.4 ± 5.1 | 160.3 ± 7.5 |
| Week 14 | 409.9 ± 10.7 | 498.0 ± 20.6a | 492.4 ± 20.0a | |
| Week 22 | 466.0 ± 15.7 | 596.6 ± 27.3a | 483.8 ± 16.9b | |
| Food intake | Total (g) | 3179.0 ± 92.7 | 2612.0 ± 106.9a | 2483.0 ± 80.6a |
| Mean (g/week) | 144.5 ± 3.6 | 118.7 ± 2.2a | 112.9 ± 1.7a | |
| Energy intake | Total (kcal) | 11030.0 ± 321.6 | 14078.0 ± 576.4a | 13383.0 ± 434.3a |
| Mean (kcal/week) | 501.4 ± 12.3 | 639.9 ± 11.9a | 608.3 ± 9.3a | |
Week 0 (before obesity induction), week 14 (after obesity induction), week 22 (final week of experiment). Data presented as mean ± SEM (n = 8). Body weight was analysed using two-way repeated-measures ANOVA followed by Sidak’s multiple comparisons test. Food intake and energy intake were analysed using one-way ANOVA followed by Tukey’s multiple comparisons test.
Table 3
Fasting lipid profile in all experimental rat groups
| Parameters | NOR | OB | OB + AB-Kefir |
|---|---|---|---|
| TC (mg/dL) | 65.00 ± 3.32 | 74.50 ± 1.71a | 61.83 ± 1.58b |
| TG (mg/dL) | 80.43 ± 8.76 | 125.60 ± 23.17 | 67.29 ± 8.88b |
| HDL (mg/dL) | 35.74 ± 3.27 | 13.27 ± 4.08a | 26.44 ± 1.16b |
| LDL (mg/dL) | 19.60 ± 1.50 | 30.50 ± 1.85a | 23.50 ± 1.23b |
| AI (log TG/HDL) | 0.37 ± 0.10 | 0.75 ± 0.11a | 0.36 ± 0.10b |
Data presented as mean ± SEM (n = 8). Statistical differences were analysed using one-way ANOVA followed by Tukey post hoc test.
a P < 0.05, indicated a significant difference compared to normal.
b P < 0.05, indicated a significant difference compared to the obese.
TC, total cholesterol; TG, triglyceride; HDL, high-density lipoprotein; LDL, low-density lipoprotein; AI, atherogenic index; NOR, normal control; OB, untreated obese; OB + AB-Kefir, obese treated with AB-Kefir.
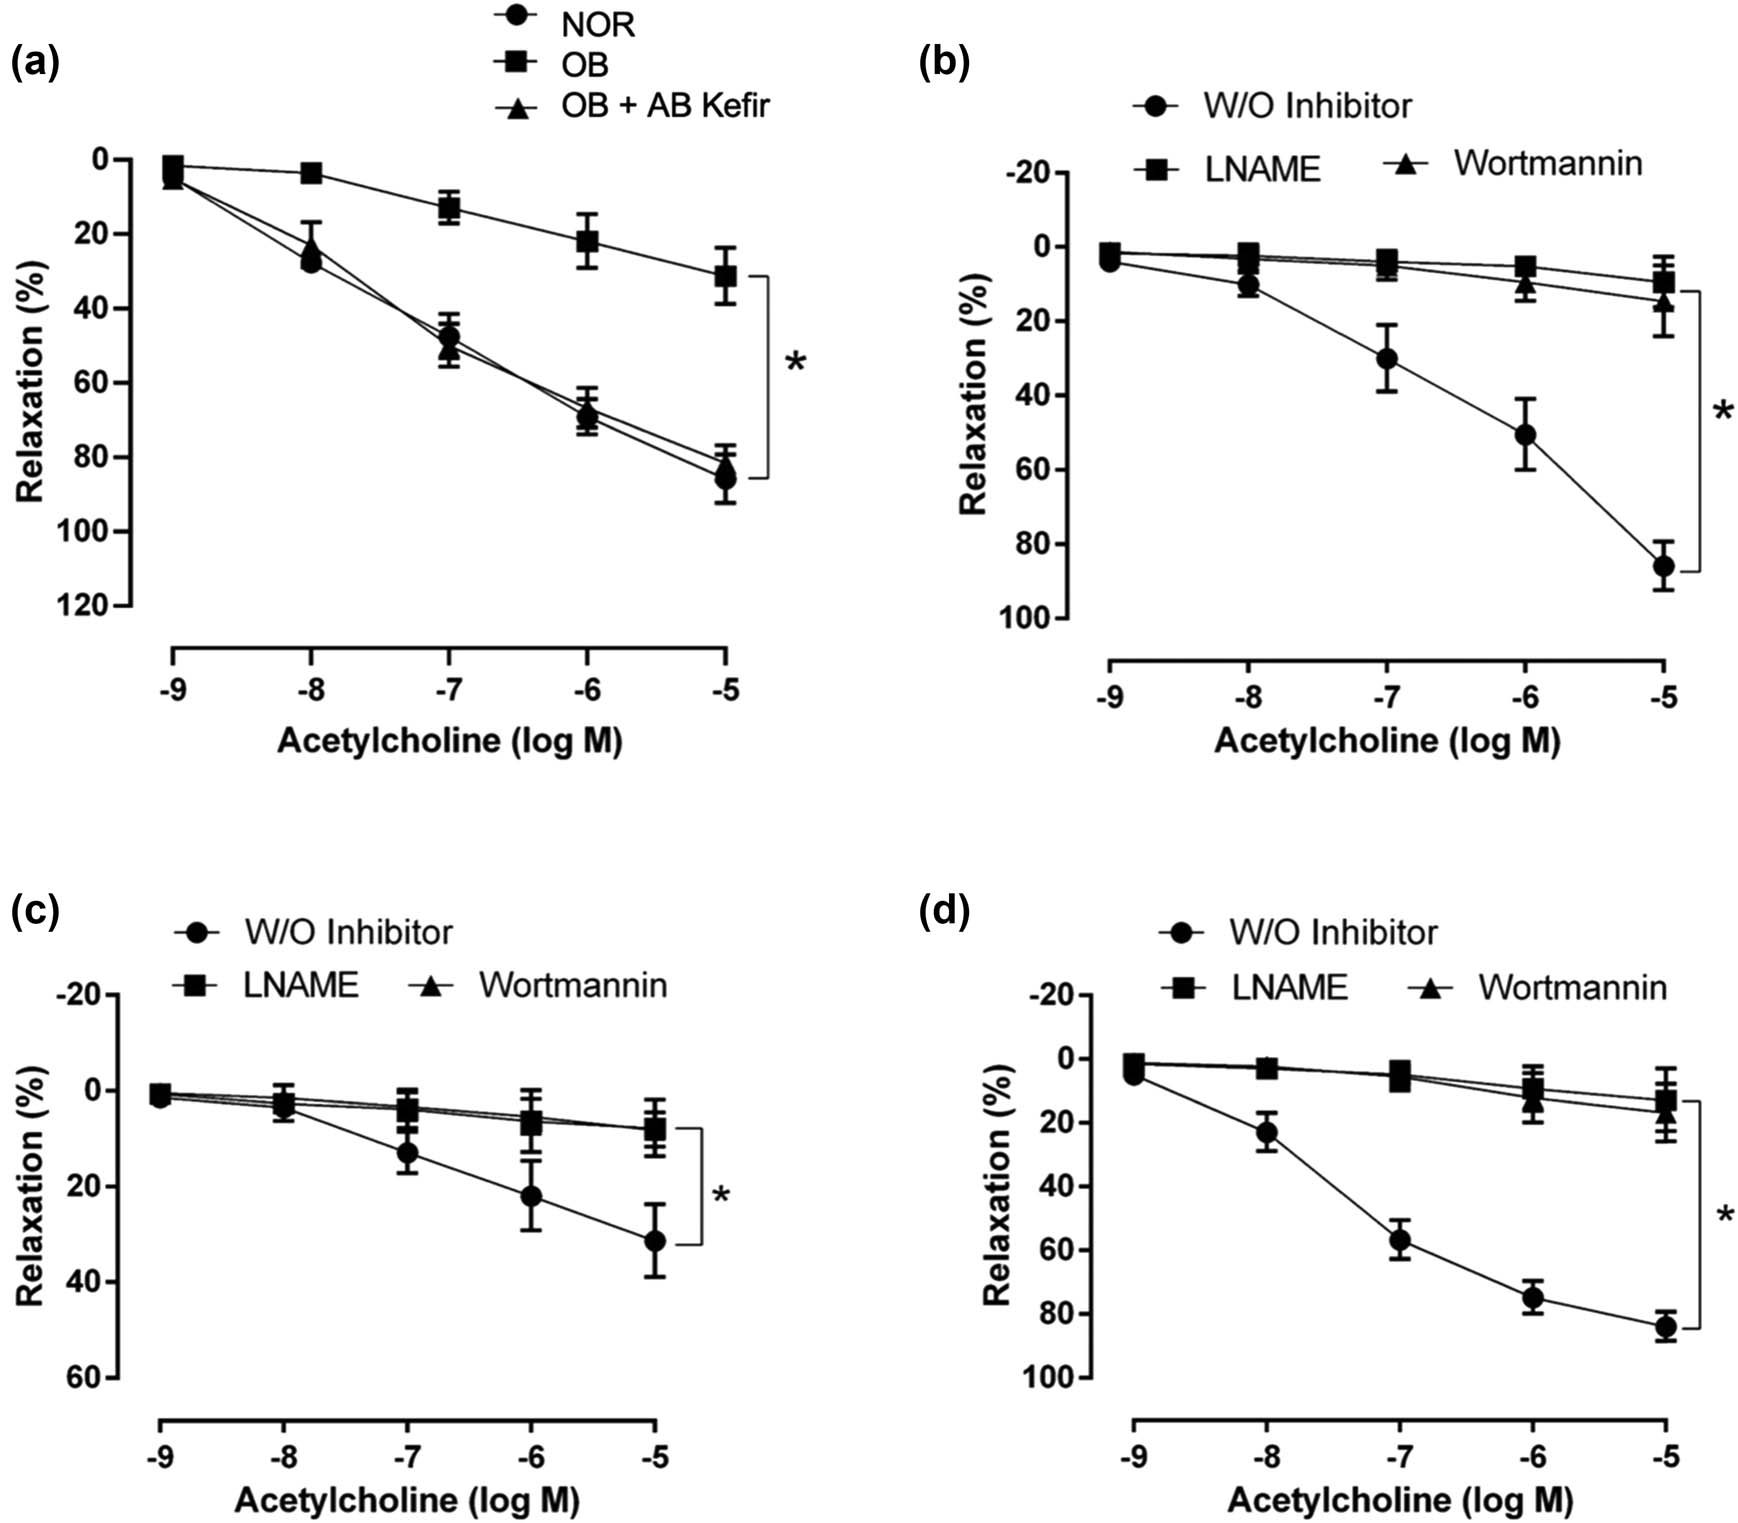
Figure 1
Aortic tissue relaxation responses to acetylcholine (1 nM to 0.1 µM) in all experimental rats without and with blockers. (a) Response in the three groups in the absence of pharmacological blockers. (b) Relaxation responses to acetylcholine without and with blockers in the normal group. (c) Relaxation responses to acetylcholine without and with blockers in the obese group. (d) Relaxation responses to acetylcholine without and with blockers in the OB + AB-Kefir group.
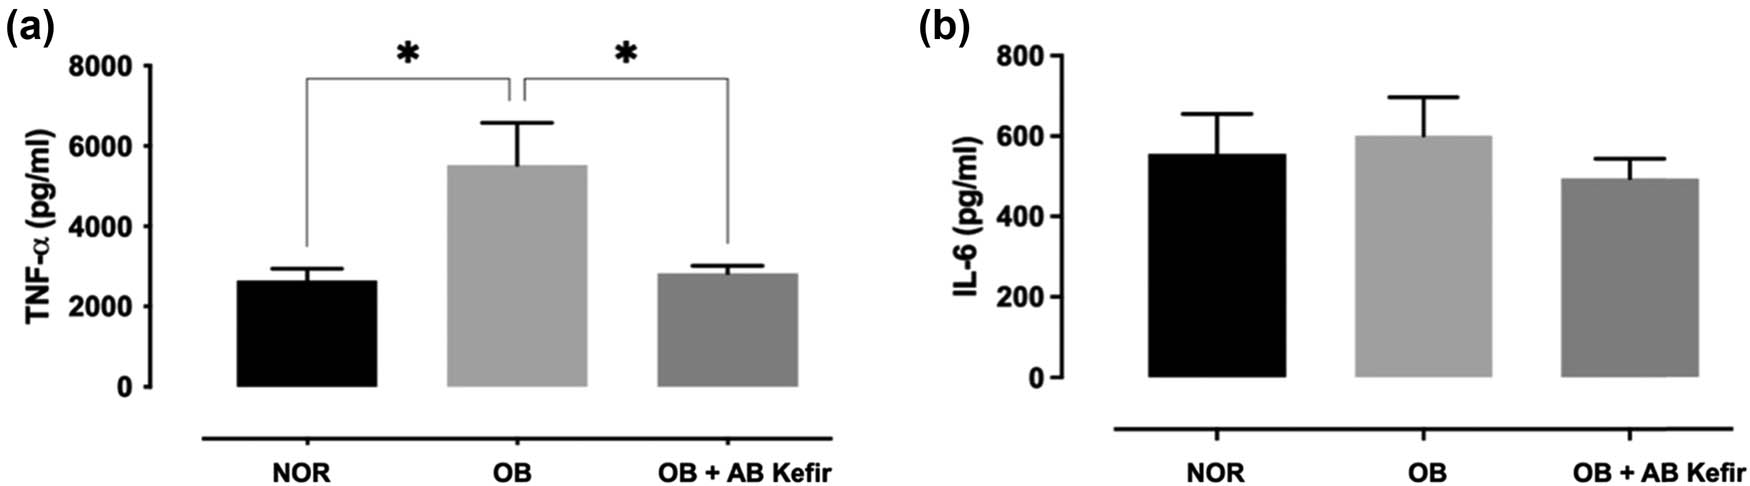
Figure 2
Level of inflammatory markers TNF-α (a) and IL-6 (b) in the thoracic aorta of experimental rats.
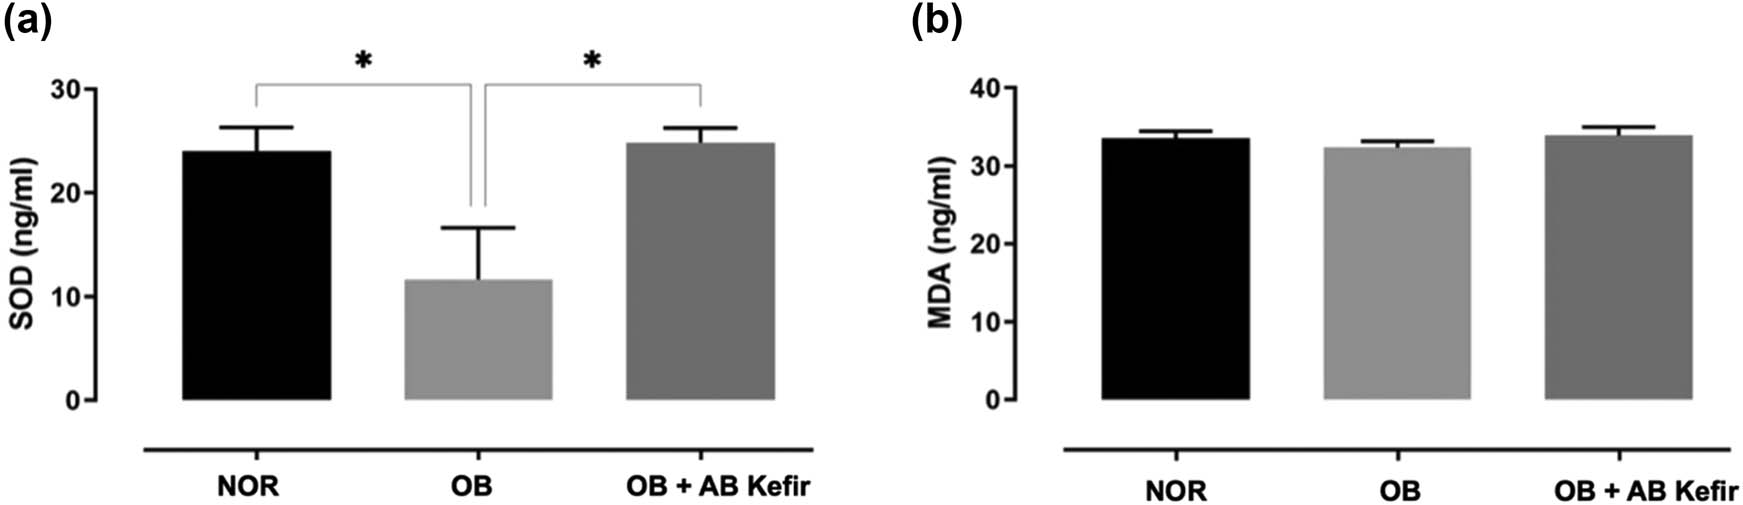
Figure 3
Oxidative stress markers SOD (a) and MDA (b) in the thoracic aorta of experimental rats.