
Figure 1.
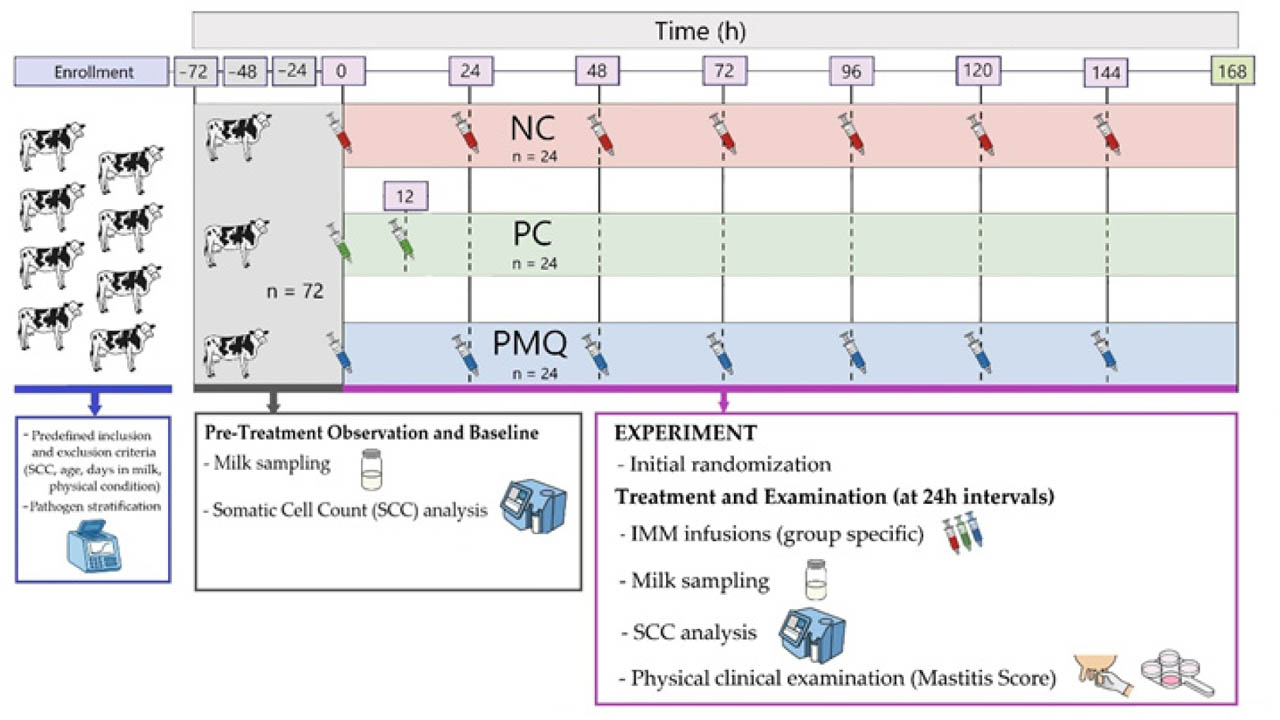
Experimental schedule. Seventy-two multiparous Holstein-Friesian cows with naturally occurring clinical mastitis (n = 72) meeting predefined inclusion criteria after pathogen stratification were enrolled to the study. Following a 72-hour pre-treatment observation period with baseline measurements of milk SCC (−72 h, − 48 h, − 24 h), cows were randomized into three treatment groups (n=24 per group): NC (negative control, BPS administered at 24-hour intervals from 0 h through 144 h), PC (positive control, antibiotic administered at 0 h and 12 h), and PMQ (pectin + morin + quercetin administered at 24-hour intervals from 0 h through 144 h). Milk samples were collected and SCC analysis performed at 24-hour intervals from 0 h through 168 h, corresponding to 24 h after the final PMQ or PBS administration. Physical clinical examinations and mastitis severity scoring were conducted at each sampling time point. Syringe icons indicate treatment administration time points (group specific).
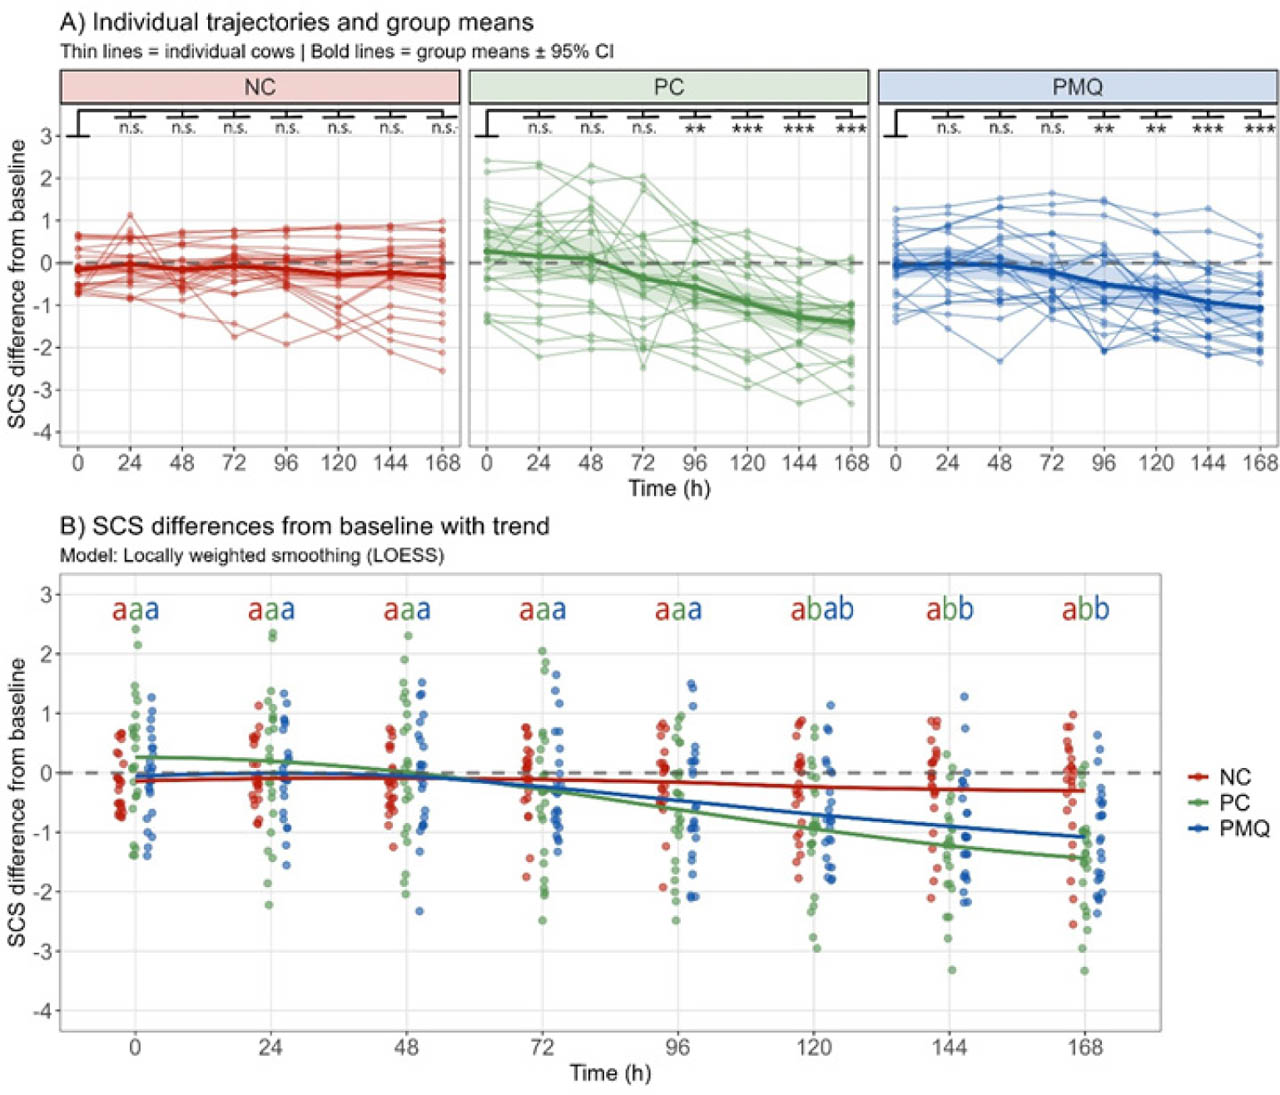
Figure 2.
Somatic cell score (SCS) dynamics during treatment period. (A) Individual cow trajectories (thin lines) and group means (bold lines) with 95% confidence intervals (shaded ribbons) showing SCS differences from global pre-treatment baseline. Significance levels for within-group comparisons to baseline are indicated above each panel (n.s. = not significant, ** P<0.01, *** P< .001; LMM for repeated measures with FDR adjustment for multiple comparison). (B) SCS differences from baseline with locally weighted smoothing (LOESS) trend lines. Points represent individual observations. Letters above time points indicate between-group comparisons; groups sharing the same letter do not differ significantly (P>0.05; LMM for repeated measures with FDR adjustment for multiple comparison). NC = negative control (PBS), PC = positive control (antibiotic), PMQ = pectin + morin + quercetin.
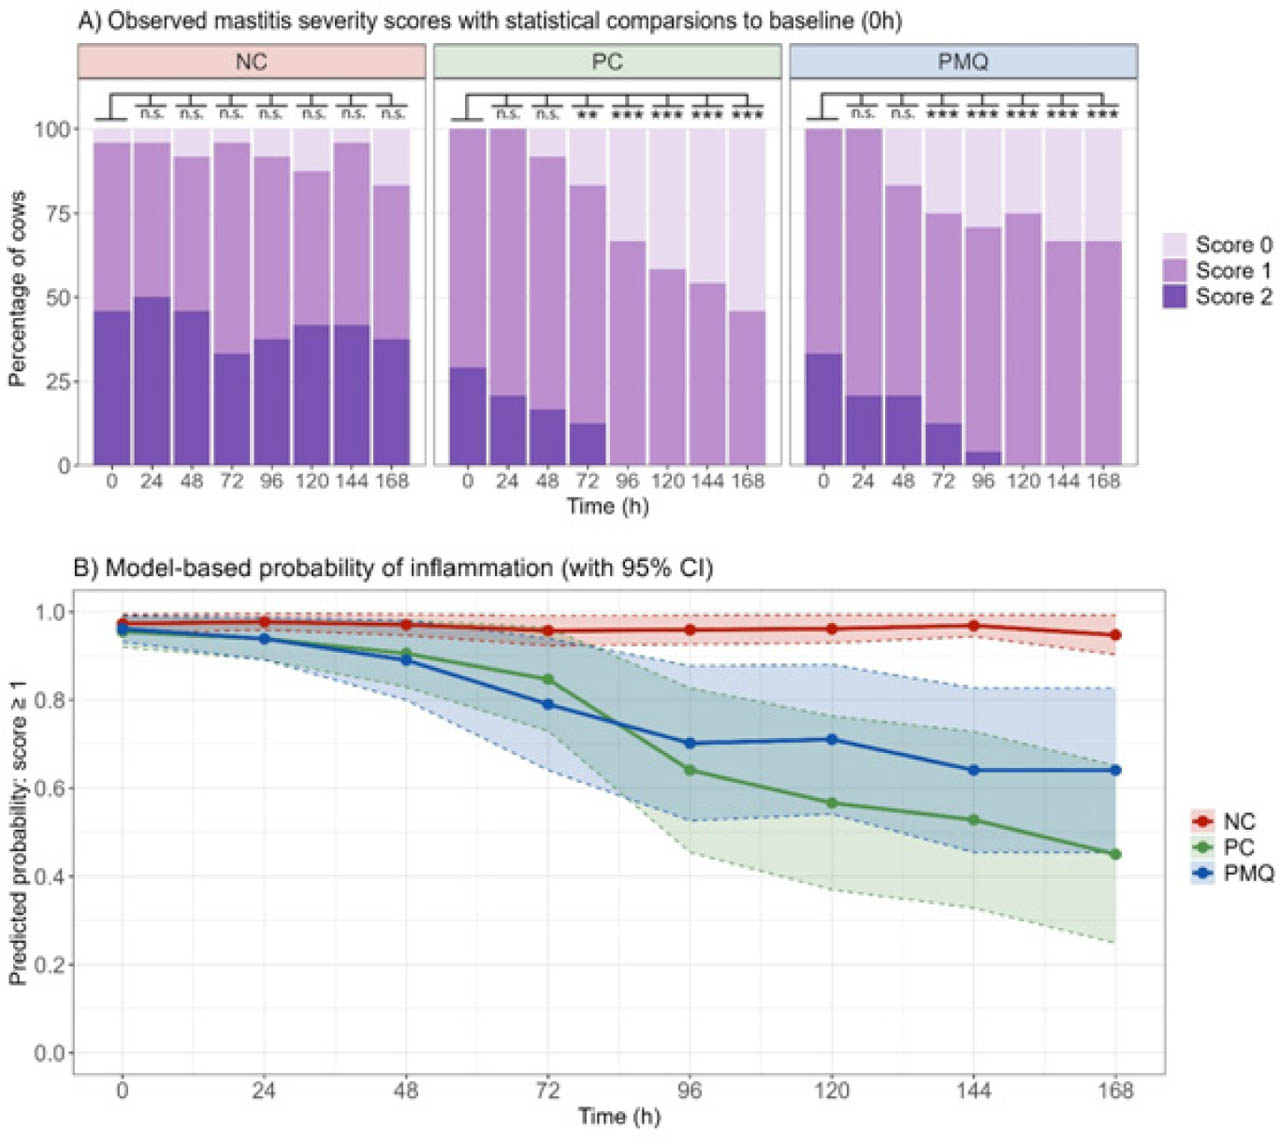
Figure 3.
Temporal dynamics of mastitis severity and treatment response. (A) Observed distribution of mastitis scores (0 = none, 1 = moderate, 2 = severe) displayed as percentage of cows in each treatment group over the 168-hour observation period. Asterisks indicate significant within-group differences from baseline (0 h) based on post-hoc comparisons (*P<0.05, **P<0.01, ***P<0.001; n.s. = not significant; CLMM for repeated measures with FDR adjustment for multiple comparison). (B) Model-predicted probability of inflammation (mastitis score ≥ 1) from CLMM model. Solid lines represent population-averaged predictions, shaded ribbons indicate model 95% confidence intervals. NC = negative control (PBS), PC = positive control (antibiotic), PMQ = pectin + morin + quercetin.