
Table 1.
Total motility and kinetic parameters of sperm (mean ± SE) of native Polish Crested chickens and Hy-Line Brown roosters (n= 6/genetic group; number of ejaculate 30/storage time) in relation to short-term storage
| Characteristic | Item | MOT (%) | VCL (µm/s) | VSL (µm/s) | VAP (µm/s) | LIN (%) | STR (%) | WOB (%) | ALH (µm) |
|---|---|---|---|---|---|---|---|---|---|
| PCr | 0 h | 93.9±1.3 c | 53.9±2.5 b | 27.1±1.7 b | 37.3±1.9 bd | 51.9±2.4 a | 71.5±1.9 a | 74.7±1.7 ab | 2.4±0.1 b |
| 24 h | 83.6±1.9 b | 39.9±1.2 a | 21.7±0.5 a | 28.8±0.7 ae | 54.3±1.9 a | 73.3±1.5 a | 76.5±1.2 bc | 1.8±0.1 a | |
| 48 h | 71.4±2.7 a | 36.8±1.0 a | 19.5±0.5 a | 25.9±0.7 a | 48.3±2.5 a | 68.6±1.9 a | 70.4±2.1 a | 1.7±0.1 a | |
| HLB | 0 h | 92.5±1.4 c | 51.4±2.1 b | 25.9±0.9 b | 35.7±1.3 cd | 52.1±2.1 a | 71.4±1.6 a | 74.5±1.5 a | 2.3±0.1 b |
| 24 h | 84.5±2.2 b | 39.9±1.7 a | 22.2±0.6 a | 29.0±1.0 be | 51.8±1.6 a | 73.5±1.9 a | 75.8±1.8 ac | 1.8±0.1 a | |
| 48 h | 65.2±2.8 a | 36.3±1.1 a | 19.2±0.5 a | 24.9±0.7 a | 47.5±2.2 a | 67.5±1.6 a | 68.1±1.6 a | 1.6±0.1 a | |
| Genetic group (G) | PCr | 82.9±1.5 a | 43.6±1.7 a | 22.7±0.7 a | 30.7±0.9 a | 51.5±1.4 a | 71.1±1.1 a | 73.9±1.0 a | 2.0±0.1 a |
| HLB | 79.7±1.7 a | 42.6±1.6 a | 22.4±0.5 a | 29.9±0.8 a | 50.5±1.2 a | 70.8±1.0 a | 72.8±0.1 a | 1.9±0.1 a | |
| Storage time (S) | 0 h | 93.2±0.9 c | 52.6±1.6 b | 26.5±0.9 c | 36.5±1.2 c | 52.0±1.6 a | 71.4±1.3 ab | 74.6±1.1 b | 2.3±0.1 b |
| 24 h | 82.5±1.5 b | 39.9±1.1 a | 21.9±0.4 b | 28.9±0.6 b | 53.0±1.2 a | 73.4±1.2 b | 76.2±1.1 b | 1.8±1.1 a | |
| 48 h | 68.3±2.0 a | 36.6±0.7 a | 19.3±0.4 a | 25.4±0.5 a | 47.9±1.6 a | 68.0±1.3 a | 69.3±1.3 a | 1.7±0.0 a | |
| P-value | |||||||||
| G | 0.1323 | 0.5040 | 0.5606 | 0.3903 | 0.5308 | 0.7672 | 0.4814 | 0.7487 | |
| S | <0.0001 | <0.0001 | <0.0001 | <0.0001 | 0.0625 | 0.0197 | 0.0027 | <0.0001 | |
| G × S | 0.3580 | 0.6914 | 0.6292 | 0.7060 | 0.8285 | 0.9241 | 0.8503 | 0.9903 | |
[i] a, b, c, d, e – values in the same column with different letters differ significantly P<0.05 – PCr vs HLB storage time point; genetic group; storage time.
[ii] Abbreviations: MOT – total motility; VCL – curvilinear velocity; VSL – straight-line velocity; VAP – average path velocity; LIN – linearity (LIN=VSL/VCL × 100); STR – straightness (STR=VSL/VAP × 100); WOB – path wobble (WOB=VAP/VCL × 100); ALH – amplitude of lateral head displacement; Sperm motility parameters were assessed by CASA system; PCr – Polish Crested chickens; HLB – Hy-Line Brown; G – genetic group; S – storage; G × S – interaction genetic group × storage.
Table 2.
The proportion of apoptotic changes, DNA fragmentation index and membrane integrity of sperm (%, mean ± SE) of native Polish Crested chickens and Hy-Line Brown roosters (n= 6/genetic group; number of ejaculate 30/storage time) in relation to short-term storage
| Characteristic | Item | Apoptotic | DFI | Viable | Non-viable | Moribund |
|---|---|---|---|---|---|---|
| PCr | 0 h | 3.1±0.5 a | 4.8±0.8 a | 93.3±1.0 c | 2.8±0.4 a | 3.9±0.6 a |
| 24 h | 5.1±0.8 ac | 10.3±1.7 b | 92.2±0.9 c | 3.7±0.5 a | 4.1±0.5 a | |
| 48 h | 4.1±0.6 a | 22.2±2.0 d | 92.1±0.8 c | 3.4±0.4 a | 4.5±0.6 a | |
| HLB | 0 h | 3.8±0.6 a | 8.3±0.8 a | 89.7±1.0 b | 4.9±0.6 b | 5.3±0.6 b |
| 24 h | 6.9±1.2 bc | 18.8±2.2 c | 86.9±1.2 a | 6.5±0.8 bc | 6.8±0.7 c | |
| 48 h | 5.6±0.6 ab | 34.7±3.2 e | 86.7±0.8 a | 6.8±0.7 c | 6.5±0.6 c | |
| Genetic group (G) | PCr | 4.1±0.4 a | 12.4±1.2 a | 92.5±0.5 b | 3.3±0.2 a | 4.2±0.3 a |
| HLB | 5.4±0.5 b | 20.6±1.8 b | 87.8±0.6 a | 6.1±0.4 b | 6.1±0.4 b | |
| Storage time (S) | 0 h | 3.5±0.4 a | 6.6±0.6 a | 91.4±0.7 b | 3.9±0.4 a | 4.6±0.5 a |
| 24 h | 6.0±0.7 b | 14.5±1.4 b | 89.5±0.8 a | 5.1±0.5 b | 5.3±0.5 b | |
| 48 h | 4.9±0.4 ab | 28.5±2.1 c | 89.3±0.7 a | 5.1±0.5 b | 5.5±0.4 b | |
| P-value | ||||||
| G | 0.0290 | <0.0001 | 0.0001 | <0.0001 | 0.0015 | |
| S | 0.0004 | <0.0001 | 0.0001 | 0.0041 | 0.0081 | |
| G × S | 0.4981 | <0.0001 | 0.1223 | 0.2313 | 0.2320 | |
[i] a, b, c – values in the same column with different letters differ significantly P<0.05 – PCr vs HLB storage time point; genetic group; storage time.
[ii] Abbreviations: apoptotic sperm –Yo-PRO-1 positive; DFI – DNA fragmentation index; viable – sperm with intact cell membrane; non-viable – sperm with a damaged cell membrane; moribund – sperm with a damaged cell membrane – metabolically active. Semen sample measurement: YO-PRO 1/propidium iodide (PI) staining and flow cytometry (FC) technique; DFI – sperm chromatin structure assay (SCSA) method based on acridine orange test and FC; viable – sperm SYBR-14/PI staining and FC; PCr – Polish Crested chickens; HLB – Hy-Line Brown; G – genetic group; S – storage; G × S – interaction genetic group × storage.
Table 3.
Pearson correlation coefficients for sperm quality parameters of native Polish Crested chickens (PCr; above the diagonal) and Hy-Line Brown roosters (HLB; below the diagonal) measured at the 0 h storage point
| MOT | VCL | VSL | VAP | LIN | STR | WOB | ALH | Apoptotic | DFI | Viable | Non-viable | Moribund | |
|---|---|---|---|---|---|---|---|---|---|---|---|---|---|
| MOT | 0.620*** | 0.540** | 0.654*** | 0.340 | 0.201 | 0.507** | 0.566** | –0.118 | –0.007 | 0.236 | –0.314 | –0.160 | |
| VCL | 0.560** | 0.758*** | 0.931*** | 0.077 | –0.028 | 0.179 | 0.874*** | –0.197 | 0.293 | 0.052 | –0.178 | 0.037 | |
| VSL | 0.568** | 0.668*** | 0.930*** | 0.634*** | 0.542** | 0.640*** | 0.382* | –0.110 | 0.429* | –0.041 | –0.040 | 0.092 | |
| VAP | 0.608*** | 0.930*** | 0.882*** | 0.401* | 0.261 | 0.476** | 0.689*** | –0.207 | 0.357 | 0.062 | –0.158 | 0.008 | |
| LIN | 0.287 | –0.282 | 0.434** | 0.034 | 0.958*** | 0.952*** | –0.274 | 0.111 | 0.350 | –0.186 | 0.218 | 0.144 | |
| STR | 0.313 | –0.300 | 0.411* | –0.001 | 0.970*** | 0.865*** | –0.404* | 0.152 | 0.342 | –0.280 | 0.285 | 0.248 | |
| WOB | 0.324 | –0.213 | 0.472 | 0.112 | 0.975*** | 0.905*** | –0.111 | 0.067 | 0.350 | –0.089 | 0.089 | 0.080 | |
| ALH | 0.470** | 0.959*** | 0.499** | 0.843*** | –0.448* | –0.477** | –0.357 | –0.261 | 0.175 | 0.225 | –0.295 | –0.155 | |
| Apoptotic | –0.313 | –0.277 | –0.244 | –0.279 | –0.200 | –0.172 | –0.228 | –0.214 | 0.097 | –0.485* | 0.430* | 0.471* | |
| DFI | –0.213 | –0.381 | –0.163 | –0.274 | 0.281 | 0.200 | 0.321 | –0.342 | 0.309 | –0.676*** | 0.701*** | 0.598*** | |
| Viable | 0.286 | 0.134 | 0.130 | 0.145 | 0.172 | 0.157 | 0.182 | 0.105 | –0.657*** | –0.568** | –0.909*** | –0.957*** | |
| Non-viable | –0.243 | –0.203 | –0.131 | –0.196 | –0.041 | –0.040 | –0.059 | –0.180 | 0.309 | 0.566** | –0.770*** | 0.751*** | |
| Moribund | 0.192 | –0.000 | –0.065 | –0.022 | –0.223 | –0.197 | –0.218 | 0.021 | 0.564*** | 0.322 | –0.761*** | 0.173 |
[ii] Abbreviations: MOT (%) – total motility; VCL (µm/s) – curvilinear velocity; VSL (µm/s) – straight-line velocity; VAP (µm/s) – average path velocity; LIN (%) – linearity (LIN=VSL/VCL × 100); STR (%) – straightness (STR=VSL/VAP × 100); WOB (%) – path wobble (WOB=VAP/VCL × 100); ALH (µm) – amplitude of lateral head displacement; apoptotic sperm (%) – Yo-PRO-1 positive; DFI (%) – DNA fragmentation index; viable – sperm with intact cell membrane; non-viable – sperm with a damaged cell membrane; moribund – sperm with a damaged cell membrane – metabolically active.
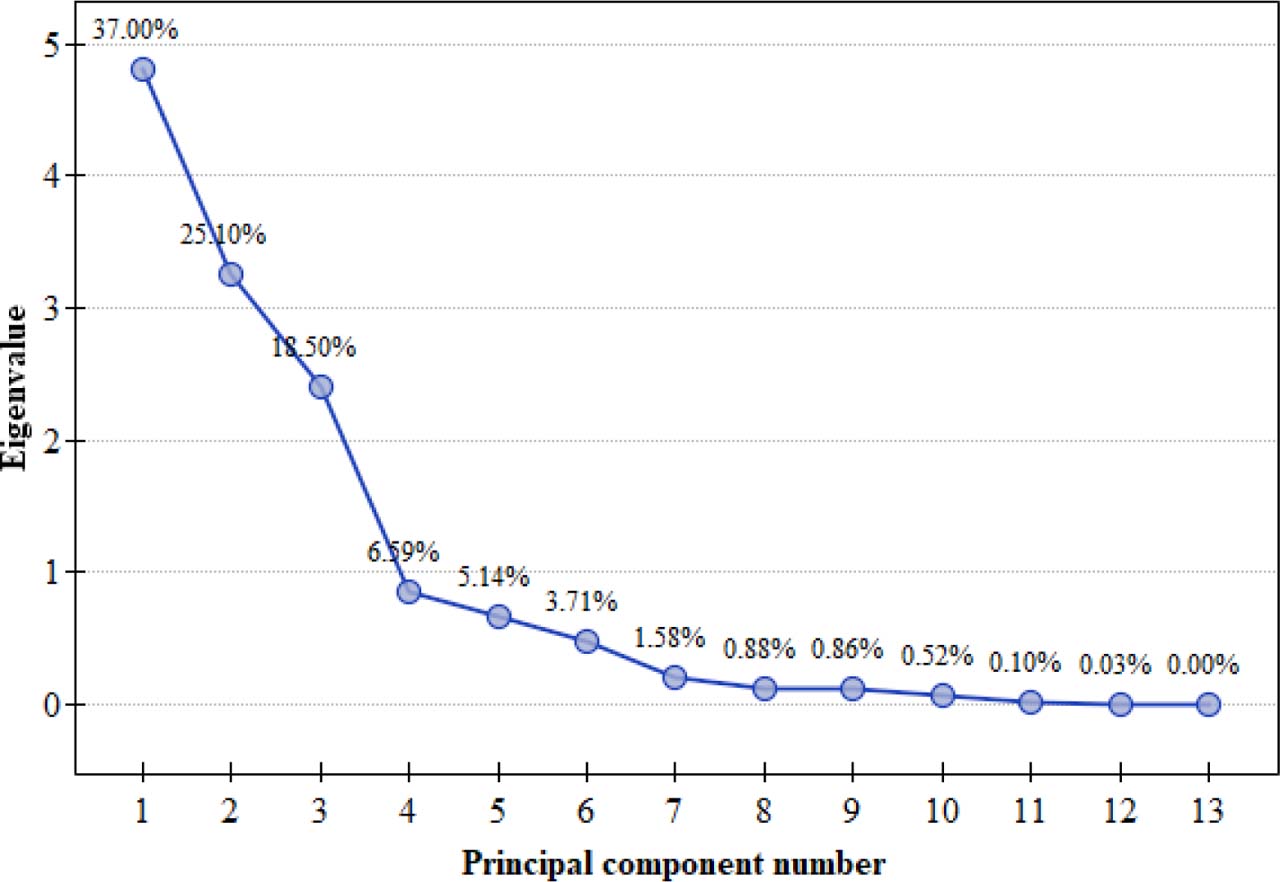
Figure 1.
Scree plot displaying principal components based on eigenvalues. PCA analyses for semen collected from native Polish Crested chickens and Hy-Line Brown roosters
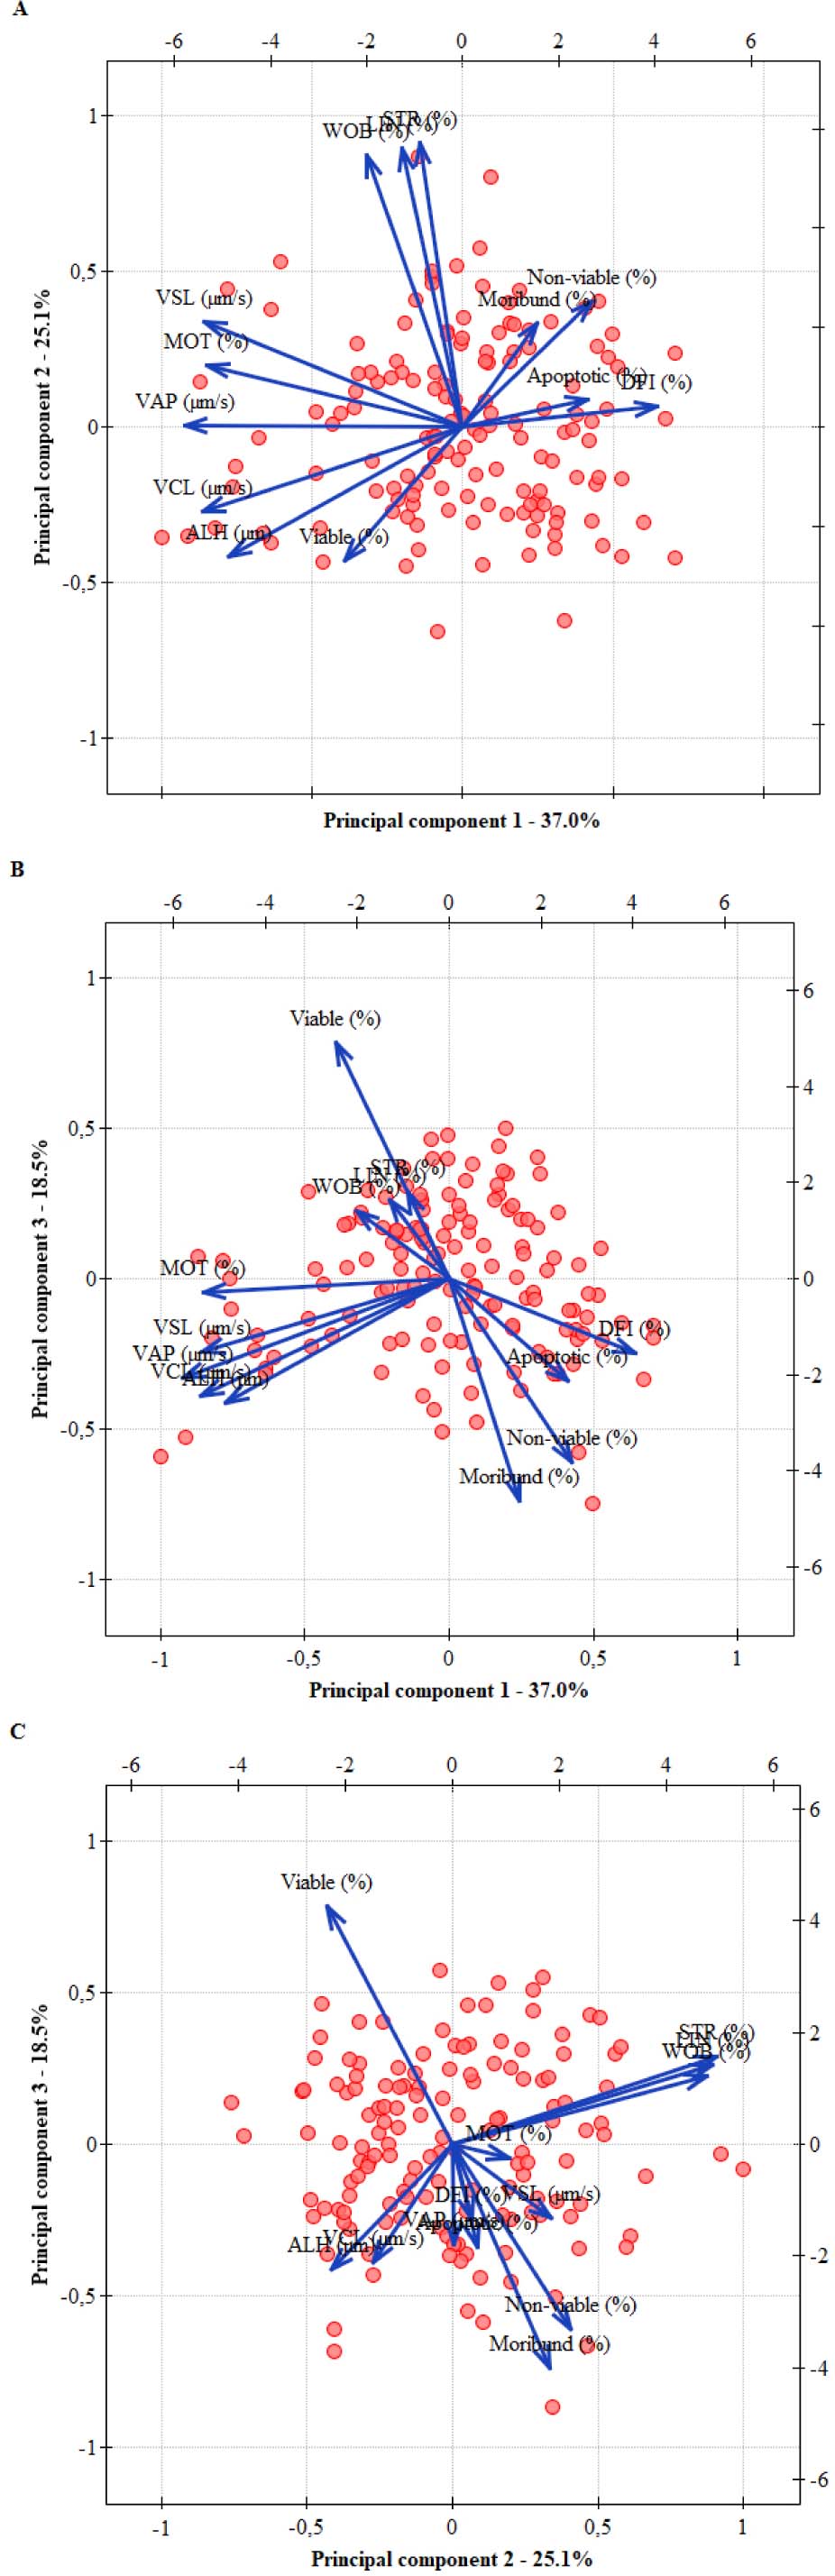
Figure 2.
PCA biplot showing distribution of CASA and flow cytometry-based sperm parameters (red circles) and their contribution to principal components in semen collected from native Polish Crested chickens and Hy-Line Brown roosters (A–C). Abbreviations as in Table 3
Table 4.
PCA-based relative sperm quality parameters (mean ± SE) of semen of native Polish Crested chickens and Hy-Line Brown roosters (n = 6/genetic group; number of ejaculate 30/storage time) in relation to short-term storage
| Characteristic | Item | PC1 R-MOT | PC2 R-SP | PC3 R-viability |
|---|---|---|---|---|
| PCr | 0 h | –2.13±0.4 a | –0.36±0.4 ab | 0.18±0.3 ab |
| 24 h | –0.08±0.3 b | 0.22±0.4 ab | 0.88±0.3 b | |
| 48 h | 1.01±0.3 cd | –0.83±0.3 a | 0.77±0.3 b | |
| HLB | 0 h | –1.60±0.4 a | 0.04±0.4 ab | –0.88±0.3 a |
| 24 h | 0.60±0.4 bc | 0.99±0.4 b | –0.45±0.3 a | |
| 48 h | 2.17±0.3 d | –0.06±0.3 ab | –0.50±0.2 a | |
| Genetic group (G) | PCr | –0.39±0.3 a | –0.32±0.2 a | 0.61±0.2 b |
| HLB | 0.39±0.3 b | 0.32±0.3 a | –0.61±0.2 a | |
| Storage time (S) | 0 h | –1.85±0.3 a | –0.16±0.3 ab | –0.35±0.2 a |
| 24 h | 0.26±0.2 b | 0.61±0.3 b | 0.22±0.2 b | |
| 48 h | 1.59±0.2 c | –0.45±0.2 a | 0.13±0.2 ab | |
| P-value | ||||
| G | 0.0378 | 0.0628 | 0.0005 | |
| S | 0.0001 | 0.0046 | 0.0233 | |
| G × S | 0.4311 | 0.7952 | 0.7928 | |
[i] a, b, c, d – values in the same column with different letters differ significantly P<0.05 – PCr vs HLB storage time point; genetic group; storage time.
[ii] PC1 – R-MOT “relative MOT” correlated with MOT, VCL, VSL, VAP, and ALH; PC2 – R-SP “relative swimming pattern” correlated with LIN, STR, and WOB; PC3 – R-viability “relative viability” correlated with viable sperm with intact cell membrane; Non-viable – sperm with a damaged cell membrane; moribund – sperm with a damaged cell membrane – metabolically active. PCr – Polish Crested chickens; HLB – Hy-Line Brown; G – genetic group; S – storage; G × S – interaction genetic group × storage.
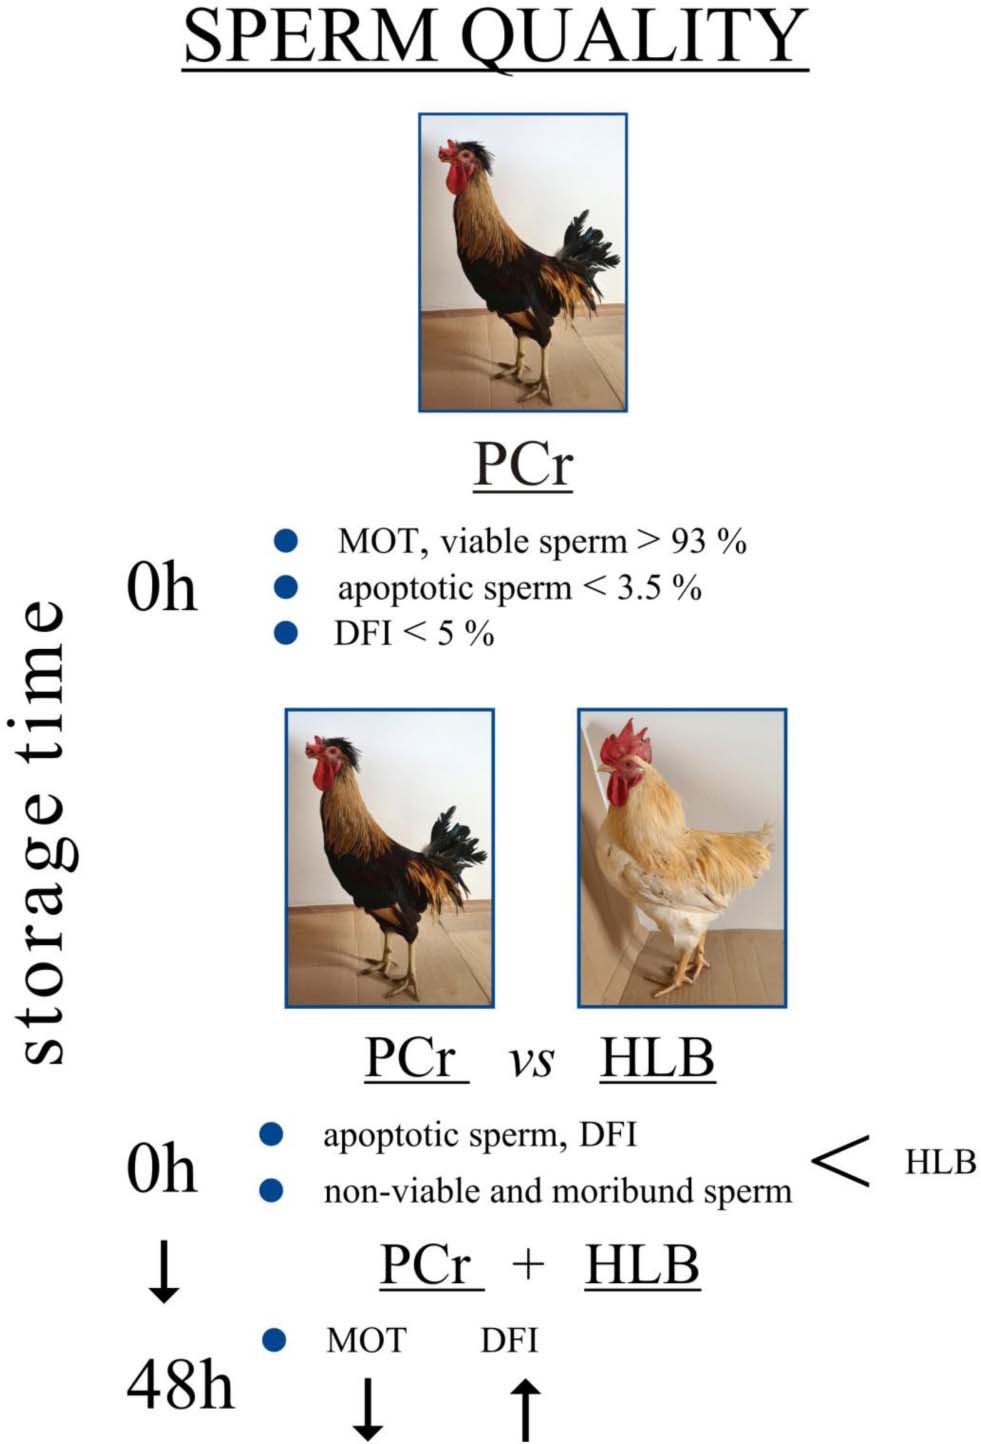
Figure 3.
Schematic summary of main results of the study. Abbreviations as in Table 3