
The hens' industry in Poland ranks among the top in the European Union. In 2024, Poland had a total of 52.9 million laying hens, the third highest in Europe, and produced approximately 670 thousand tons of eggs, ranking fifth in egg production (European Commission, 2025). This growing industry requires specific attention to maintain birds' health and, consequently, enhance the quality of the products. Eggs are considered one of the most important items in people's food baskets, due to their excellent protein profile and proper fatty acids, which are essential for a balanced diet (Seuss-Baum et al., 2011). As consumers are more mindful of their diets nowadays, meeting product quality standards is crucial.
Additionally, birds are frequently subjected to various stressors in industrial poultry farming, including elevated temperatures (Kim et al., 2024), high stocking density (Janicka et al., 2025), and increased ammonia concentration (David et al., 2015). Corticosterone, a key glucocorticoid, plays a crucial role in stress responses by regulating the variability of neuroendocrine and immune reactions (Nazar et al., 2012; Xu et al., 2018; Kim et al., 2020; Derkho et al., 2021).
Conversely, using feed additives in poultry nutrition has become widespread for improving performance and disease prevention (Granstad et al., 2020; El-Sabrout et al., 2025). According to the European Food Safety Authority (EFSA), feed additives are defined as substances added to feed to improve feed quality, product quality, and, consequently, animal health (Pirgozliev et al., 2019).
During the last two decades, hemp (Cannabis sativa) has been used widely in various studies (Callaway, 2004; Silversides and Lefrançois, 2005; Khan et al., 2010; Konca et al., 2014; della Rocca and Di Salvo, 2020; Hussain et al., 2021; Tufarelli et al., 2023). Different parts of this plant, mostly seeds, were implemented in animal research (EFSA, 2011; Rosso et al., 2024). Cannabidiol (CBD), a non-psychoactive phytocannabinoid of hemp plant, is derived from leaves, flowers, and stems (della Rocca and Di Salvo, 2020; Valizadehderakhshan et al., 2021). It has received great attention in research on humans (Devinsky et al., 2017; Szaflarski et al., 2018; Laux et al., 2019), dogs (Gamble et al., 2018; Verrico et al., 2020), cats (Deabold et al., 2019), rats (Maione et al., 2011; Hammell et al., 2016; De Gregorio et al., 2019) mice (Lehmann et al., 2016; Li et al., 2018; Abraham et al., 2020), and a few studies on poultry (Konieczka et al., 2020; Bień et al., 2024). It is proven that CBD has beneficial effects in controlling stress by modulating the hypothalamic–pituitary–adrenal (HPA) axis, reducing cortisol secretion, and interacting with serotonergic (5-HT1A) receptors that regulate anxiety and stress responses (de Mello Schier et al., 2014; Blessing et al., 2015; Hunt et al., 2023) as well as pain (Abraham et al., 2020; Verrico et al., 2020) and inflammation (Hammell et al., 2016). Furthermore, studies have also reported the antioxidative effects of CBD (Costa et al., 2007; Biernacki et al., 2021). These effects are likely due to the interaction between the endocannabinoid system (ECS) and CBD. ECS is a signaling system found in invertebrates (Salzet and Stefano, 2002) and vertebrates (Elphick and Egertova, 2001). It consists of endocannabinoids (lipid compounds), two different receptors (CB1 and CB2), and enzymes (Kumar et al., 2019). This system is effective in oxidative stress reduction (Atalay et al., 2020), anti-inflammatory responses, pain reduction, and sleep regulation (della Rocca and Di Salvo, 2020).
Few studies have demonstrated the effects of CBD in poultry. Konieczka et al. (2020) examined the effects of hemp extract with 12% CBD and nanoselenium on broilers challenged with Clostridium perfringens. The results showed upregulation in gene expression, consequently improving gut barrier function and gut bacterial enzyme activity. Moreover, CBD maintains homeostasis in stressful conditions (Bień et al., 2024). Balenović et al. (2024) added different quantities of dried hemp leaves (10, 20, and 30 g/kg) to broiler diets. Hemp leaves contain bioactive cannabinoids such as CBD, cannabigerol (CBG), and cannabinol (CBN) that enhance immune system function after Newcastle vaccination, with higher CD4+ and CD8+ lymphocyte sub-populations.
No research has been conducted thus far on CBD water supplementation in poultry. Considering the documented antioxidant, anti-inflammatory, anxiolytic, and gut-modulatory properties of CBD in mammals, its supplementation may positively influence welfare and productivity in laying hens. Therefore, in this study, we aim to examine the effect of a water-soluble CBD emulsion on laying performance, egg quality, eggs sensory parameters, stress level, and gut function. These findings are expected to provide novel insights into the potential of CBD as a natural additive to improve poultry health and production efficiency.
Material and methods
Ethics approval
The Local Ethical Committee for Animal Experimentation approved the experimental procedures in Wrocław, Poland (Resolution No. 017/2023/P1, approved on April 19, 2023). All animals were reared and managed in compliance with Regulation 2010/63/EU on the protection of animals used for scientific purposes. The research staff involved in animal handling were specialists (Ph.D. or M.Sc. in Animal Science) and experienced veterinary practitioners.
Experimental design and laying hens
The experiment was conducted on 180 laying hens at 26 weeks of age (Lohmann Brown Classic) at the Research and Education Station in Swojczyce, which belongs to Wrocław University of Environmental and Life Sciences (Wrocław, Poland). A completely randomized design was adopted consisting of five treatments with 12 replications each, and three hens per replication (36 hens per group). Each cage represented a single replication. The hens were distributed randomly into standard furnished cages (0.125 m2 × hen−1) based on their initial body weight (BW). The microclimate conditions were under control based on Lohmann's recommendation with an average temperature of 18°C, relative humidity of 65%, and light regime of 14L:10D (Lohmann, 2020). The experimental period lasted 15 weeks. CBD was added to the drinking water in the form of a water-soluble emulsion for the whole duration of the experiment. The experimental groups are depicted in Table 1.
Table 1.
Experimental treatments (groups)
| Groups | Description |
|---|---|
| C (Control) | Water without additive |
| B (Blank) | Water + emulsifier |
| I | Water + CBD 20 mg/kg BW1 + emulsifier |
| II | Water + CBD 40 mg/kg BW + emulsifier |
| III | Water + CBD 80 mg/kg BW + emulsifier |
CBD preparation
The emulsion was prepared using a CBD isolate of 99.14% purity, as confirmed by the manufacturer's certificate (A-Sense Ltd., Puławy, Poland) and rape-seed lecithin (PL's) as an emulsifier (Bunge Poland Ltd., Brzeg). The total cannabinoid content was 99.61%; in addition to CBD, 0.47% of cannabidivarin (CBDV) was detected, whereas the concentrations of other cannabinoids were below the method's limit of detection (<LOD). The separation of CBD was carried out using Agilent 1290 Infinity II system. Ascentis Express C8 column (2.7 μm, 150 × 3.0 mm, Merck 53853-U) was used and thermostated at 30°C. The separation was performed isocratically with 27% phase A (5 mM ammonium formate + 0.1% formic acid in water) and 73% phase B (0.1% formic acid in acetonitrile). The calibration curve was prepared using CRM 1.0 mg/mL in methanol (MERCK C-045). The initial solution with a concentration of 2% was prepared using rapeseed phospholipids (Bunge Poland Ltd.) as an emulsifier and 100 mg/mL of CBD isolate (A-Sense Ltd., Puławy, Poland). The solution was pre-homogenized (12,000 rpm; 10 min) using T 25 mini control ULTRA-TURRAX with S 25 EC-T-C-18 G ST attachment (IKA, Poland Ltd., Warsaw). Subsequently, the solution underwent high-pressure homogenization (200 MPa; 5 passes) using a high-pressure homogenizer (Microfluidizer M-110P). The emulsion was appropriately diluted before administration. The amount of final CBD solution added to water was calculated based on the average BW for each group.
To assess the actual CBD concentration, samples of both stock and working solutions were collected and analyzed at multiple times. For each sampling, 50 mL of the solution was collected using a sterile falcon tube and immediately sent to the analytical laboratory for testing. Stock and working solutions were sampled at the start and week 13 of the experiment. Resampling of the working solutions was conducted in weeks 2 and 14 to assess their stability. All samples were analyzed using high-performance liquid chromatography (HPLC). Table 2 summarizes the sampling time and analysis results for CBD solutions. The actual CBD intake per kilogram of BW was then calculated using the measured concentrations from these samples. Table 3 presents the actual CBD intake per kilogram of BW across the treatment groups. Additional details are available in the supplementary Excel file. Minor differences from expected values reflect variations in water consumption during the rearing period.
Table 2.
CBD solution sampling time and analytical method (HPLC method)
| Time point | Notes1 | Calculated concentration3 (mg/mL) | Analyzed concentration3 (mg/mL) | ||||
|---|---|---|---|---|---|---|---|
| group I | group II | group III | group I | group II | group III | ||
| 1st week | Freshly prepared | 0.144 | 0.288 | 0.576 | 0.169 | 0.318 | 0.581 |
| 2nd week | Stored sample2 | 0.136 | 0.272 | 0.544 | 0.168 | 0.319 | 0.581 |
| 13th week | Freshly prepared | 0.144 | 0.272 | 0.544 | 0.171 | 0.321 | 0.583 |
| 14th week | Stored sample2 | 0.144 | 0.272 | 0.544 | 0.170 | 0.320 | 0.582 |
Table 3.
Actual CBD intake per kilogram of body weight at the 1st and 13th week
| Groups | Description | 1st week | 13th week |
|---|---|---|---|
| I | CBD 20 mg/kg BW | 25 mg/kg1 | 20 mg/kg |
| II | CBD 40 mg/kg BW | 48 mg/kg | 39 mg/kg |
| III | CBD 80 mg/kg BW | 82 mg/kg | 73 mg/kg |
Performance parameters
The feed and water were supplied for each cage daily. All experimental groups received the same basal diet ad libitum. The composition and nutritional value of the diet for the first laying period are presented in Table 4. Nutrient values were based on feed composition data sourced from the feed provider, formulated according to CVB (2018) standards.
Table 4.
Feed composition and nutritional value of the diet during the first laying period
| Item | Amount (%) |
|---|---|
| Corn | 29.91 |
| Wheat | 15.8 |
| Triticale | 13 |
| Post-extraction rapeseed meal | 12 |
| Post-extraction soybean meal | 9.8 |
| Calcium carbonate (limestone) | 8.89 |
| Corn distillers dried grain | 5 |
| Wheat bran | 2.2 |
| Soybean oil | 1.9 |
| Blood products – dried poultry hemoglobin | 0.5 |
| Sodium chloride | 0.24 |
| Sodium bicarbonate | 0.13 |
| Monocalcium phosphate | 0.12 |
| Premix1 | 0.51 |
| Calculated nutritional value | |
| Item2 | Value |
| ME3 for layers (kcal/kg) – calculated | 2748 |
| Crude protein (g/kg) – calculated | 167.79 |
| Crude fiber (g/kg) – calculated | 42.91 |
| Crude ash (g/kg) – calculated | 117.52 |
| Crude fat (g/kg) – calculated | 45.33 |
| Lysine (g/kg) – calculated | 8.11 |
| Methionine (g/kg) – calculated | 3.74 |
| Total Ca (g/kg) – calculated | 35.98 |
| Total P (g/kg) – calculated | 4.79 |
1 Composition of the 1 kg of premix: vitamin A, 10000 IU; vitamin D3, 3000 IU; vitamin E, 14 IU; copper (copper sulfate 5-hydrate), 10 mg; iron (ferric sulfate monohydrate), 30 mg; manganese (manganese oxide), 80 mg; zinc (zinc sulfate monohydrate), 80 mg; iodine (calcium iodine anhydrous), 1 mg; selenium (sodium selenite), 0.25 mg; BHT (E321) 1b, 1.04 mg; BHA (E320) 1b, 0.57 mg; phytase, 900 OUT, endo 1,4 beta-xylanase, 1500 VU.
To measure the water consumption accurately, two manual nipple drinkers per cage (1 L each) were installed. Emulsifier and CBD solutions were prepared before applying to the drinkers. Feed intake, water in-take, and feed conversion ratio (FCR) were recorded weekly throughout the 15-week experimental period. Feed and water amount were measured based on the total amount offered and remaining for each group. Performance parameters (feed intake, water in-take, and FCR) were calculated per cage, with the cage considered the experimental unit, and subsequently expressed on a perhen basis by dividing by the number of hens per cage. These weekly values were used to evaluate the performance changes over time. Moreover, for clearer presentation and easier interpretation of trends for the whole experiment duration, the feed and water in-take data were subsequently recalculated and expressed as average intake per bird per month. This monthly aggregation was used only for reporting purposes and does not reflect a change in the actual data collection frequency. FCR was calculated as the amount of feed consumed per dozen eggs produced. Collecting eggs and recording the egg numbers per cage was done daily. Hen-day egg production was calculated for a specific period for each experimental unit. BW was measured at the beginning, middle, and end of the experiment.
Egg assessment
Eggs were analyzed at 0 and 90 days of CBD implementation. For each period, three eggs from each cage were collected (180 eggs) to assess the shell strength and shell thickness. Shell strength refers to the minimum force required to break the egg and was measured using Egg Force ReaderTM (Orka Food Technology Ltd., West Bountiful, UT, USA). To obtain more accurate results, shell thickness was measured with a digital micrometer at three different parts of each egg: sharp end (top), equator (middle), and blunt end (bottom).
Sensory evaluation of the eggs
At the end of the experiment, a total of 300 eggs were hard-boiled for 8 min (starting from boiling time) and cooled down with water at room temperature. The eggs were cut in half, labeled with specific codes (1 code for each group), and distributed among the 60 panelists (N = 60, 43 females and 17 males) who were randomly selected from the university students and staff. Each panelist evaluated one egg from each experimental group, resulting in five eggs per panelist, and panelists were blinded to treatment identity. Eggs' sensory traits were evaluated for yolk texture, yolk color, unusual taste, and unusual smell using a 0–9 intensity scale, where 1 = not intensive and 9 = extremely intensive. Unusual taste and unusual smell were defined as the presence and intensity of any atypical, off-flavor or off-odor attributes different from the sensory characteristics of a usual hard-boiled egg, including but not limited to sulfurous, metallic, rancid, or feed-related notes. For statistical analysis, the cage was considered the experimental unit. Sensory scores were averaged across panelists for each cage prior to analysis, and individual panelist effects were not modeled separately. Although sensory scores are ordinal in nature, assumptions of normality and homogeneity of variance were met; therefore, sensory data were analyzed using ANOVA.
Corticosterone measurement
Hormone levels were measured using a non-invasive method after 15 weeks of the experiment. Fresh feces were collected from 60 cages (all replications) using cage conveyor belts, with one pooled fecal sample collected per cage, and the cage considered the experimental unit. Each sample represented the combined excreta of all hens housed in that cage. The samples were placed in plastic containers and immediately transferred to a −80°C freezer. Frozen fecal samples were subjected to sublimation drying (lyophilization) using FreeZone 18L apparatus (Labconco, Kansas City, MO, USA). The process began at a temperature of −40°C for the first hour, then the shelf temperature was gradually increased to 40°C at a rate of 0.05°C/min and maintained under these conditions for the next 48 h. The process pressure was constant at 0.230 mBar. To detect corticosterone, 1 g of dried sample was mixed with 9 mL of PBS (pH = 7.4) and centrifuged at 2500 rpm for 20 min. The supernatants were collected and the hormone levels were assessed using ELISA (Chicken Corticosterone, CORT ELISA Kit, BT Laboratory, China).
Gut morphology
One hen per cage was randomly selected from six cages per group for gut histomorphology analysis. Six hens from each group (30 hens) were euthanized at the end of the experiment to collect samples from different intestine segments (duodenum, jejunum, and ileum). The hens were euthanized according to Directive 2010/63/EU (European Union, 2010). Morphometric measurements of each intestinal segment were performed to calculate the absorptive area and the intestinal tissue activity index. Measurements were made for each segment in three replicates for seven consecutive intact villi, including the intact lamina propria. The villus length, width, and the ratio of the villus length to the crypt depth were measured. The surface area of the intestinal villi was calculated using the formula S = 2π(W/2)L, where S is the surface area of the villus (μm2), W is the villus width, and L is the villus length (μm). The degree of intestinal vascularization was also evaluated. Intestinal samples (1 × 1 cm2 tissue sections) were fixed in a 4% buffered formalin solution (pH = 7.2–7.4), rinsed in running water for 12 h, and dehydrated in an alcohol series. The samples were embedded in paraffin afterward. Sections measuring 5-μm-thick were cut and stained with hematoxylin and eosin (Merck, Darmstadt, Germany). Tissue sections were macroscopically analyzed using Stemi 508 stereomicroscope equipped with Axiocam 208 color camera (Axio Scope A1, Carl Zeiss, Jena, Germany) linked to ZEN image analysis software.
Statistical analysis
Data analysis was conducted using R software, version 4.4.0 (R Core Team, 2024). The mean, standard deviation, and lower and upper quartile were calculated for all the parameters. Normality and homogeneity of variance were assessed using the Shapiro–Wilk and Levene's tests, respectively, and these assumptions were violated for performance parameters. Therefore, the Kruskal–Wallis test was performed, followed by Dunn's post hoc test for performance data. To compare the groups for other parameters, analysis of variance (ANOVA) was performed followed by post hoc Fisher least significant difference (LSD) test. Fisher's LSD comparisons were conducted only following a statistically significant omnibus ANOVA and no additional correction for multiple testing was applied.
Furthermore, multiple linear regression was used to check the relationship between the BW and production parameters. The general form of the multiple linear regression model was:
where y represents the dependent variable (initial, middle, or final body weight), x1 is feed intake (kg/bird), x2 is water intake (L/bird), and x3 is egg production (%). The intercept is a0, the regression coefficients are a1–a3, and the random error term is e. The significance level was set to 0.05.Results
Laying hen performance
To provide a clearer understanding of the changes, the performance data are presented in following two ways:
1) At the end of the experiment: Table 5 shows the effects of different doses of CBD on performance after the experimental period. No significant differences exist among the groups for all performance parameters.
2) From the beginning (1st week) to the end (15th week) of the experiment: Calculations were made to show a difference between values from the 1st to 15th week. Thus, the analysis is the graphs based on the magnitude of change in performance measures, where positive values indicate decreases and negative values indicate increases. Figures 1–4 depict the performance factors. According to Figure 1, statistically significant differences exist among the groups. Feed intake decreased significantly in groups II and III compared to the control group (C) (P<0.05), with no significant differences between groups II and III. The feed intake in the control group slightly increased over the study period. No significant differences were observed for other parameters, including water intake, FCR, and egg production percentage.
Table 5.
Performance of laying hens over the 15-week experimental period
| group | mean | SD | median | P-value |
|---|---|---|---|---|
| C2 | 3.34 | 0.38 | 3.51 | 0.994 |
| B | 3.33 | 0.40 | 3.51 | |
| I | 3.35 | 0.45 | 3.51 | |
| II | 3.33 | 0.42 | 3.54 | |
| III | 3.32 | 0.44 | 3.55 | |
| Water intake1 (L/bird) | ||||
| group | mean | SD | median | P-value |
| C | 6.04 | 1.07 | 6.35 | 0.442 |
| B | 5.89 | 0.98 | 6.25 | |
| I | 6.26 | 1.16 | 6.60 | |
| II | 6.26 | 1.22 | 6.80 | |
| III | 6.16 | 1.21 | 6.75 | |
| FCR3 | ||||
| group | mean | SD | median | P-value |
| C | 1.65 | 0.16 | 1.6 | 0.083 |
| B | 1.63 | 0.16 | 1.6 | |
| I | 1.68 | 0.21 | 1.6 | |
| II | 1.64 | 0.14 | 1.6 | |
| III | 1.59 | 0.08 | 1.6 | |
| Egg production (%) | ||||
| group | mean | SD | median | P-value |
| C | 93.08 | 6.73 | 95.2 | 0.260 |
| B | 93.97 | 7.23 | 96.4 | |
| I | 92.19 | 9.22 | 95.2 | |
| II | 93.21 | 7.00 | 95.2 | |
| III | 95.37 | 4.98 | 96.4 | |
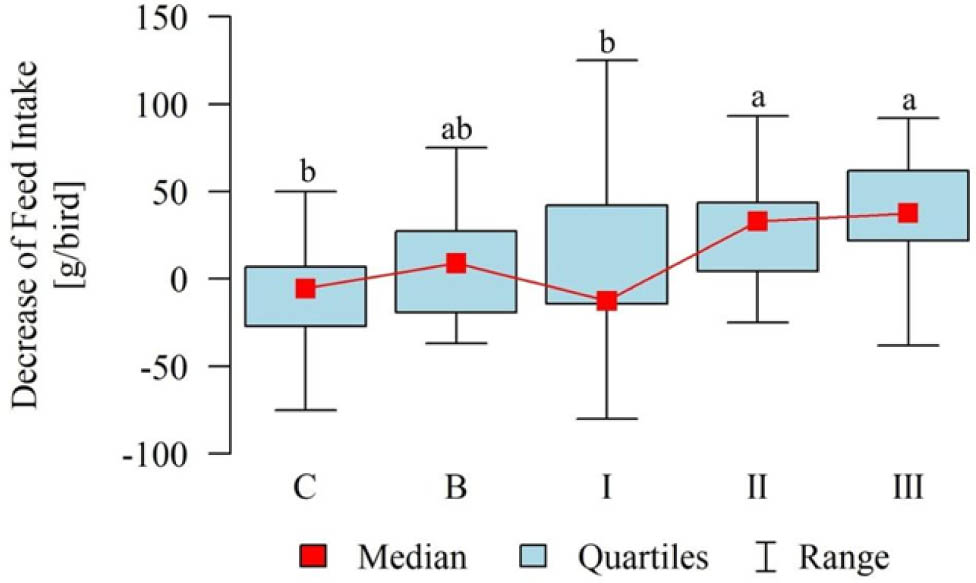
Figure 1.
Feed intake changes from 1st to 15th week
C (control): water without additive; B (blank): water + emulsifier; I: water + CBD 20 mg/kg BW + emulsifier; II: water + CBD 40 mg/kg BW + emulsifier; III: water + CBD 80 mg/kg BW + emulsifier. a, b – values with different letters differ significantly (P≤0.05).
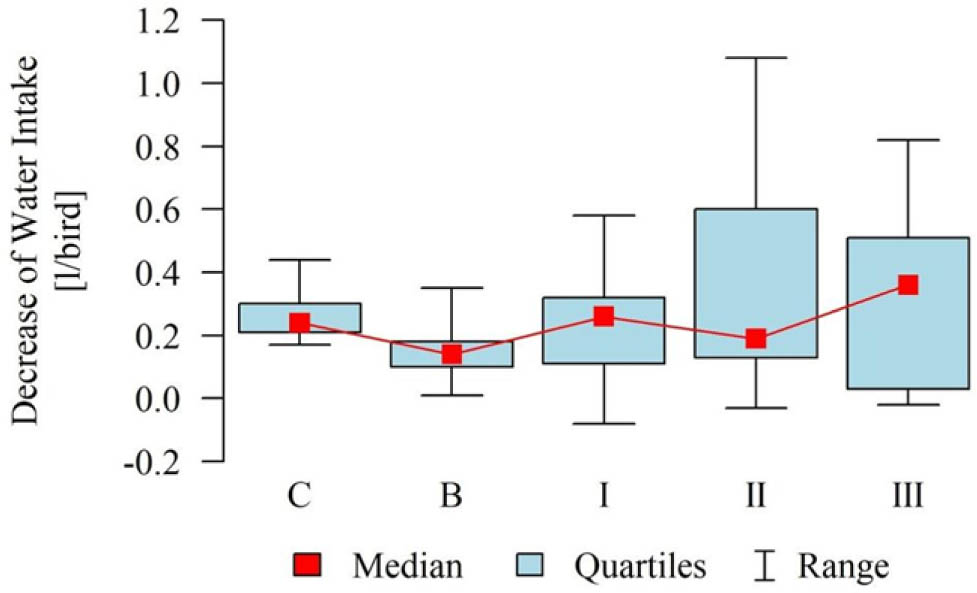
Figure 2.
Water intake changes from 1st to 15th week
C (control): water without additive; B (blank): water + emulsifier; I: water + CBD 20 mg/kg BW + emulsifier; II: water + CBD 40 mg/kg BW + emulsifier; III: water + CBD 80 mg/kg BW + emulsifier.
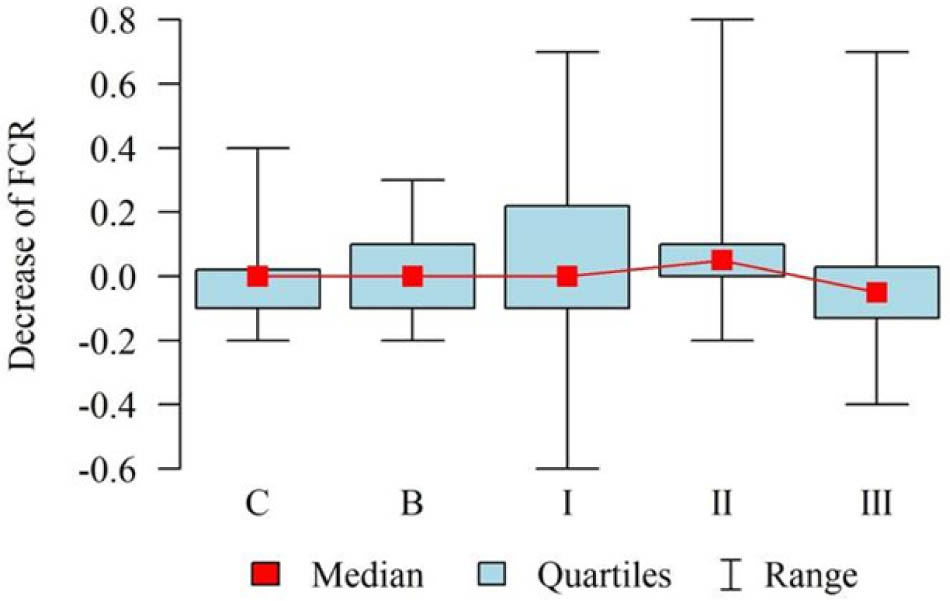
Figure 3.
FCR changes from 1st to 15th week
C (control): water without additive; B (blank): water + emulsifier; I: water + CBD 20 mg/kg BW + emulsifier; II: water + CBD 40 mg/kg BW + emulsifier; III: water + CBD 80 mg/kg BW + emulsifier.
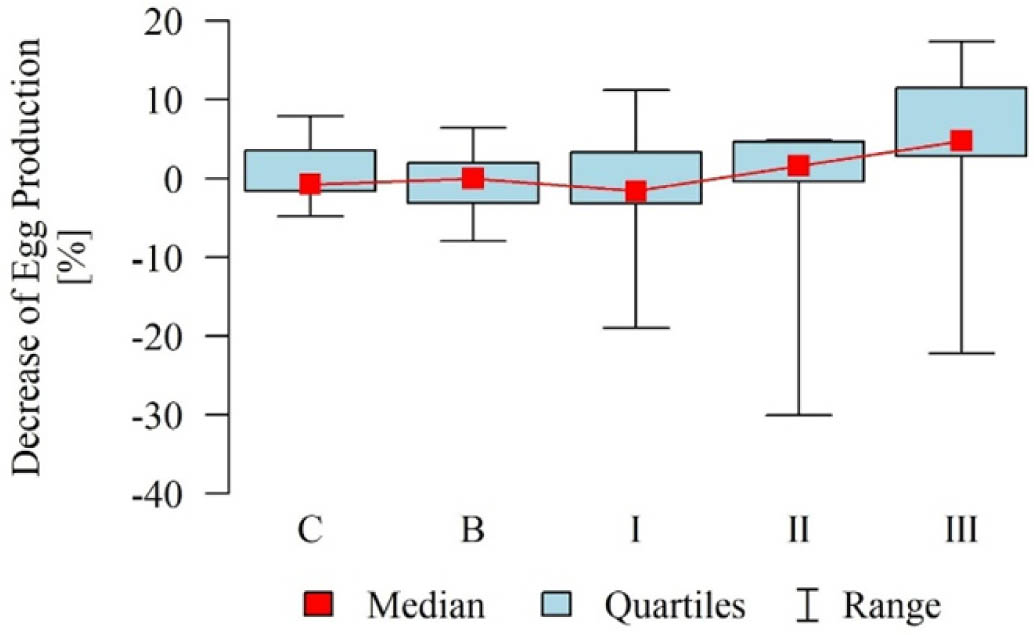
Figure 4.
Egg production changes from 1st to 15th week
C (control): water without additive; B (blank): water + emulsifier; I: water + CBD 20 mg/kg BW + emulsifier; II: water + CBD 40 mg/kg BW + emulsifier; III: water + CBD 80 mg/kg BW + emulsifier.
BW and regression with performance
The CBD concentration added to the water was measured based on the birds' average BW. The results of the BW analysis for three stages of the rearing period (initial, middle, and final) are shown in Figure 5. No significant differences were seen for the initial BW. At the middle stage, the BW in group III was significantly lower than that of groups C, B, and I (P<0.05). At the final stage, significantly lower BW was seen in group III in comparison with group C. Furthermore, groups B and I showed significantly higher BW than groups II and III (P<0.05).
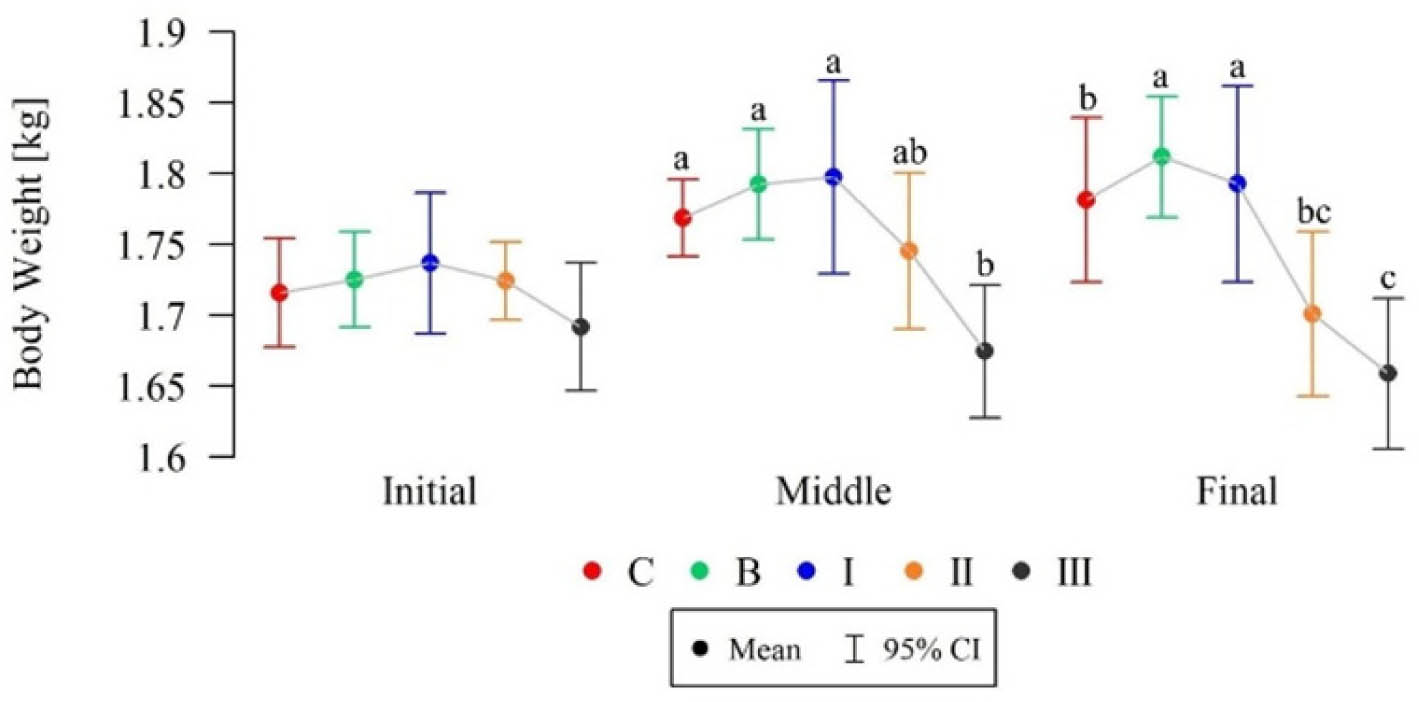
Figure 5.
Laying hens' body weight
C (control): water without additive; B (blank): water + emulsifier; I: water + CBD 20 mg/kg BW + emulsifier; II: water + CBD 40 mg/kg BW + emulsifier; III: water + CBD 80 mg/kg BW + emulsifier. a, b, c – values with different letters differ significantly (P≤0.01).
CI: confidence interval.
The results of the multiple linear regression analysis between BW and the performance parameters are shown in Table 6. Multiple linear regression analysis was performed to explore the overall associations between body weight and selected performance parameters across the study population. This analysis was not intended to test the effects of CBD supplementation or treatment groups. Significant regression was seen between the final BW and feed intake (P<0.05), which shows that each kilogram of the cumulative feed intake in the 1st to 15th week raises the final BW by an average of 0.293 kg (as the regression parameter is 0.293).
Table 6.
Multiple linear regression of the body weight and performance traits
| trait | parameter | 95% CI1 | P-value | |
|---|---|---|---|---|
| Feed intake (kg/bird) | –0.34 | –1.302 | 0.623 | 0.49 |
| Water intake (L/bird) | 0.097 | –0.033 | 0.228 | 0.15 |
| Egg production % | –0.002 | –0.004 | 0 | 0.09 |
| R2 (%) | 7.1 | |||
| Middle body weight (1st–7th week) | ||||
| trait | parameter | 95% CI | P-value | |
| Feed intake (kg/bird) | 0.158 | –0.063 | 0.379 | 0.16 |
| Water intake (L/bird) | –0.026 | –0.059 | 0.006 | 0.12 |
| Egg production % | –0.003 | –0.007 | 0.001 | 0.22 |
| R2 (%) | 9.3 | |||
| Final body weight (1st–15th week) | ||||
| trait | parameter | 95% CI | P-value | |
| Feed intake (kg/bird) | 0.293 | 0.141 | 0.446 | <0.001 |
| Water intake (L/bird) | –0.016 | –0.034 | 0.003 | 0.09 |
| Egg production % | –0.002 | –0.007 | 0.002 | 0.33 |
| R2 (%) | 10.2 | |||
Egg assessment
Tables 7, 8, and 9 present the effects of CBD on the egg parameters at 0 and 90 days after implementation. Egg weight showed a significant difference among the groups at day 0, with groups C and III exhibiting higher values than group II. However, after 90 days of CBD treatment, egg weight did not differ significantly among the groups. Likewise, no significant differences were observed for the other egg parameters.
Table 7.
Egg weight at 0 and 90 days of the experiment
| Egg weight (g) | Group | Mean | SD | P-value |
|---|---|---|---|---|
| C1 | 56.23 a | 1.63 | 0.042 | |
| B | 54.89 ab | 3.11 | ||
| Day 0 | I | 54.17 ab | 2.30 | |
| II | 53.34 b | 2.86 | ||
| III | 55.89 a | 2.52 | ||
| C | 59.96 | 4.56 | 0.86 | |
| B | 60.01 | 3.01 | ||
| Day 90 | I | 60.25 | 2.65 | |
| II | 59.88 | 2.87 | ||
| III | 58.83 | 3.09 |
Table 8.
Egg shell strength at 0 and 90 days of the experiment
| Shell strength (kgf)1 | Group | Mean | SD | P-value |
|---|---|---|---|---|
| Day 0 | C2 | 4.49 | 0.79 | 0.527 |
| B | 4.42 | 0.79 | ||
| I | 4.43 | 0.68 | ||
| II | 4.08 | 0.55 | ||
| III | 4.58 | 0.85 | ||
| Day 90 | C | 4.80 | 0.93 | 0.961 |
| B | 4.95 | 0.55 | ||
| I | 4.79 | 0.50 | ||
| II | 4.83 | 0.75 | ||
| III | 4.94 | 0.66 |
Table 9.
Egg shell thickness of the three parts of the eggs
| Shell thickness Sharp end (mm) | Group | Mean | SD | P-value |
|---|---|---|---|---|
| Day 0 | C1 | 0.36 | 0.02 | 0.058 |
| B | 0.34 | 0.03 | ||
| I | 0.35 | 0.02 | ||
| II | 0.33 | 0.02 | ||
| III | 0.35 | 0.03 | ||
| Day 90 | C | 0.36 | 0.02 | 0.381 |
| B | 0.35 | 0.02 | ||
| I | 0.35 | 0.02 | ||
| II | 0.34 | 0.03 | ||
| III | 0.35 | 0.02 | ||
| Shell thickness Equator (mm) | Group | Mean | SD | P-value |
| Day 0 | C | 0.36 | 0.02 | 0.079 |
| B | 0.35 | 0.02 | ||
| I | 0.35 | 0.02 | ||
| II | 0.33 | 0.02 | ||
| III | 0.35 | 0.03 | ||
| Day 90 | C | 0.35 | 0.02 | 0.455 |
| B | 0.35 | 0.01 | ||
| I | 0.35 | 0.02 | ||
| II | 0.34 | 0.03 | ||
| III | 0.35 | 0.02 | ||
| Shell thickness Blunt end (mm) | Group | Mean | SD | P-value |
| Day 0 | C | 0.35 | 0.02 | 0.056 |
| B | 0.34 | 0.03 | ||
| I | 0.34 | 0.03 | ||
| II | 0.32 | 0.02 | ||
| III | 0.35 | 0.03 | ||
| Day 90 | C | 0.35 | 0.02 | 0.393 |
| B | 0.35 | 0.02 | ||
| I | 0.35 | 0.03 | ||
| II | 0.33 | 0.02 | ||
| III | 0.34 | 0.02 |
Sensory evaluation of the eggs
Based on the results of the sensory analysis (Table 10), no significant differences exist among the groups for yolk texture, unusual taste, or smell. However, the yolk color was more intensified in all groups compared to the control (P<0.05).
Table 10.
Sensory evaluation of the eggs
| Parameter | Group | N2 | Mean | SD | P-value |
|---|---|---|---|---|---|
| 1 | 2 | 3 | 4 | 5 | 6 |
| Yolk texture | C1 | 60 | 4.97 | 2.28 | 0.099 |
| B | 60 | 5.37 | 2.22 | ||
| I | 60 | 5.53 | 2.56 | ||
| II | 60 | 6.02 | 2.24 | ||
| III | 60 | 5.03 | 2.39 | ||
| Unusual taste | C | 60 | 2.62 | 2.27 | 0.179 |
| B | 60 | 3.05 | 2.46 | ||
| I | 60 | 3.13 | 2.45 | ||
| II | 60 | 2.48 | 2.00 | ||
| III | 60 | 2.30 | 1.90 | ||
| Unusual smell | C | 60 | 2.70 | 1.97 | 0.789 |
| B | 60 | 2.88 | 2.28 | ||
| I | 60 | 2.85 | 2.39 | ||
| II | 60 | 2.47 | 2.00 | ||
| III | 60 | 2.55 | 2.13 | ||
| Yolk color | C | 60 | 4.32 B | 2.00 | 0.001 |
| B | 60 | 5.57 A | 2.29 | ||
| I | 60 | 5.72 A | 2.26 | ||
| II | 60 | 5.80 A | 2.14 | ||
| III | 60 | 5.38 A | 2.23 |
Corticosterone measurement
Figure 6 shows the significant differences in fecal corticosterone levels among the groups. The corticosterone concentration in group I was the lowest, being significantly lower than that in the control, group II, and group III.
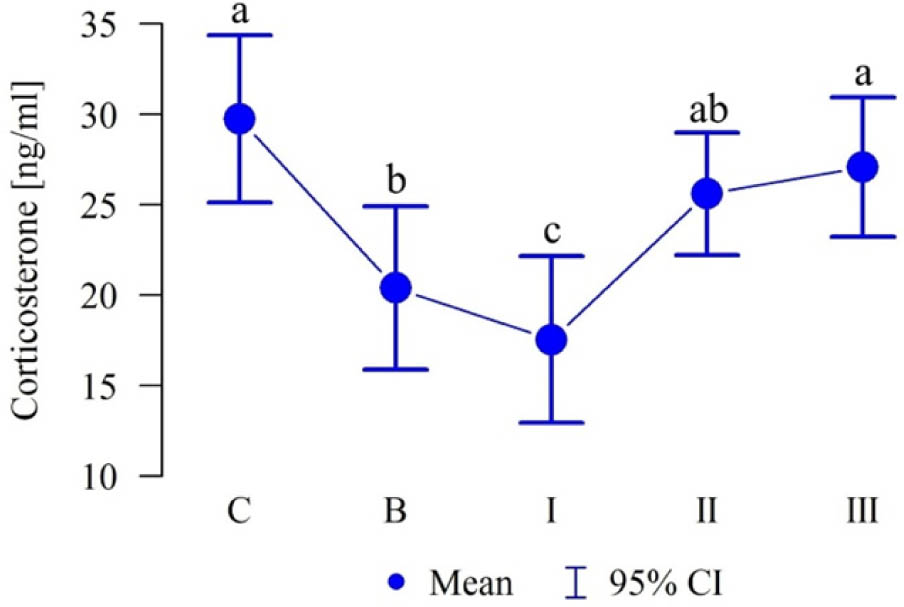
Figure 6.
Corticosterone levels
C (control): water without additive; B (blank): water + emulsifier; I: water + CBD 20 mg/kg BW + emulsifier; II: water + CBD 40 mg/kg BW + emulsifier; III: water + CBD 80 mg/kg BW + emulsifier. a, b, c – values with different letters differ significantly (P≤0.01).
Gut morphology
The effects of CBD on different parts of the intestine are depicted in Table 11 and Figure 7. The surface area of the intestinal villi was calculated using the corresponding formula. Variations in villus morphology, such as changes in their length, width, or density (number per unit area), directly influence the overall absorptive surface of the intestine. An increase in villus surface area enhances the efficiency of nutrient absorption, whereas a reduction in this parameter diminishes absorptive capacity. Crypt depth is one of the factors in evaluating the physiological conditions of the intestine; a deeper crypt demonstrates a higher turnover rate and the need for repair and regeneration. Moreover, the higher ratio of villi height to crypt depth shows better intestinal health conditions.
Table 11.
Duodenum, jejunum and ileum morphology after 15 weeks
| Parameter | Group | Duodenum | Jejunum | Ileum | ||||||
|---|---|---|---|---|---|---|---|---|---|---|
| mean | SD | P-value | mean | SD | P-value | mean | SD | P-value | ||
| Villi surface area (μm2) | C1 | 596692.7 D | 8597.54 | 230707.2 C | 3378.26 | 737787.1 A | 5880.13 | |||
| B | 678855 C | 8645.92 | 330212.6 A | 7400.45 | 571801.9 C | 2434.71 | ||||
| I | 892653.8 A | 4731.11 | <0.001 | 328623.4 A | 3808.11 | <0.001 | 542386.6 D | 5906.26 | <0.001 | |
| II | 333471.1 E | 2141.69 | 231102.3 C | 2495.33 | 684701 B | 2394.76 | ||||
| III | 844503.2 B | 3611.66 | 236472.8 B | 2628.21 | 44728.5 E | 550.72 | ||||
| Villi height (μm) | C | 1900.2 B | 34.99 | 1050.44 C | 2.35 | 1277.3 C | 16.85 | |||
| B | 1637.2 D | 9.41 | 1107.11 B | 1.62 | 1339.2 B | 5.37 | ||||
| I | 1987.3 A | 7.72 | <0.001 | 1346.3 A | 4.76 | <0.001 | 987.1 D | 3 | <0.001 | |
| II | 1062.1 E | 7.62 | 783.4 E | 1.51 | 1407 A | 2.4 | ||||
| III | 1681.3 C | 9.19 | 886.1 D | 1.79 | 950 E | 3.06 | ||||
| Crypt depth (μm) | C | 123.3 C | 1.49 | 101 A | 1.56 | 88.1 D | 0.88 | |||
| B | 71.3 E | 1.34 | 68.2 D | 1.03 | 107.2 A | 2.39 | ||||
| I | 131.4 B | 1.9 | <0.001 | 68 D | 0.82 | <0.001 | 64.3 E | 1.89 | <0.001 | |
| II | 79.2 D | 2.1 | 95 B | 0.82 | 102.4 B | 1.26 | ||||
| III | 141.1 A | 7.75 | 85 C | 5.44 | 98.4 C | 5.34 | ||||
| Villi height/Crypt depth | C | 15.41 B | 0.31 | 10.39 C | 0.16 | 14.5 B | 0.26 | |||
| B | 22.97 A | 0.51 | 16.23 B | 0.25 | 12.5 D | 0.3 | ||||
| I | 15.13 B | 0.21 | <0.001 | 19.8 A | 0.26 | <0.001 | 15.36 A | 0.43 | <0.001 | |
| II | 13.42 C | 0.31 | 8.25 D | 0.08 | 13.74 C | 0.16 | ||||
| III | 11.95 D | 0.64 | 10.46 C | 0.65 | 9.68 E | 0.53 | ||||
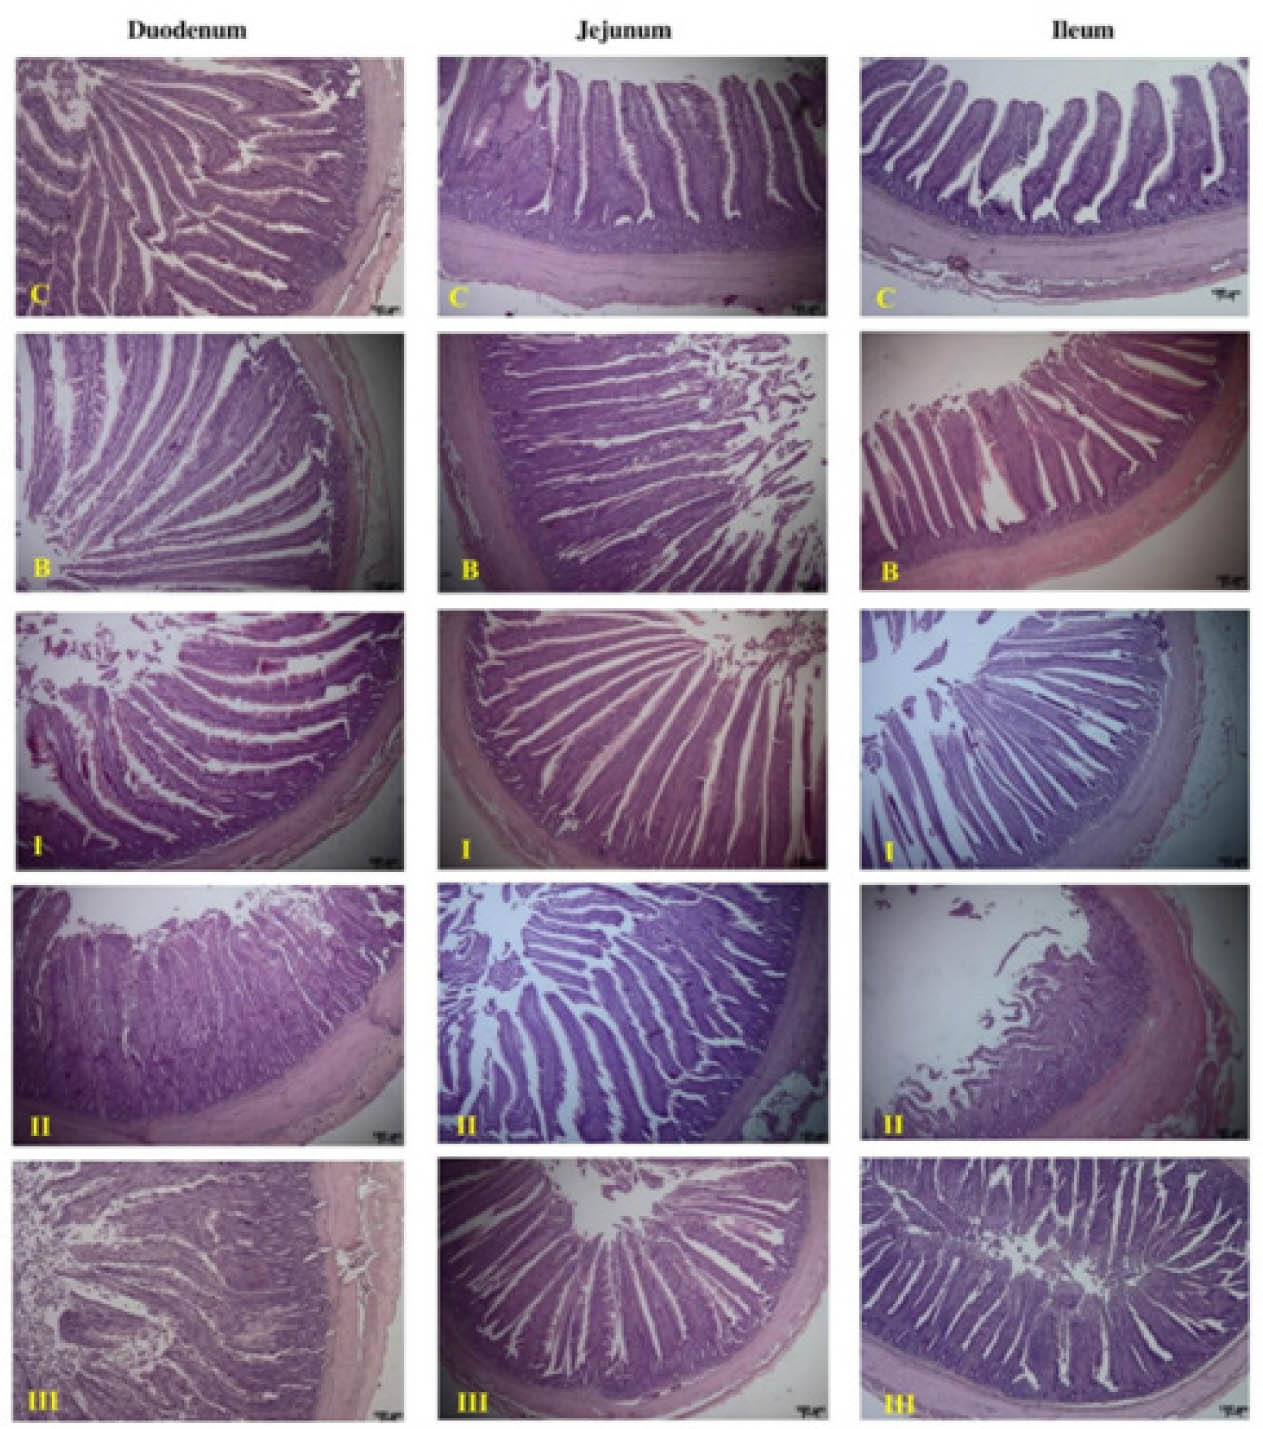
Figure 7.
Small intestine morphology of laying hens at the end of 15 weeks.
C (control): water without additive; B (blank): water + emulsifier; I: water + CBD 20 mg/kg BW + emulsifier; II: water + CBD 40 mg/kg BW + emulsifier; III: water + CBD 80 mg/kg BW + emulsifier.
1) Duodenum: The surface area of the villi, villi height, crypt depth, and the ratio of villi height to crypt depth were significant among all the groups (P<0.05). The highest and lowest villi heights were observed in groups I and II, respectively. Crypt depth showed the highest number in group III and the lowest in group B. The villi height/crypt depth ratio was the largest in group B and the lowest in group III (Table 11). The largest villi surface area was observed in group I, and the smallest in group II (Table 11). Histological examination of the duodenum revealed morphological changes across the CBD treatment groups. In group I, the intestinal villi exhibited “leafy” margins with well-preserved intervillous spaces. The villi appeared elongated and oval, and the crypts were organized in two distinct rows. Vascularization was limited to a single vessel extending up to one-third of the villus height, with no visible vasculature in the conglomerates formed by fused villi. The overall villus structure suggested an active state of intestinal remodeling. In group II, the villi were thin, elongated, and often fused into irregular, multi-element conglomerates with an undetermined structure. Numerous polymorphic crypts were present, extending up to half the height of the villi. A single vessel could be observed following the full length of individual villi; however, no vascular elements were visible within the fused conglomerates. The intestinal structure was non-homogenous. In group III, the villi appeared considerably thickened, with elongated crypts extending up to half the villus height and migrating toward the apex. The margins of the villi were blurred due to reduced spacing and partial fusion, although regions with locally increased intervillous distances were also noted. Vascular elements appeared as isolated vessels or fragmented remnants within the villi, likely resulting from degenerative changes. The histological profile was highly heterogeneous, indicating high disruption of the standard intestinal structure (Figure 7).
2) Jejunum: All the parameters showed significant differences among the groups (P<0.05). The highest villi, least crypt depth, and highest villi height/crypt depth ratio was observed in group I (Table 11). Additionally, the largest villi surface area was observed in group I and the smallest in group II and the control (Table 11). In group I, the microscopic structure of the jejunal tissue showed that the intestinal villi were elongated and slender, terminating in sharply pointed apices and exhibiting leaf-like margins. The villi were organized in 3–4 distinct rows. One to two blood vessels were observed extending along the entire length of the villi. This histological profile indicated a stimulated intestinal state, and the observed vascularization suggested increased absorptive activity. In group II, the jejunal tissue displayed characteristics consistent with active remodeling. Progressive structural changes were evident, with villi presenting serrated, leafy margins and pointed tips. The crypts were markedly enlarged and arranged in two rows. Vascular elements (1–2 vessels) were observed extending up to half the height of the villi. These findings suggest ongoing intestinal adaptation, and further extension of the supplementation period may be necessary to fully characterize the outcome of the remodeling process and confirm enhanced intestinal function. In group III, the histological structure of the jejunum was disrupted, consistent with progressive intestinal degeneration. Only fragmented remnants of microvilli were present, characterized by reduced and damaged apices. Additionally, a high number of goblet cells were observed.
3) Ileum: The parameters differed significantly among experimental groups (P<0.01). Group III showed the shortest villi. However, the largest villi surface area was observed in the control and group I, whereas the smallest was found in group III (Table 11). The highest villi height/crypt depth ratio belonged to group I (Table 11). Histological analysis of the ileum revealed that in group I the villi were single, well-defined, and arranged in two distinct rows, with well-preserved intervillous spaces. The villi displayed serrated, leaf-like margins and ended in rounded or triangular apices. A single blood vessel extended along the length of each villus. The overall intestinal structure appeared normal and undisturbed. In group II, the villi exhibited a “knee-shaped” morphology with smooth margins and sharply pointed apices, lacking the typical leaf-like serrations. While the intervillous spaces remained visible and the crypts were arranged in two rows, the bases of the villi showed partial fusion, leading to blurred separation between individual structures. An increased number of goblet cells was observed at the villus margins, contributing to the detachment and degeneration of partial or entire villi. These changes resulted in a reduced absorptive surface area and impaired intestinal function. Additionally, thickening of the intestinal musculature was noted, and blood vessels were absent within the conglomerates formed by fused villi. In group III, the histo-logical structure of the ileum was markedly heterogeneous and severely disrupted. The intestinal lumen appeared considerably narrowed. Villi were either thinned or markedly thickened, with variable margins ranging from smooth to serrated. The morphology shifted from finger-like to irregular, tentacle-like structures with blunt ends. The majority of villi lacked visible blood vessels due to extensive villus fusion. The overall appearance was inconsistent, with no reproducible structural patterns, indicating a pathological and degenerated intestinal state.
Discussion
Water plays a vital role in nearly all physiological processes in poultry; therefore, maintaining good drinking water quality is fundamental to optimal health and production (Mohamed et al., 2025).
Performance
In a study conducted by Jing et al. (2017), the diet of 19-week-old Lohmann White hens was supplemented with 4% and 8% hemp oil (HO) and HempOmega (HΩ) for 6 weeks. No significant differences exist among the groups for performance parameters; however, a significant interaction was seen between treatments and time for feed intake and FCR. Additionally, with the supplementation of 3% and 6% HO and HΩ for 21 days, no effects on performance were observed in 150-day-old mixed-sex Ross 308 in the same study (Jing et al., 2017). On the contrary, a significant reduction in average daily feed intake and average daily gain was seen in a 1-day-old male Ross 308, fed with 2.5% hempseed within 6 weeks (Mahmoudi et al., 2015). Furthermore, in another study, 19-week-old Bovan White hens were supplemented with 4%, 8%, and 12% HO and 10% and 20% hemp-seed for 12 weeks. The treatments did not affect the hen-day egg production (Gakhar et al., 2012). By contrast, Skřivan et al. (2019) showed that using 3% hempseed in the diet of Lohmann Brown hens for 12 weeks significantly increased egg production. No research has been done so far on the effects of CBD on laying hens. Even though the composition of hempseed and HO differs from the water-soluble purified CBD, it could be beneficial to compare the results. In the current study, no significant differences exist among the groups (Table 5), which aligns with the findings of other studies. However, the effect of time was significant for feed intake in groups II and III (CBD at the level of 40 and 80 mg/kg BW) compared to the control group (Figure 1).
BW
In general, the lower feed intake amount over time for groups II (40 mg/kg BW) and III (80 mg/kg BW) was accompanied by a lower increase in the final BW (P<0.05). These effects might be due to the bioavailability and bioaccessibility of aqueous CBD. Bioavailability is defined as the total consumed substance in the body circulation. Bioaccessibility is the compound quantity excreted from the food and is accessible for absorption by epithelial cells in the intestines (Galanakis, 2017). Studies on animals have shown low bioavailability of CBD with oral administration, 16% in Rhesus monkeys (Millar et al., 2018) and 13%–19% bioavailability in dogs (Samara et al., 1988). However, in a research conducted by Mozaffari et al. (2021), it was recommended to use CBD with a meal containing high fat to raise the bioaccessibility of human intestine cells.
On the contrary, in a clinical trial with 120 children who had Dravet syndrome and drug-resistant seizures, participants randomly received either 20 mg/kg/day of oral CBD or a placebo over a 14-week period. Twenty-eight percent of children in the CBD group experienced a reduced appetite, compared to only 5% in the placebo group (Devinsky et al., 2017). In another study, 150 children and adolescents with autism were enrolled in a crossover-type randomized controlled trial. The groups received either a solution with purified CBD and Δ9-THC or cannabis extract. Individuals with 20–40 kg and more than 40 kg BW, were given CBD 10 mg/kg/day and CBD 7.5 mg/kg/day, respectively, for 12 weeks. Both treatments showed an appetite reduction. Although appetite noticeably decreased in participants who had higher BMI (Aran et al., 2021).
The effect of the liver should also be considered in the CBD absorption procedure as CBD is a dose-dependent substance. It has been proven that the ECS, which maintains homeostasis in the body, exists in poultry (Oltrabella et al., 2017). This system consists of endocannabinoids, receptors (CB1 and CB2), and enzymes. The CB1 and CB2 receptors which are presented in the central and peripheral nervous systems respectively, are activated by CBD, allowing the ECS to be stimulated and probably regulate the appetite.
Egg assessment
Although the hens were randomly assigned to the treatment groups, a significant difference in egg weight was observed on day 0, before the start of CBD administration. This difference likely reflects normal biological variation among the birds, which can occur even with proper randomization. In the current study, CBD did not affect the egg weight, eggshell strength, and thickness. Kanbur et al. (2023) discovered that applying hempseed oil in the diet of White Leghorn hens for 84 days did not change the eggshell quality. Contrastingly, using different levels of hempseed cake (0, 10, 20, and 30%) for 16 weeks improved eggshell strength, whilst eggshell thickness was not influenced by the hempseed cake inclusion (Kasula et al., 2021). Further research is required to show the effects of CBD on egg quality in commercial laying hens.
Sensory evaluation of the eggs
Egg yolk color is a key factor for consumers, following price and shell color (Mendes et al., 2017). Intensified colors are typically seen as a sign of healthy hens raised on a balanced diet and an increasing demand for eggs with richer yolk pigmentation exists in the market (Saleh et al., 2021). Several factors may influence yolk color, including individual differences among birds, level of stress, dietary fats, antioxidants, feed composition, and the quantity and type of xanthophylls (Nys, 2000; Mortensen, 2006). Even though poultry cannot synthesize carotenoids, they acquire these substances from the diet (Nys, 2000). Following enzymatic breakdown, carotenoids are released and absorbed in the small intestine (Hudon, 1994). Subsequently, free carotenoids are emulsified into portomicrons (oil droplets) and transported to the liver. Portomicrons are incorporated into very-low-density lipoprotein (VLDL) molecules in the liver hepatocytes and delivered to the yolk (Surai et al., 2001; Bortolotti et al., 2003).
In the current study, the yolk color was sharper in all groups except the control. Considering that the diet composition was the same for all the groups, this effect might be owing to the existence of rapeseed leci-thin emulsifier in the drinking water of the four groups. Ferreira et al. (2022) observed a higher yolk color in hens fed a corn–soybean meal diet supplemented with 0.01% emulsifier. Likewise, pigmentation improvement was detected in the egg yolk color of hens fed with 2% and 3% of soy gum to a corn–soybean meal diet (Souza et al., 2019). In another study, Zurak et al. (2024) examined different levels of rapeseed oil (2%, 3%, and 4%) with (0.05%) and without emulsifier on the carotenoids deposition in the egg yolk of Lohmann Brown hens. The results showed that rapeseed oil and emulsifier improved lipid digestion and absorption, resulting in higher carotenoid bioavailability and distribution in the yolk. In a study conducted by Berkhoff et al. (2020) on the sensory perception and features of farm-produced eggs, the yolk color was the key factor for the panelists in distinguishing eggs from various production systems. Furthermore, in a survey performed in Brazil on 1,567 individuals, a more intense egg yolk color was perceived as having a higher quality by the majority of respondents (Fluck et al., 2023).
Corticosterone measurement
Recent research indicates that CBD may help alleviate pain, stress, anxiety, and depression (Suraev et al., 2020; Stanciu et al., 2021; Villanueva et al., 2022). Based on recent studies, CBD has anti-anxiety and stress-relieving properties. Some studies have reported lower anxiety and stress following the use of cannabis flowers, particularly those with higher CBD content (Stith et al., 2020). Additionally, CBD may enhance CB1 receptor signaling by increasing levels of endocannabinoids as CB1 agonists (Pertwee, 2008). In the present study, results using CBD 20 mg/kg of BW reduced corticosterone levels after 15 weeks. The stress level depends on various factors. Because the sampling in this experiment was pooled, individual differences among hens should be considered as well. As CBD is a dose-dependent substance, specifying an optimal dosage for relieving stress is crucial, taking into account the animal species and rearing conditions.
Gut morphology
Based on the results of the current study, groups II and III (CBD 40 and 80 mg/kg BW, respectively) exhibited a reduced villi surface area and lower villi height/crypt depth ratio in most intestinal sections, which suggests the lower absorption capacity of intestinal cells following the lower feed intake in these two groups. In a study conducted by Sopian et al. (2024) on broiler chickens, various amounts of C. sativa residue (leaves and stalks) were used. The duodenum and jejunum structure were not affected. However, the ileum of the 1% cannabis residue group had a higher villi height/crypt depth ratio. According to Sana et al. (2024), different levels of hempseed in the broiler diets did not affect the jejunum histology. Additionally, higher duodenal villi height and villi height/crypt depth ratio were observed following the hempseed cake inclusion in the slow-growing broilers' diet (Tufarelli et al., 2023).
According to microscopic analysis, the duodenum and ileum of group I (CBD 20 mg/kg BW) exhibited the highest structural changes in the intestinal tissue, characterized by the formation of new villi. Group II (CBD 40 mg/kg BW) appeared to represent an intermediate stage. In group III (CBD 80 mg/kg BW), changes in the structure of individual villi and villus clusters were observed. The formation of deformed multivillous conglomerates, likely resulting from excessive enterocyte proliferation, hindered the identification and evaluation of individual villi. A study investigated the impact of CBD-rich cannabis extract (CRCE) administered to mice at doses of 61.5, 184.5, and 615 mg/kg in sesame oil over 2 weeks. The findings revealed that high doses led to significant alterations in gut microbiota, notably an increase in Akkermansia muciniphila (a bacterial species recognized as a probiotic). However, this microbial shift was accompanied by pro-inflammatory responses, including elevated expression of cytokines in colon tissue. Additionally, a marked decrease was noted in Muc2 expression, a gene crucial for maintaining gut integrity. These results suggest that while certain microbial changes might be beneficial, high-dose CBD could compromise intestinal health by promoting inflammation and disrupting mucosal barriers (Skinner et al., 2020).
Conclusions
The study results showed that higher doses of CBD (40 and 80 mg/kg BW) significantly reduced feed intake and villi height in different gut segments within 15 weeks without affecting other performance parameters, such as egg production percentage or FCR. Furthermore, using the emulsifier in water improved yolk pigmentation in all groups, regardless of CBD dosage. In this study, we demonstrated that hens receiving the lowest CBD dose (20 mg/kg BW), showed a significant reduction in corticosterone levels and beneficial alterations in intestinal morphology, including increased villus height, reduced crypt depth, and enhanced absorptive surface area, highlighting its potential role in alleviating stress and maintaining body health. In conclusion, although CBD exhibits potential as a functional additive for laying hens, more extensive investigations are essential to determine the safe optimal dose and clarify its efficacy and practical implementation in commercial poultry production.
Notes
[23] Financial disclosure Competing interests
The authors declare that they have no known competing financial interests or personal relationships that could have appeared to influence the work reported in this paper.
[24] Contributed by Authors contributions
Sepideh Fallahi: writing – original draft, conceptualization, investigation, data cu-ration, formal analysis, project administration. Łukasz Bobak: supervision, methodology, formal analysis, data curation. Anna Lipińska: methodology, visualization, formal analysis, writing – review and editing. Muhammad Umair Asghar: project administration, investigation (sample collection). Katarzyna Olejnik: project administration, investigation (sample collection). Sebastian Opaliński: supervision, conceptualization, resources, validation, writing – review and editing, project administration. All authors have read and approved the final manuscript.