
Table 1.
Effects of YPF-P on growth performance in chicks
| Items | YPF-P levels (mg/kg feed) | SEM | P-value | ||||
|---|---|---|---|---|---|---|---|
| 0 g/kg | 1 g/kg | 2 g/kg | 4 g/kg | linear | quadratic | ||
| BW (g) | |||||||
| 3 d | 28.92 | 28.95 | 28.58 | 29.16 | 0.19 | 0.615 | 0.678 |
| FBW (g) | |||||||
| 3 to 37 d | 390.9 bc | 385.29 c | 408.77 a | 397.74 b | 2.27 | 0.015 | 0.116 |
| ADFI (g/d) | |||||||
| 3 to 37 d | 23.87 | 23.87 | 23.80 | 23.78 | 0.73 | 1.000 | 0.959 |
| ADG (g/d) | |||||||
| 3 to 37 d | 10.65 bc | 10.48 c | 11.18 a | 10.84 b | 2.29 | 0.017 | 0.100 |
| FCR (g/g) | |||||||
| 3 to 37 d | 2.24 ab | 2.28 a | 2.13 c | 2.20 b | 0.01 | < 0.001 | 0.003 |
[i] Note: a, b, c within a row with different letters mean significant differences at P<0.05 level. Means within a row followed by the same letter or with no letter do not differ significantly (P>0.05). SEM, total standard error of mean. Values were expressed as means ± SEM. ADFI, average daily feed intake; BW, body weight; FBW, final body weight; ADG, average daily weight gain; FCR, feed conversion ratio.
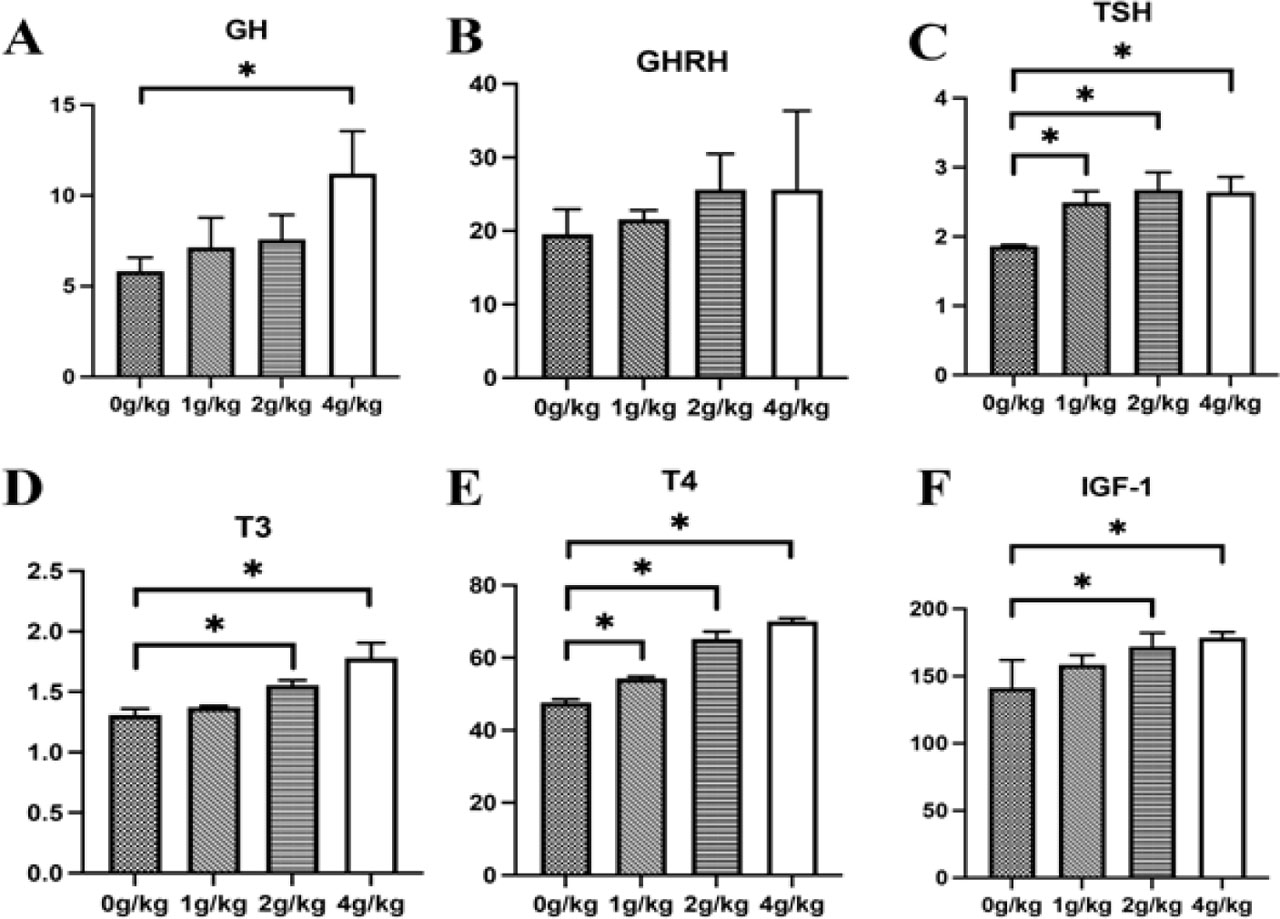
Figure 1.
Effects of YPF-P on levels of serum growth-related hormones in chicks. Data represent mean ±SEM (n=8). Bars in the figure with the * differ significantly (P<0.05).
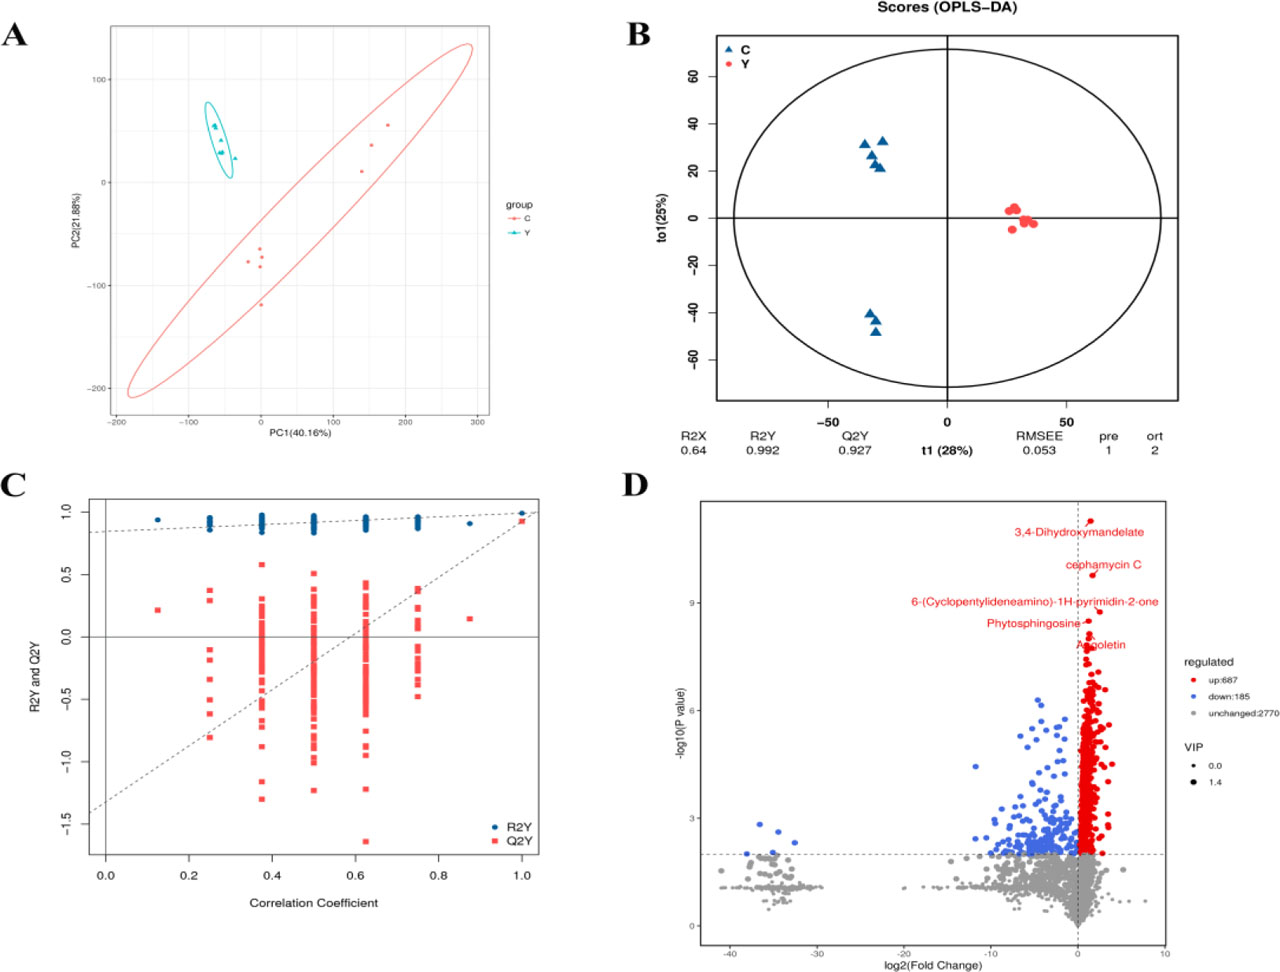
Figure 2.
Multivariate analysis of the untargeted LC-QTOF/MS metabolomics. (A): PCA scores plot. (B): OPLS-DA scores plot. (C): Permutation test plot. (D) The volcano plot shows the differential metabolites between 0 g/kg group and 2 g/kg YPF-P group (log2 Y/C), −log10 (0.05) = 1.30 − log10 (P-value) > 1.30 means significant difference. The red dot indicates log2FC > 0 and the metabolite is up-regulated. The blue dot indicates log2FC < 0 and the metabolite is downregulated. The grey dot means no significant difference (−log10 (P-value) < 1.3) (C is the serum control group (0 g/kg), and Y is the serum 2 g/kg YPF-P addition group, C and Y labels apply to plots A and B, respectively.) R2Y represents the model’s fit to the data, and Q2Y indicates its predictive ability.
Table 2.
The quantitative enrichment analysis results of serum metabolites in C vs Y group chicks
| Pathway | Hits | P-value | FDR |
|---|---|---|---|
| Tryptophan metabolism | 4 | 2.52E-08 | 5.04E-07 |
| Sphingolipid metabolism | 3 | 3.71E-05 | 0.0004 |
| Phenylalanine metabolism | 4 | 0.0015 | 0.0076 |
| Steroid hormone biosynthesis | 6 | 0.0017 | 0.0076 |
| Steroid biosynthesis | 1 | 0.0028 | 0.0076 |
| Primary bile acid biosynthesis | 1 | 0.0028 | 0.0076 |
| Lysine degradation | 3 | 0.0030 | 0.0076 |
| Pyrimidine metabolism | 2 | 0.0031 | 0.0076 |
| Folate biosynthesis | 1 | 0.0035 | 0.0076 |
| Vitamin B6 metabolism | 3 | 0.0038 | 0.0076 |
| Glycine, serine and threonine metabolism | 4 | 0.0049 | 0.0089 |
| Sulfur metabolism | 1 | 0.0053 | 0.0089 |
| Arginine biosynthesis | 3 | 0.0066 | 0.0094 |
| Arginine and proline metabolism | 6 | 0.0066 | 0.0094 |
| Drug metabolism – other enzymes | 1 | 0.0090 | 0.0119 |
| Glycerophospholipid metabolism | 1 | 0.0116 | 0.0139 |
| Biotin metabolism | 1 | 0.0118 | 0.0139 |
| Porphyrin metabolism | 2 | 0.0131 | 0.0146 |
| Purine metabolism | 3 | 0.0229 | 0.0241 |
| Terpenoid backbone biosynthesis | 1 | 0.0320 | 0.0320 |
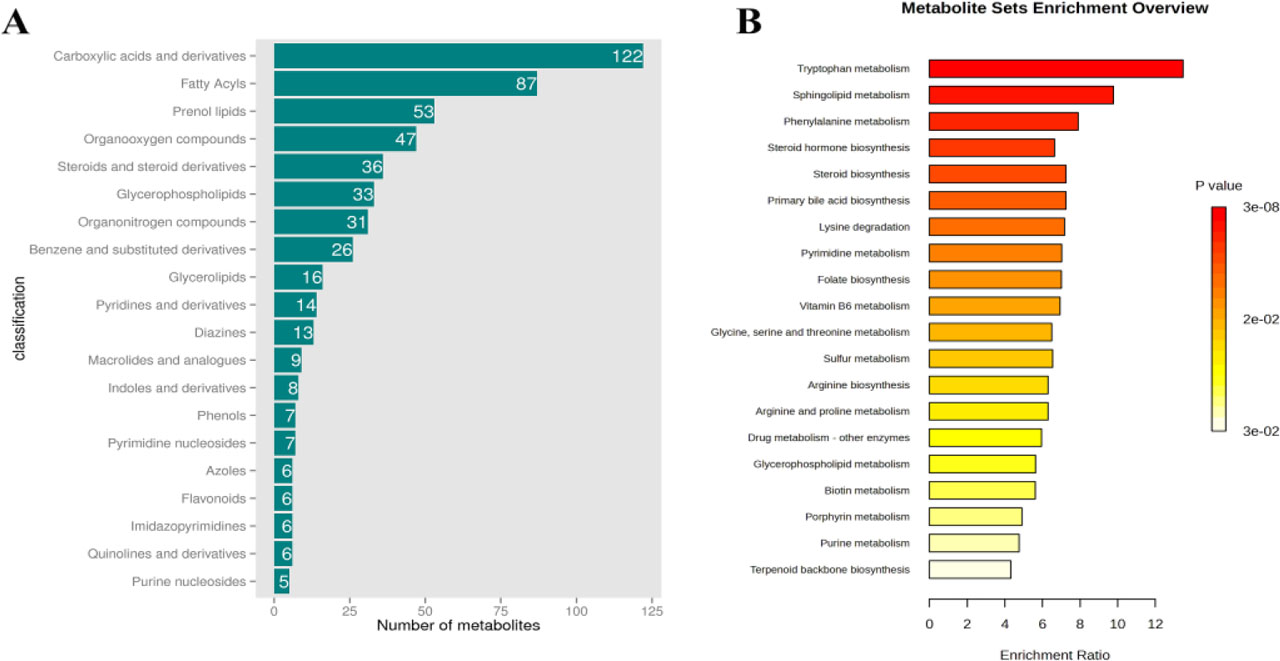
Figure 3.
(A): Differential metabolite classification map. (B): Pathway enrichment analysis of differential metabolites. The enrichment ratio in the x-axis indicates the ratio of the number of differential metabolites annotated to the pathway.
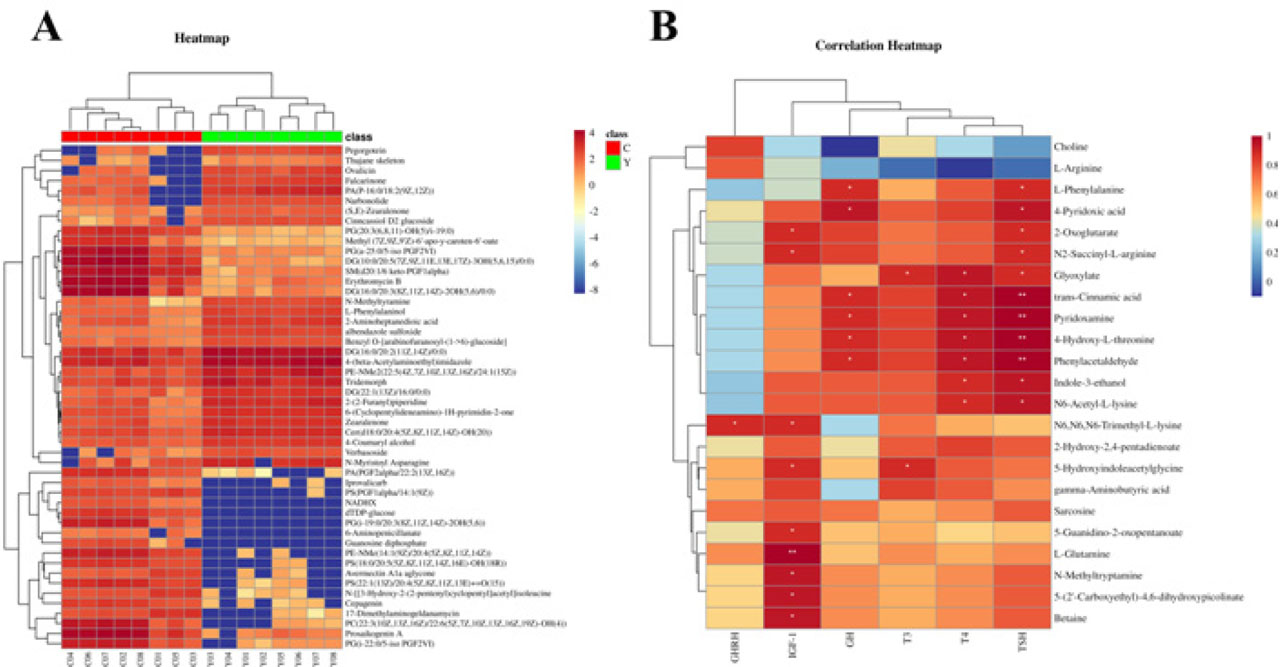
Figure 4.
(A): Heatmap of the hierarchical clustering of up- and down-regulated Top25 enriched metabolites in the serum contents of YPF-P vs control groups chicks. (B): The correlation heat-map between amino acid metabolism-related metabolites and growth-related hormones in Group C vs Group Y. Correlation was performed using data from the same 8 individual animals per group for both metabolomic and hormonal measurements. (Panel A: C refers to the serum control group (0 g/kg), and Y refers to the serum 2 g/kg YPF-P addition group).