
Table 1.
Primers used for detection of target genes
| Gene name | Primer sequence |
|---|---|
| GAPDH-F | ACAAGGGTGAGGTTAAGGCAG |
| GAPDH-R | CCCTTAATGTGAGCAGAAGCC |
| CD4-F | GGTGGAAGTGAATCTGTGCTG |
| CD4-R | TCCATCTCTTTCCTGTCCACC |
| IL1B-F | AAGGAGACTACGACGACCTCA |
| IL1B-R | CCGGCTTTCGTTGCTGATTTG |
| MHC1-F | TGGATCAGACAGAATGAGGGG |
| MHC1-R | CACAGCCCCATACATCACCTGAA |
Table 2.
Effects of the experimental supplements on growth parameters of the rainbow trout, Oncorhynchus mykiss over 30 and 60 days supplementation. Control: probiotic-paraprobiotic free commercial diet; PRO: diet containing 1.5 × 10⁶ Bacillus subtilis (probiotic) CFU/g diet; PAR: diet containing 1.5 × 10⁶ CFU/g diet inactivated Bacillus subtilis (paraprobiotic); PRO + PAR: diet containing 1.5 × 10⁶ CFU/g diet probiotic + 1.5 × 10⁶ CFU/g diet paraprobiotic. IW: initial weight, FW: final weight, WG: weight gain, SGR: specific growth rate, FCR: feed conversion ratio, SR: survival rate
| Treatments | ||||||||
|---|---|---|---|---|---|---|---|---|
| Control | PRO | PAR | PRO + PAR | |||||
| IW (g) | 178.3±5.1 | 181.1±4.5 | 179.5±4.8 | 181.9±5.2 | ||||
| Day 30 | Day 60 | Day 30 | Day 60 | Day 30 | Day 60 | Day 30 | Day 60 | |
| FW (g) | 251.5±5.5 c | 325.9±7.5 C | 265.6±6.7 b | 378.9±8.2 A | 271.5±7.2 ab | 342.5±6.4 B | 282.5±7.4 a | 390.8±12.3 A |
| WG (%) | 29.1±2.5 b* | 82.5±4.2 C** | 31.8±2.2 ab# | 108.9±5.3 A## | 33.8±2.4 ab+ | 91.5±6.2 B++ | 35.6±3.5 a× | 115.4±6.5 A×× |
| SGR (%/day) | 1.02±0.02 b | 1.01±0.07 C | 1.35±0.05 a | 1.23±0.09 A | 1.28±0.03 a* | 1.08±0.07 B** | 1.35±0.4 a | 1.28±0.06 A |
| FCR | 1.38±0.02 a* | 1.22±0.05 A** | 1.28±0.03 b | 1.25±0.04 B | 1.28±0.02 b | 1.31±0.03 B | 1.14±0.01 c | 1.12±0.02 C |
| SR (%) | 97. 8±2.4 | 98. 5±2.5 A | 99. 5±1.5 | 96.8±2.3 A | 100% | 97.5±2.5 A | 100% | 96.4±2.6 A |
| Two-way ANOVA (P-value) | ||||||||
| IW | FW | WG | SGR | FCR | ||||
| PRO | 0.23 | 0.006 | 0.004 | 0.006 | 0.002 | |||
| PAR | 0.51 | 0.002 | 0.003 | 0.008 | 0.004 | |||
| PRO × PAR | 0.32 | 0.008 | 0.005 | 0.11 | 0.13 | |||
Table 3.
Effects of the experimental supplements on serum immune parameters of the rainbow trout, Oncorhynchus mykiss over 30 and 60 days supplementation. Control: probioticparaprobiotic free commercial diet; PRO: diet containing 1.5 × 10⁶ Bacillus subtilis (probiotic) CFU/g diet; PAR: diet containing 1.5 × 10⁶ CFU/g diet inactivated Bacillus subtilis (paraprobiotic); PRO + PAR: diet containing 1.5 × 10⁶ CFU/g diet probiotic + 1.5 × 10⁶ CFU/g diet paraprobiotic. Differences between the experimental treatments at day 30 are shown in lowercase subscripts (P<0.01). Differences between the experimental treatments at day 60 are shown in uppercase subscripts (P<0.01). Same symbols indicate no difference between day 30 and day 60 in each treatment (P<0.01)
| Treatments | ||||||||
|---|---|---|---|---|---|---|---|---|
| Control | PRO | PAR | PRO + PAR | |||||
| Serum components | Day 30 | Day 60 | Day 30 | Day 60 | Day 30 | Day 60 | Day 30 | Day 60 |
| Lysozyme activity U/ml) | 27.2±5.2 c * | 31.5±7.2 C* | 41.8±6.5 b | 55.3±5.1 B | 45.1±5.5 b# | 52.8±6.1 B# | 59.3±5.8 a | 71.5±7.5 A |
| ACH50 activity U/ml) | 10.2±3.1 b* | 12.5±2.2 C* | 15.8±2.4 b# | 20.5±2.5 B# | 19.1±2.3 a | 24.5±1.8 A | 23.1±2.1 a+ | 27.4±2.2 A+ |
| Total Ig (mg/ml) | 1.5±0.15 c* | 1.7±0.2 D* | 2.1±0.12 b | 2.4 ±0.1 C | 2.5±0.2 a | 3.4 ±0.15 B | 2.7±0.1 a | 3.9 ±0.2 A |
| Two-way ANOVA (P-value) | ||||||||
| Lysozyme activity | ACH50 activity | Total Ig | ||||||
| PRO | 0.002 | 0.004 | 0.003 | |||||
| PAR | 0.006 | 0.002 | 0.005 | |||||
| PRO × PAR | 0.007 | 0.006 | 0.009 | |||||
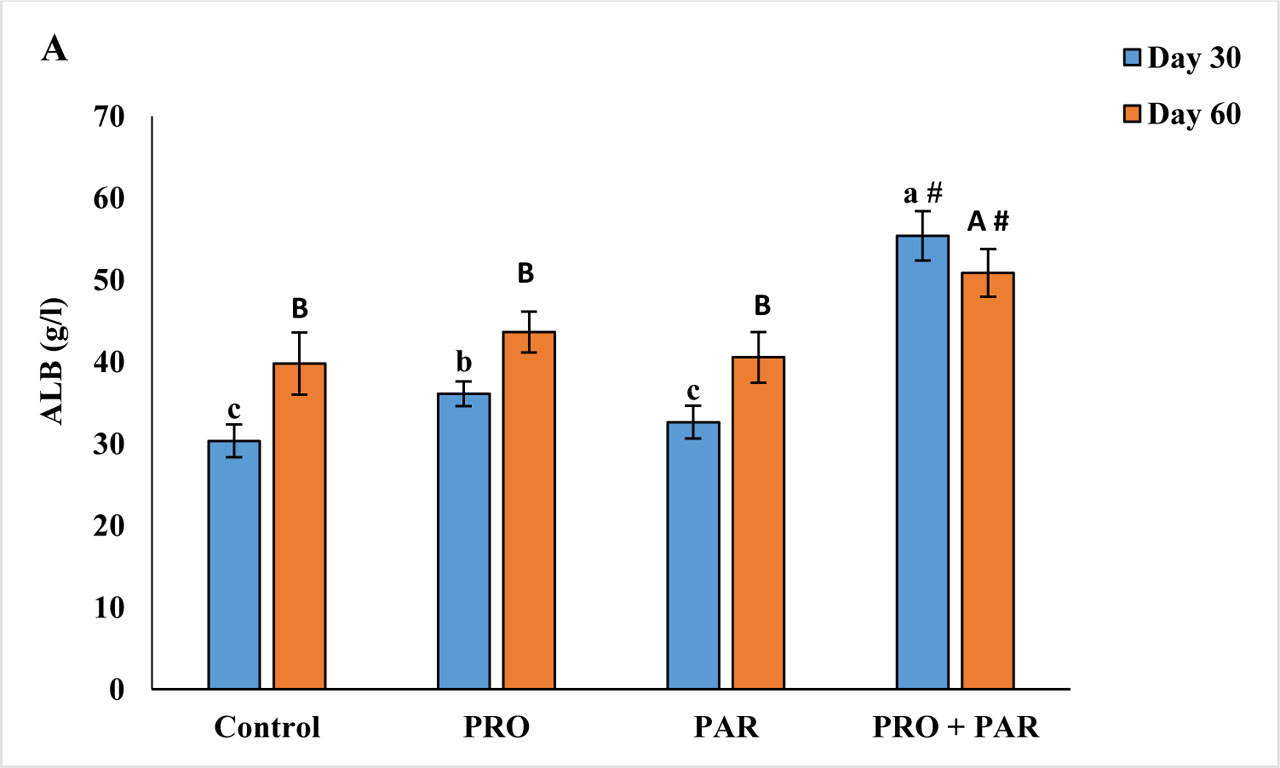
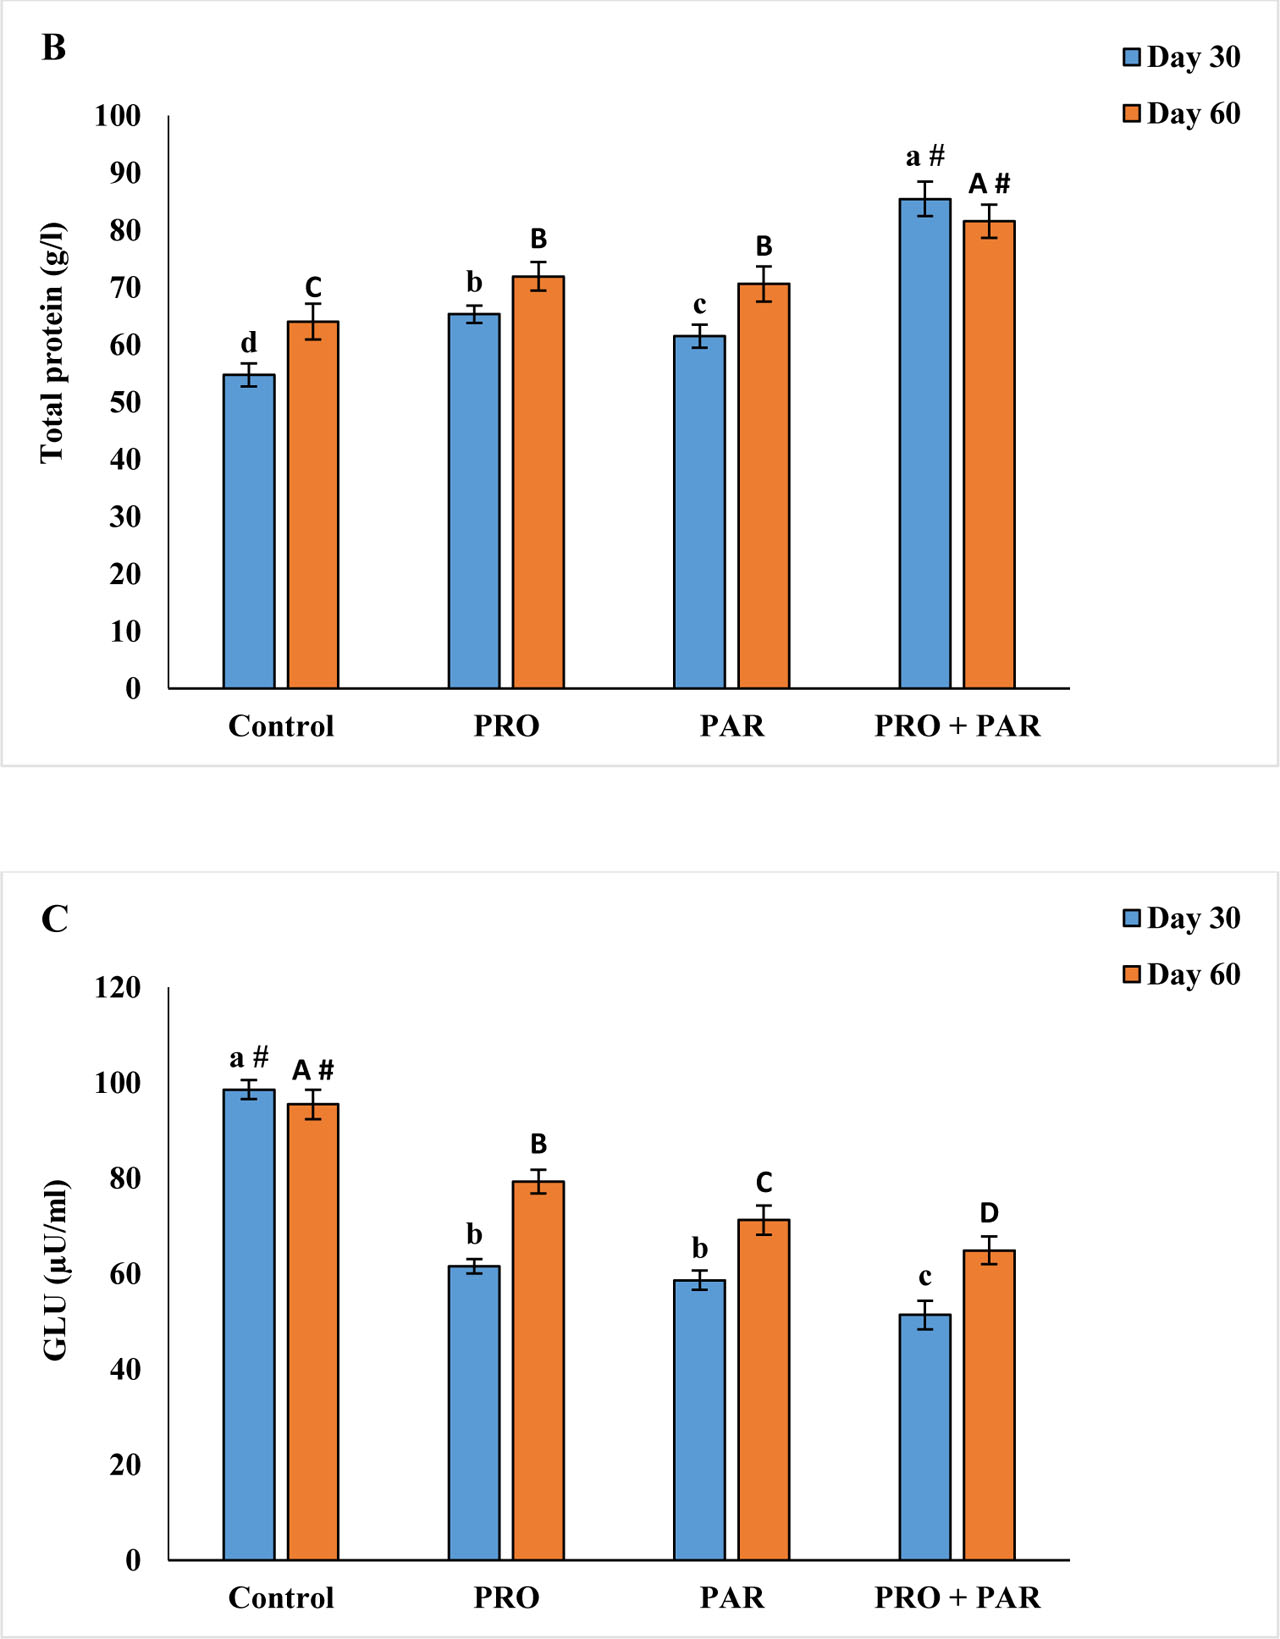
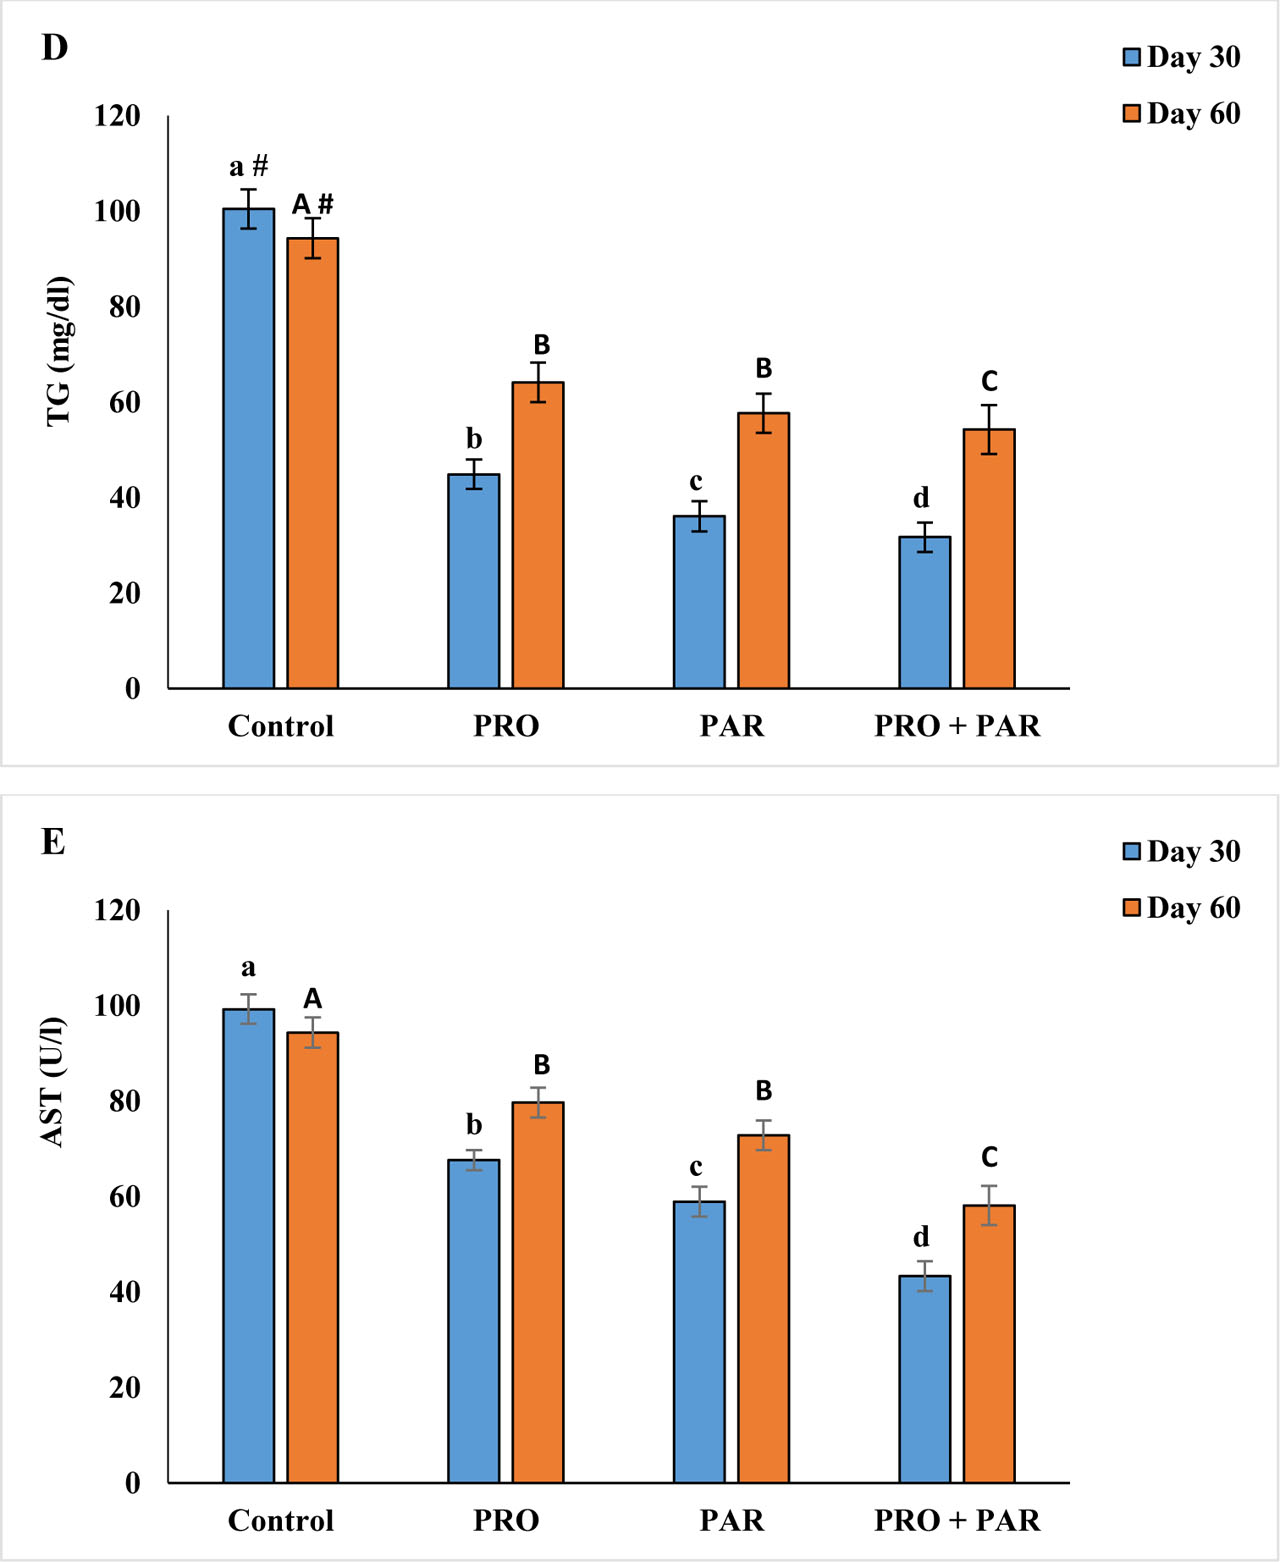
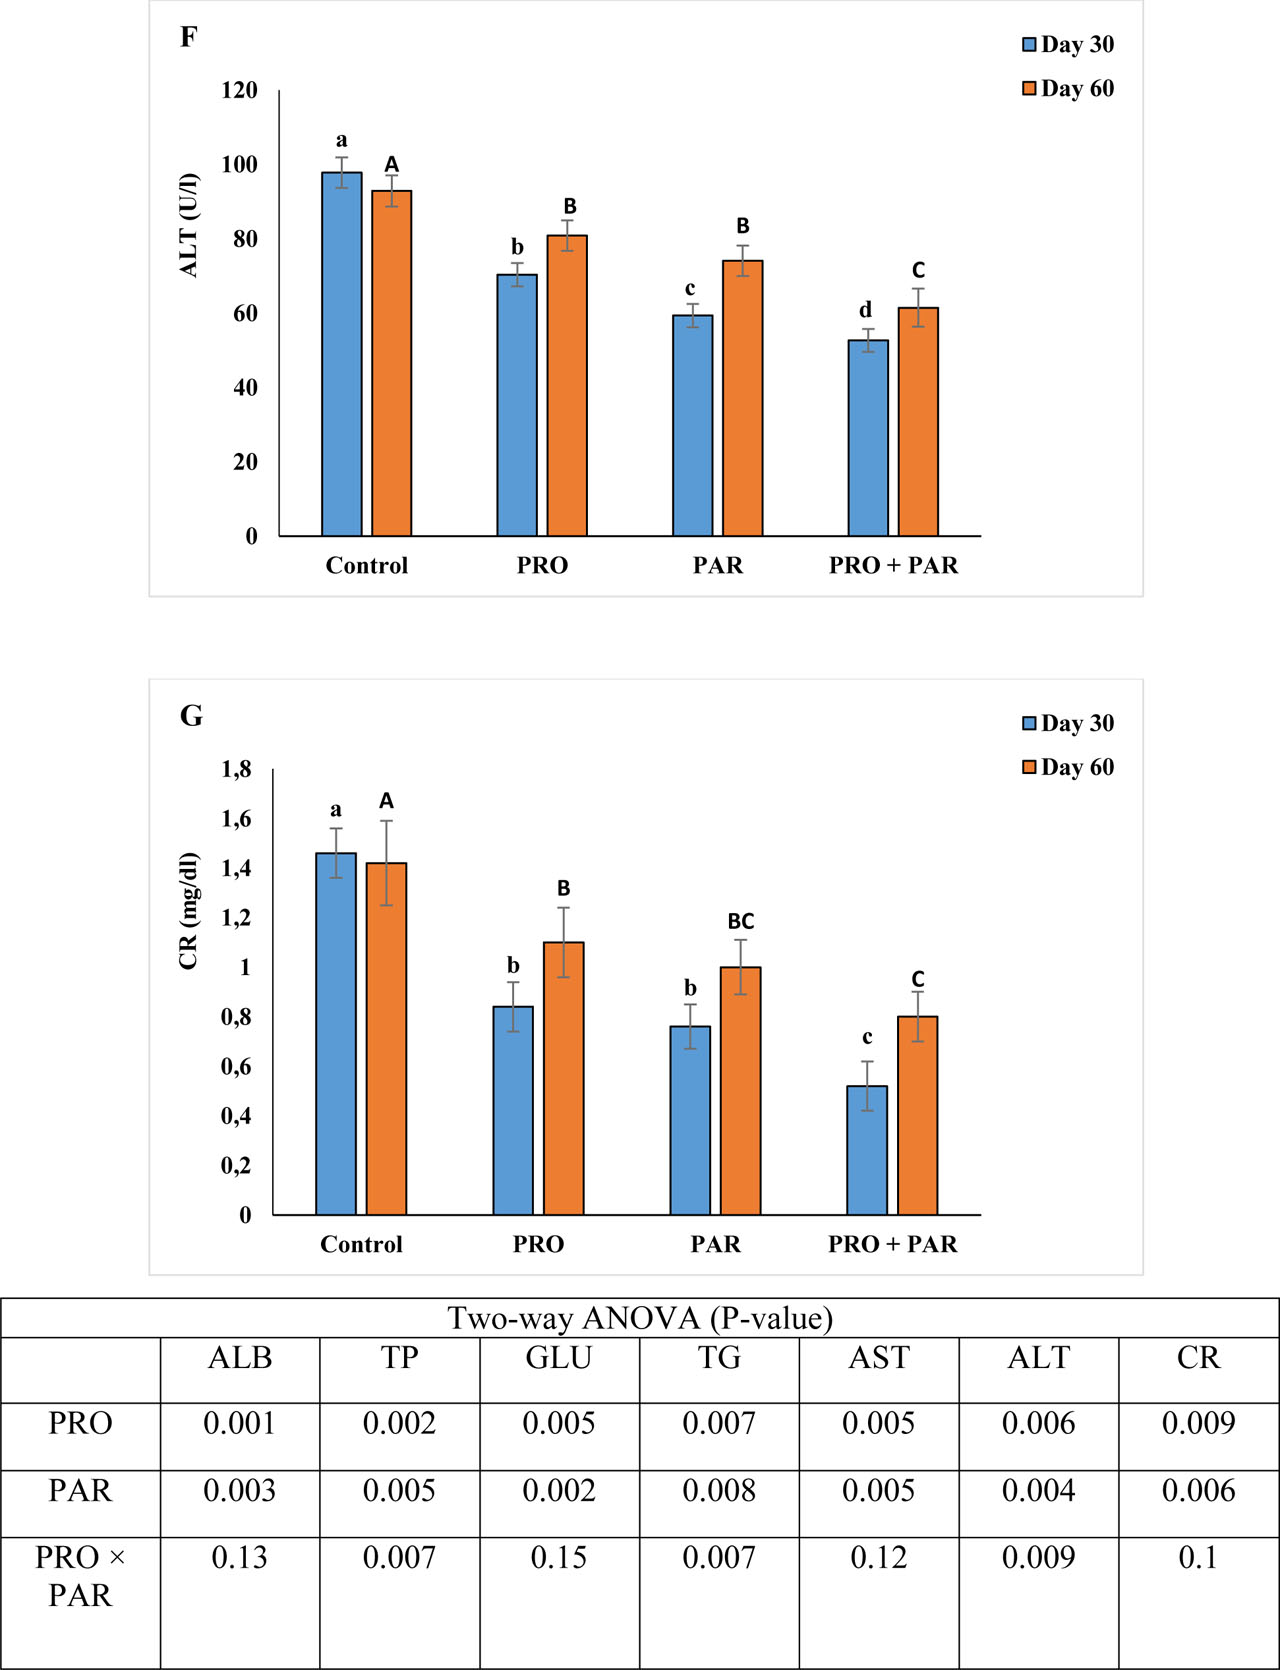
Figure 1.
Effects of the experimental supplements on serum biochemicals of the rainbow trout, Oncorhynchus mykiss over 30 and 60 days supplementation. Control: probiotic-paraprobiotic free commercial diet; PRO: diet containing 1.5 × 10⁶ Bacillus subtilis (probiotic) CFU/g diet; PAR: diet containing 1.5 × 10⁶ CFU/g diet inactivated Bacillus subtilis (paraprobiotic); PRO + PAR: diet containing 1.5 × 10⁶ CFU/g diet probiotic + 1.5 × 10⁶ CFU/g diet paraprobiotic. ALB: albumin, TG: triglyceride, GLU: glucose, AST: aspartate aminotransferase, ALT: alanine transaminase, CR: creatinine. Differences between the experimental treatments at day 30 are shown in lowercase subscripts (P<0.01). Differences between the experimental treatments at day 60 are shown in uppercase subscripts (P<0.01). Same symbols indicate no difference between day 30 and day 60 in each treatment (P<0.01)
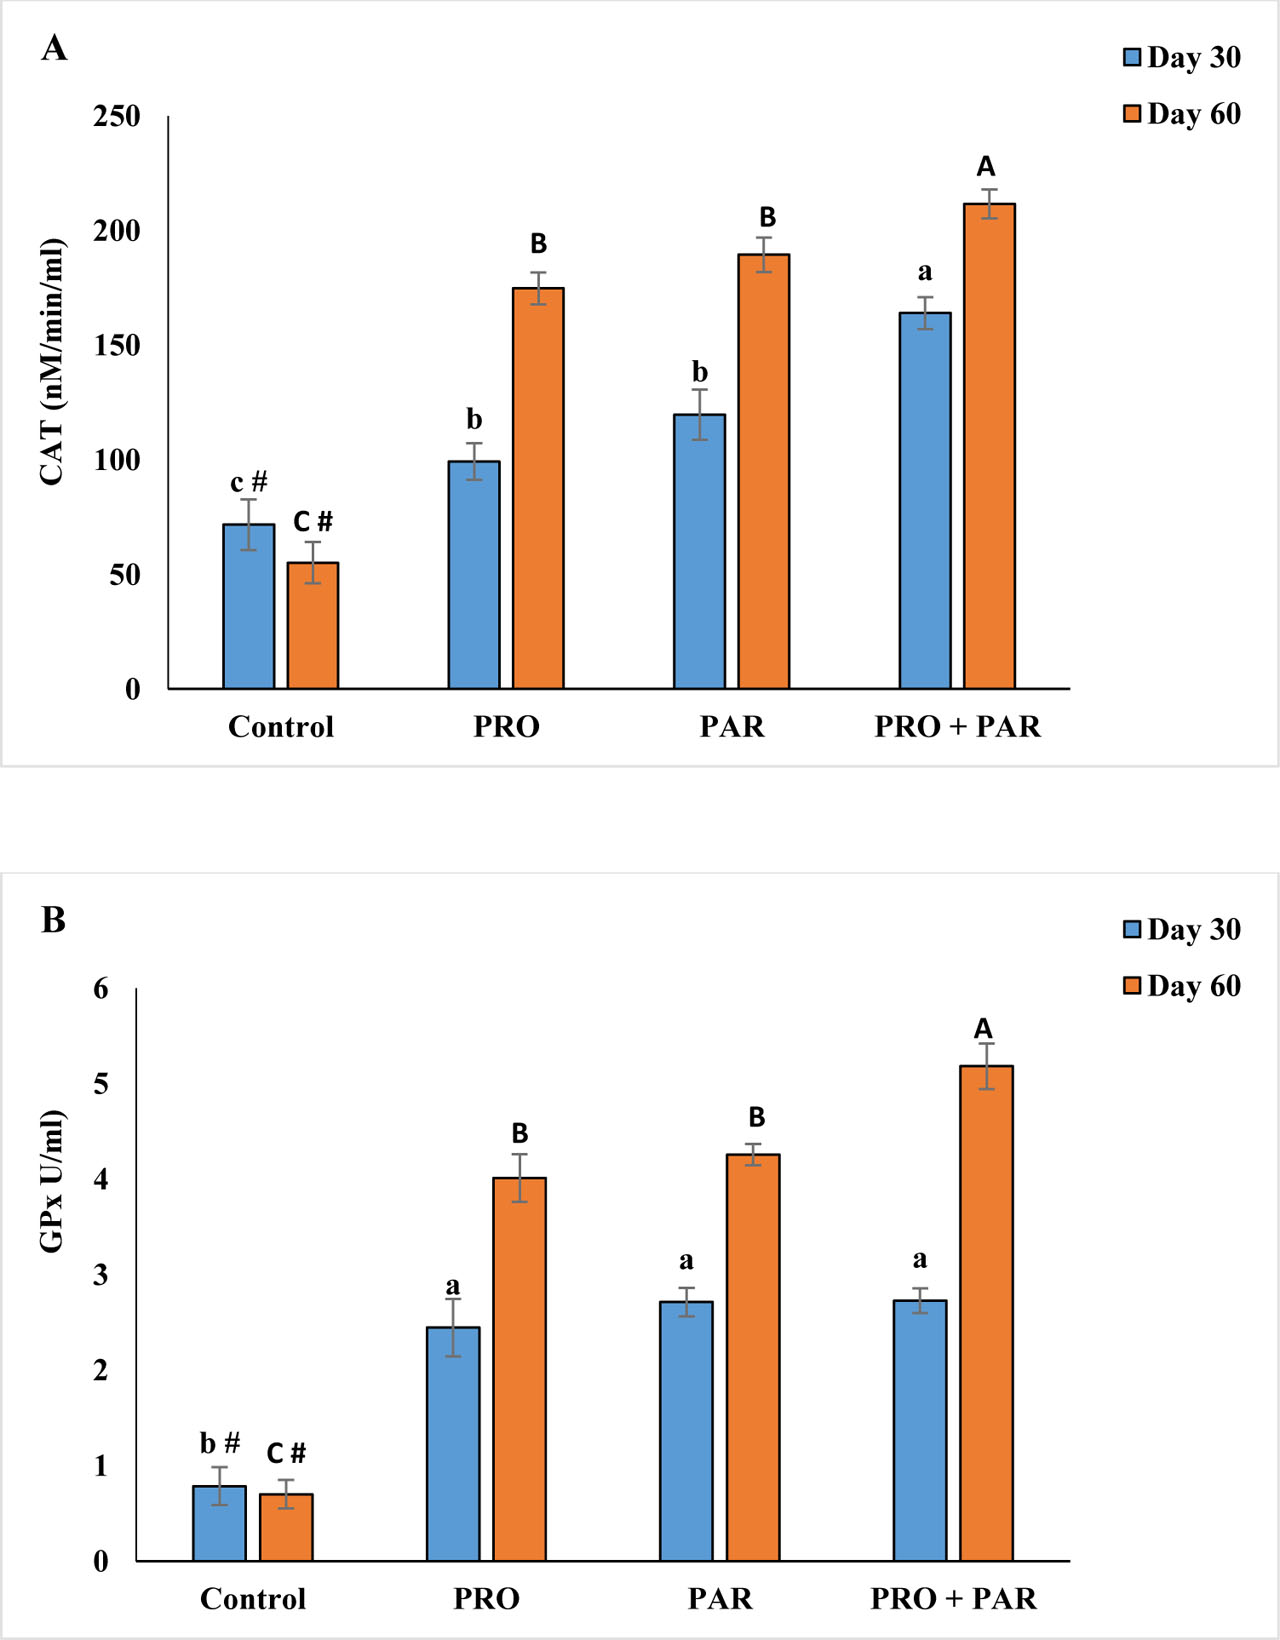
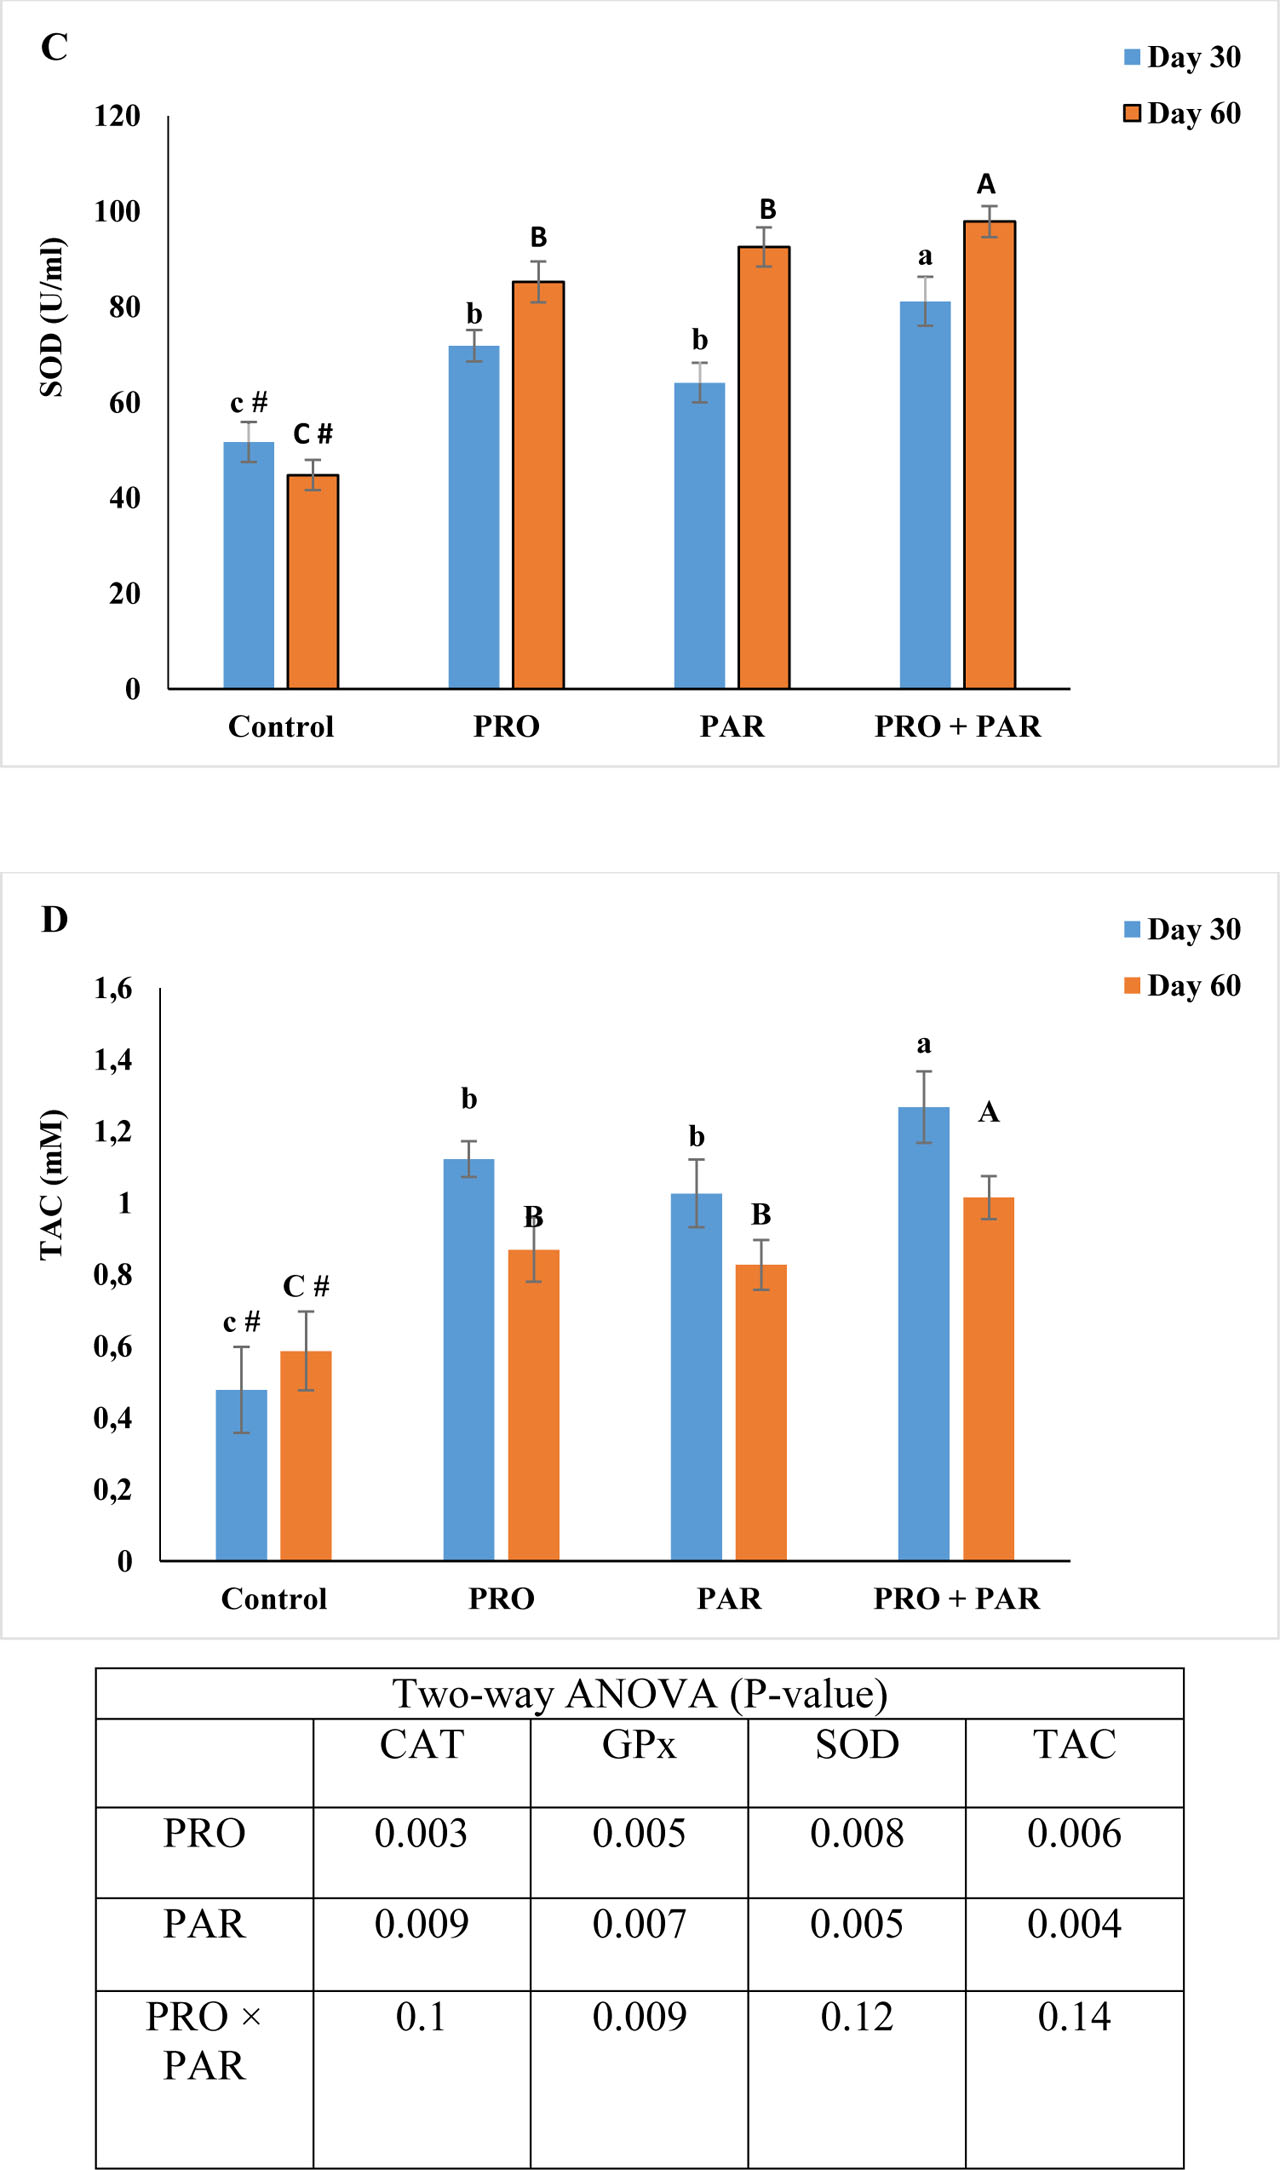
Figure 2.
Effects of the experimental supplements on antioxidant enzyme activities and total antioxidant capacity in the rainbow trout, Oncorhynchus mykiss over 30 and 60 days supplementation. Control: probiotic-paraprobiotic free commercial diet; PRO: diet containing 1.5 × 10⁶ Bacillus subtilis (probiotic) CFU/g diet; PAR: diet containing 1.5 × 10⁶ CFU/g diet inactivated Bacillus subtilis (paraprobiotic); PRO + PAR: diet containing 1.5 × 10⁶ CFU/g diet probiotic + 1.5 × 10⁶ CFU/g diet paraprobiotic. CAT: catalase, GPx: gluthatione peroxidase, SOD: superoxide dismutase, TAC: total antioxidant capacity. Differences between the experimental treatments at day 30 are shown in lowercase subscripts (P<0.01). Differences between the experimental treatments at day 60 are shown in uppercase subscripts (P<0.01). Same symbols indicate no difference between day 30 and day 60 in each treatment (P<0.01)
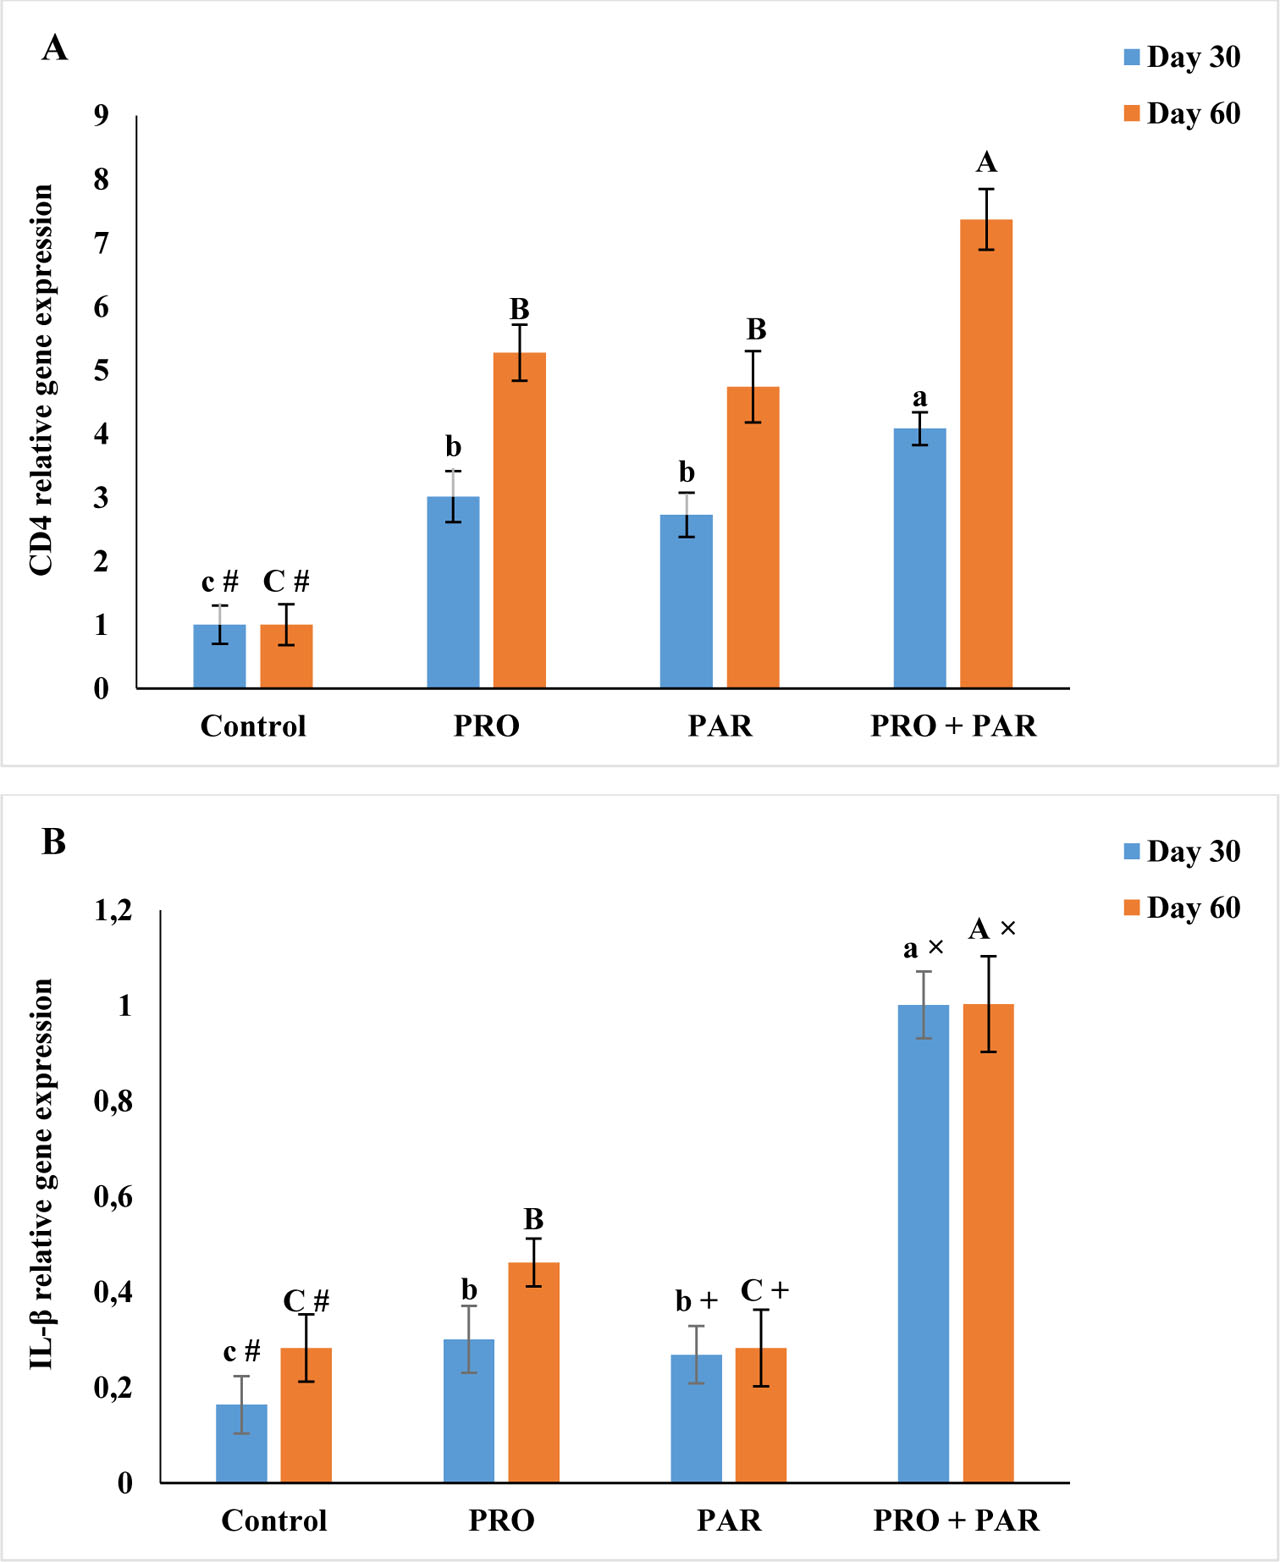
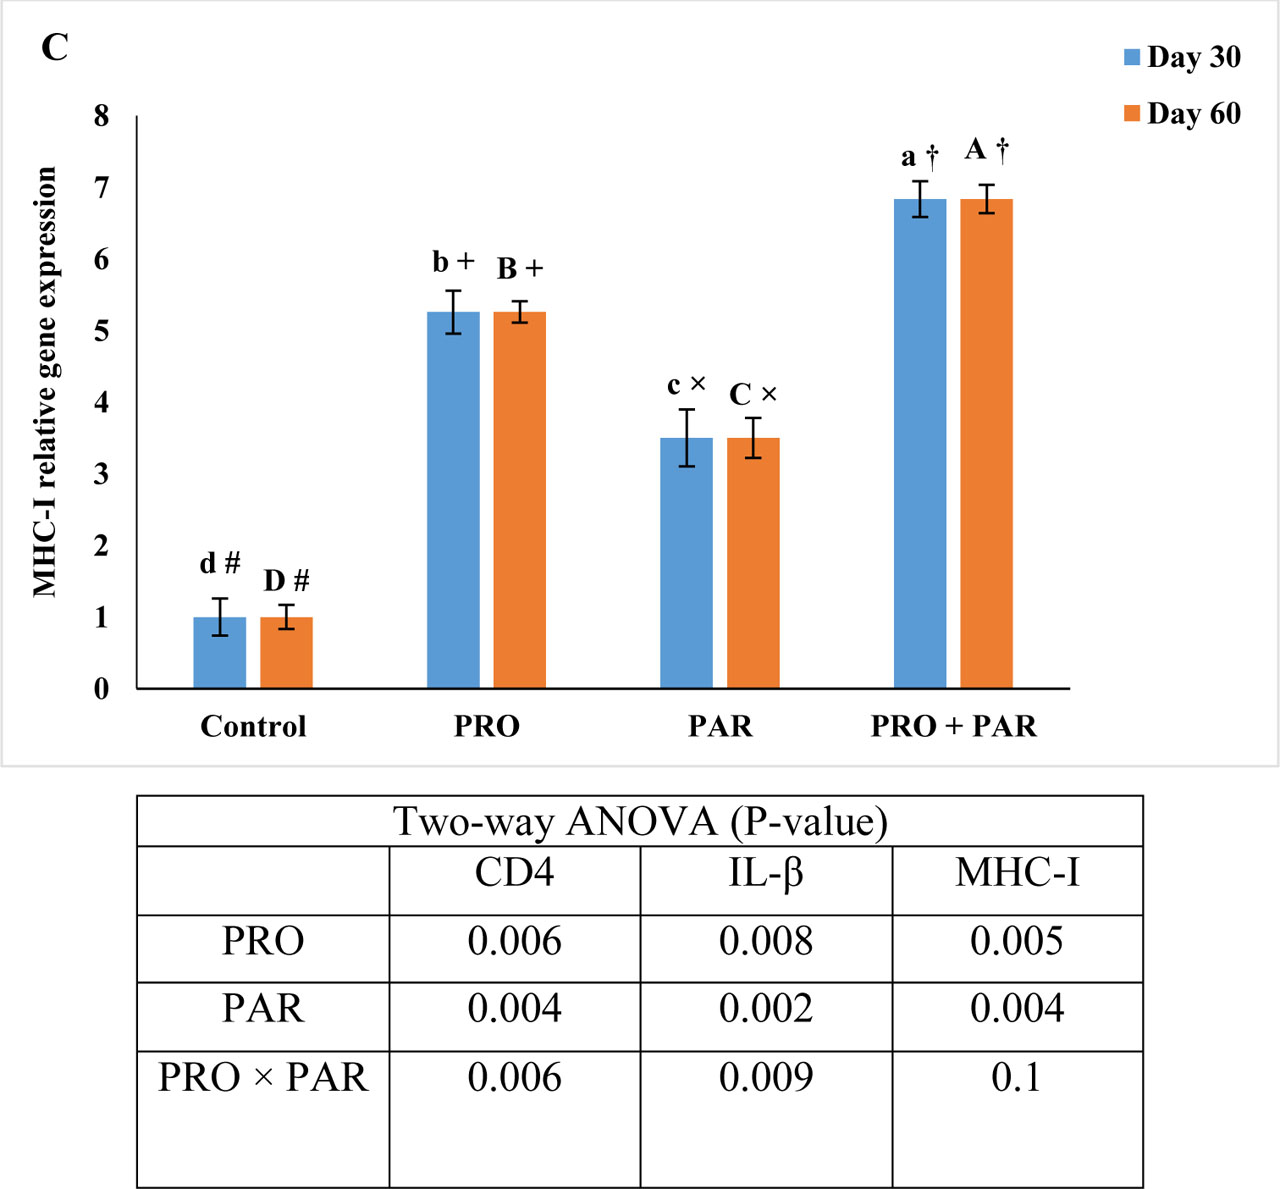
Figure 3.
Effects of the experimental supplements on the immune-related gene expression in the rainbow trout, Oncorhynchus mykiss over 30 and 60 days supplementation. Control: probioticparaprobiotic free commercial diet; PRO: diet containing 1.5 × 10⁶ Bacillus subtilis (probiotic) CFU/g diet; PAR: diet containing 1.5 × 10⁶ CFU/g diet inactivated Bacillus subtilis (paraprobiotic); PRO + PAR: diet containing 1.5 × 10⁶ CFU/g diet probiotic + 1.5 × 10⁶ CFU/g diet paraprobiotic. CD4: clusters of differentiation 4, IL-β: interleukin-β, MHC-I: major histocompatibility complex class I. Differences between the experimental treatments at day 30 are shown in lowercase subscripts (P<0.01). Differences between the experimental treatments at day 60 are shown in uppercase subscripts (P<0.01). Same symbols indicate no difference between day 30 and day 60 in each treatment (P<0.01)
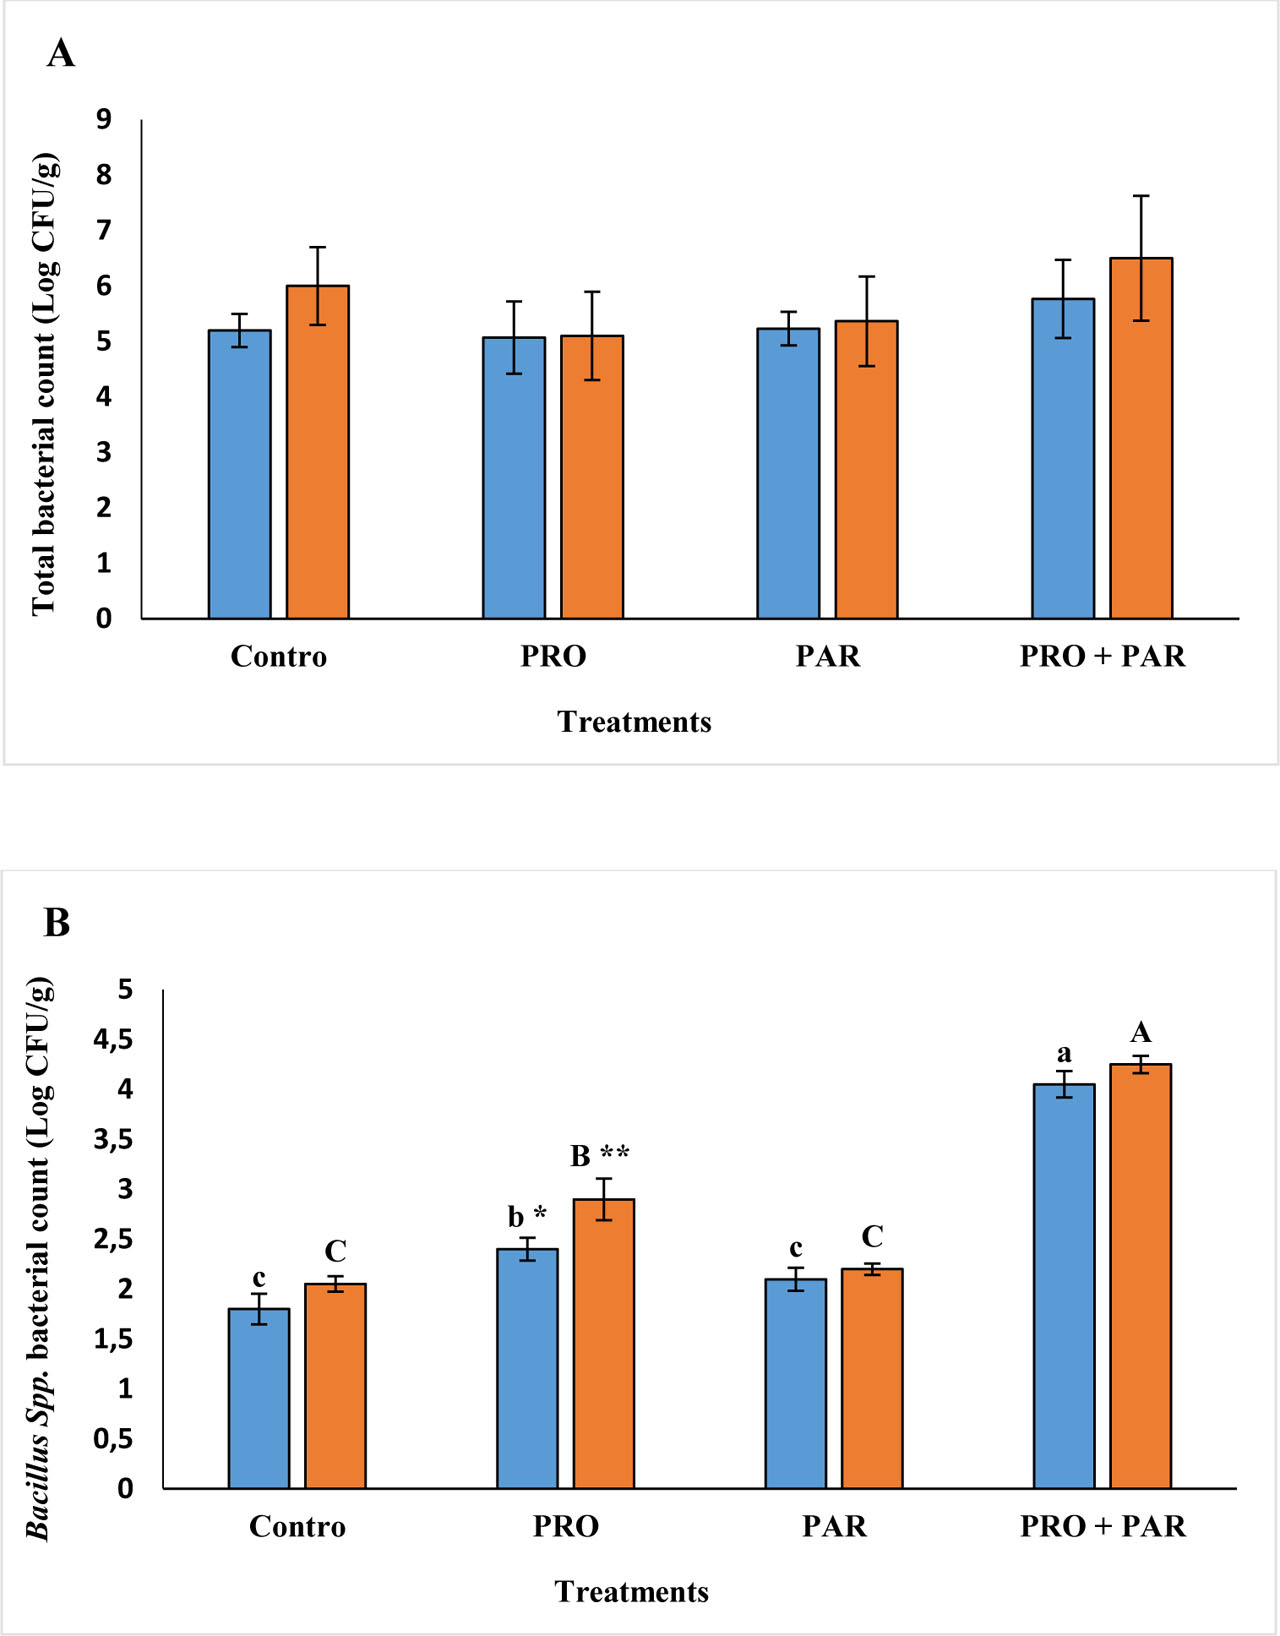
Figure 4.
The intestinal bacterial load in the rainbow trout, Oncorhynchus mykiss over 30 and 60 days supplementation. Control: probiotic-paraprobiotic free commercial diet; PRO: diet containing 1.5 × 10⁶ Bacillus subtilis (probiotic) CFU/g diet; PAR: diet containing 1.5 × 10⁶ CFU/g diet inactivated Bacillus subtilis (paraprobiotic); PRO + PAR: diet containing 1.5 × 10⁶ CFU/g diet probiotic + 1.5 × 10⁶ CFU/g diet paraprobiotic. Differences between the experimental treatments at day 30 are shown in lowercase subscripts (P<0.01). Differences between the experimental treatments at day 60 are shown in uppercase subscripts (P<0.01). Same symbols indicate no difference between day 30 and day 60 in each treatment (P<0.01)