
Today, aquaculture is an important way to supply food with high nutritional value for human societies (Gephart et al., 2020). With an increase in human population and a high demand for seafood products, the use of intensive aquaculture systems has been strongly rapidly developed globaly (Longo et al., 2013). However, the risk of disease outbreaks particularly in the intensive culture have been increased (Pulkkinen et al., 2010; Datta, 2012; Bălbărău et al., 2023). Alghogh use of antibiotics and vaccines is known as the main way to control pathogens in aquaculture sector (Sommerset et al., 2005; Kumar and Pal, 2018; Liu et al., 2017; Shefat, 2018). Frequent antibiotic therapy has caused an emergence of pathogen resistant, environmental pollution, and human health-related issues (Romero et al., 2012; Bondad-Reantaso et al., 2023). Also, there is no adequate efficacious vaccine available in aquaculture market (Choudhury and Kamilya, 2019). Therefore, alternative ways of disease prevention and protection it is important nowadays, and propbiotic therapy has received a great attention in aquaculture industry in the recent years (Sihag and Sharma, 2012; Chauhan and Singh, 2019). Many studies have well indicated that probiotics can have a high potential to control diseases in aquaculture (Kuebutornye et al., 2020 a; El-Saadony et al., 2021). Probiotics are health promoting microorganisms in host (Zoumpopoulou et al., 2018; Inal, 2025; Soltani et al., 2025). Assessing immune parameters in fish is an essential tool in probiotic supplementation experiments to evaluate how these supplements enhance immune system activity and disease resistance. Probiotics are known to modulate both innate and adaptive immunity, contributing to improved health and survival rates in aquaculture (Rahayu et al., 2024; Madhulika et al., 2025; Mohammed et al., 2025). Measuring immune responses provides valuable insights into the mechanisms by which probiotics influence host defense systems. This helps identify effective probiotic strains and optimize their use in fish diets. Ultimately, understanding immune modulation supports the development of sustainable strategies to boost fish health and productivity (Hoseinifar et al., 2018; Kuebutornye et al., 2020 a; El-Saadony et al., 2021). The International Scientific Association for Probiotics and Prebiotics (ISAPP) provides a more comprehensive scientific definition and defines probiotics as health keeping bacteria (Gibson et al., 2017). In this definition, the probiotic effect of the microorganisms on the host is conditional on their being alive (Hill et al., 2014; Gibson et al., 2017).
Despite concerns about the practical use and performance of probiotics, biotechnologists have shown that inactivated bacteria, known as para-probiotics, can also have the beneficial effect. Para-probiotics refer to non-viable microbial cells or crude cell extracts that provide benefits when taken orally (Soltani et al., 2024; Taverniti and Guglielmetti, 2011; Piqué et al., 2019; Teame et al., 2020; Siciliano et al., 2021; Baskar et al., 2024).
The recent publications show that Bacillus probiotics are among the most widely used microorganisms in aquaculture and their effectiveness in improving the fish immune system and growth is well known (Buruiană et al., 2014; Kuebutornye et al., 2019; Hlordzi et al., 2020; James et al., 2021; Gabadage et al., 2024; Vijayaram et al., 2024; Soltani et al., 2025). Bacillus subtilis is a gram-positive, non-pathogenic saprophytic bacterium whose spores are normally found in water, air, and soil (He et al., 2011; Olmos and Paniagua-Michel, 2014). This bacterium is one of the oldest species on earth, which is proof of the constant contact with vertebrates and the existence of a stable symbiosis between this bacterium and the immune system of humans and animals (Olmos and Paniagua-Michel, 2014). The pharmacological effects of para-probiotics have been studied very little in fish (Salinas et al., 2006; Kamilya et al., 2015; Anggraeni et al., 2022). In a study by Choi and Yoon (2008), dietary supplementation with heat-inactivated Vibrionaceae strains (Pdp11, 51M6, or their combination) enhanced innate immune components in the rainbow trout, Oncorhynchus mykiss. Furthermore, there is little data on the effects of combination of probiotics and para-probiotics in fish (Waché et al. 2006). The aim of this research was to assess the impacts of the probiotic Bacillus subtilis in a live and killed form on the growth, immunity, gut health, and blood biochemical parameters of rainbow trout.
Material and methods
Fish and experimental design
Healthy rainbow trout (180.2±1.6 g) were prepared from a rainbow trout farm and then transported to the experimental site under a continuous aeration. Fish were completely randomly distributed into twelve indoor concrete ponds (1.5 × 1.5 × 1.2 m) at a stocking rate of 20 fish per pond. Each pond was equipped with an air stone to continuously supply oxygen to the fish. The water quality were kept at the optimum condition required by this fish species (dissolved oxygen: >7 mg/l, pH: 7.5–7.6, temperature: 15.2–15.6°C), and were checked daily during the experiment period. In addition, the fish were under an 18L: 6D photic regime during the experimental period. Fish were fed a commercial trout diet (crude protein: 43%, crude fat: 18%, crude fiber: 5%, ash: 9%, moisture: 11%; Faradaneh Co., Shahrekord, Iran) 3 times a day (at 8:00, 12:00, 18:00) for 7 days to adapt to new conditions. After the adaptation period, the fish were designated as four experimental treatments with three replications and fed with test diets for 3 times a day (at 8:00, 12:00, and 18:00) for 60 days. The experimental diets were: 1) control diet: basal commercial diet, 2) probiotic (PRO): diet containing 1.5 × 10⁶ CFU/g live Bacillus subtilis, 3) Para-probiotic (PAR): diet containing 1.5 × 10⁶ CFU/g pressure-killed Bacillus subtilis and 4) a combination of PRO + PAR.
Diet preparation
The test diets were prepared by adding the supplements (i.e. probiotic and para-probiotic) to the basal diet. The preparation and dosing of the probiotic were done according to Cerezuela et al. (2012). To prepare a test concentration of 1.5 × 10⁶ CFU B. subtilis (JQ618019.1), the bacteria were cultured in TSA (tryptic soy agar) culture medium for 24 h at 22°C. Then the bacteria were sub-cultured in liquid TSB (tryptic soy broth) medium with calm continuous shaking for 24 h at 22°C. The cultures were then centrifuged (6000 × g for 15 min at 4°C), the supernatant removed and the deposited bacterial cells washed twice with strile pphosphate buffer (PBS). The bacterial cell cultures were counted by plating and adjusted to the required concentration of 1.5 × 10⁶ CFU/ml. The preparation of killed bacteria (para-probiotic) was done according to the method of Kim et al. (2020). In this regard, a number of 1.5 × 10⁶ CFU/ml B. subtilis were pressurized by a microfluidizer (LM10, Microfluidics International Corporation, DEX MPT, Inc, USA) at 1.2 bar pressure for 10 min. To evaluate the inactivation efficiency, the inactivated bacteria were cultured in TSA culture medium, and the lack of colony growth indicated the successful inactivation of the bacteria. The whole inactivated cells were dried using a spray drier and stored at 4°C until use. To make the experimental diet, the basal diet was sprayed with the prepared probiotic and para-probiotic (1.5 × 10⁶ CFU/g diet) using fish oil before daily feeding.
Growth preformance
The growth indices were evaluated after 30 days and 60 days of feeding experiment by sampling 10 fish per pond using the following equations:
Blood biochemicals
Sampling
The blood and tissue (kidney) samples were taken on days 30 and 60 of the experiment from 5 fish per pond after anestthizing fish with clove oil at 200 mg/L. Fish were starved for 24 hours before sampling). The samples were poured into non-heparinized tubes, centrifuged (13000 × g for 5 min at 4°C), and the obtained serums were kept in a −80°C until further analyses. The kidney tissue samples were excised and frozen at liquid nitrogen (−196°C) for gene expression analyses.
Blood immune and biochemical components
Assay kits for antioxidant enzymes including all reagents were obtained from Histogenotech Co., Iran, and all assays were performed according to the company’s instructions. Superoxidase dismutase (SOD) activity of the serum was measured at 406 nm by estimating the enzyme inhibiting effect on generation of superoxide radicals (Marklund and Marklund, 1974). Catalase (CAT) activity was measured at 540 nm by estimating the decomposition rate of H2O2 to water and oxygen (Mori et al., 1997). Gluthatione peroxidase (GPx) activity was assayed at 412 nm by measuring the glutathione (as substrate) decrease in the enzymatic reaction. One unit of GPx activity was defined as the amount of enzyme depleting 1 μmol of glutathione at 37°C in 1 min (Utley et al., 1967). Ferric reducing/antioxidant method (Benzie and Strain, 1996) was used to assay total antioxidant capacity (TAC). The protein content of serum was determined at 595 nm by Bradford (1976) method.
Albumin (ALB), total protein (TP), triglyceride (TG), glucose (GLU), alanine transaminase (ALT), aspartate aminotransferase (AST), and creatinine (CR) were measured using the commercial kits (Pars Azmun Co., Iran). ALB content of serum was measured at 630 nm after reaction with bromocresol green (Johnson et al., 1999). Serum CR was assayed at 505 nm using the photometric Jaffe method, in which CR reacts with picrate in an alkaline medium to produce an orange-red color (Thomas, 1998; Ghasemi et al., 2015). Serum GLU was assayed at 505 nm upon the action of glucose oxidase and the reaction of the oxygen released from glucose with phenol and 4-amino-antipyrine to form kinonimin (Sacks, 1999). AST was determined at 450 nm by estimating the decreases in NADH upon a coupled enzymatic reaction, in which AST and malic dehydrogenase are involved (Thomas, 1998). ALT was assayed at 570 nm by estimating the production rate of pyruvate upon the reaction of ALT on alanine and α-ketoglutarate (Thomas, 1998). TG was determined at 505 nm after separating glycerol from fatty acids by lipoprotein lipase and following the reaction of hydrogen peroxide released from glycerol with 4-amino-antipyrine and phenol in the vicinity of peroxidase. Serum TP was determined at 540 nm upon production of a violet color complex with copper ions in an alkaline solution (Sözgen et al., 2006).
The activity of alternative complement (ACH50) measured using method described by Yano (1992). Fish serum samples were collected, and the ACH50 activity was assessed using a sensitized rabbit red blood cell (RRBC) lysis assay. Briefly, RRBCs were sensitized with rabbit anti-RRBC antibodies. The sensitized RRBCs were then incubated with serial dilutions of fish serum in the presence of a buffer system (usually containing Ca2+ and Mg2+ ions to support complement activity). After incubation at 25°C for 1 h, the reaction was stopped by adding ice-cold saline. The degree of hemolysis was measured by reading the absorbance at 414 nm using a spectrophotometer. The ACH50 values were calculated as the dilution of serum causing 50% hemolysis of RRBCs. Results were expressed in units of complement activity per mL of serum (ACH50 U/mL). Lysozyme activity (U/ml) was measured using the turbidimetric method (Sigma-Aldrich, USA, Kit number: LY0100), following the protocols outlined by Ellis (1990). In this assay, the substrate Micrococcus lysodeikticus, a Gram-positive bacterium, was suspended in phosphate buffer (0.05 M, pH 6.2) at a concentration of 0.2 mg/mL. Fish serum (10 μL) was added to 1 mL of the bacterial suspension, and the decrease in turbidity was recorded at 450 nm for 5 min at 25°C using a spectrophotometer. Lysozyme activity was expressed as the amount of enzyme required to decrease the absorbance by 0.001/min. A standard curve using hen egg-white lysozyme was used as the reference. Total immunoglobulin (IgM) was measured by an ELISA Kit (Catalog Number: MBS282651, MyBioSource, Inc., USA) using a spectrophotometric method based on protein precipitation described by Siwicki and Anderson (1993). Plasma samples were mixed with a 12% solution of polyethylene glycol (PEG) to precipitate the immunoglobulins. The samples were centrifuged at 5000 rpm for 10 min at 4°C. The supernatant was removed, and the protein concentration of the immunoglobulins was determined using the biuret method by a commercially available protein assay kit. The IgM concentration was calculated by subtracting the protein concentration in the PEG-treated plasma from the total protein concentration in the untreated plasma. Results were expressed as mg/mL of immunoglobulin in plasma.
Gene expressions
RNA extraction
Total RNA content of kidney tissue was extracted using total RNA mini Kit (Histogenotech Co., Iran) according to the company’s instructions. Briefly, kidney tissue was homogenized in 1000 μl Trizol and vortexed for 6 min, incubated on ice for 15 min, and centrifuged (1300 × g) for 5 min to separate the supernatant. Isopropanol (500 μl) was added to the supernatant, incubated on ice for 10 min, and centrifuged again at 1300 × g for 5 min prior to washing with ethanol 70%. The supernatant was centrifuged (8000 × g) for 8 min and air dried. The RNA quantity was spectrophotometrically evaluated at 260 nm by a Nanodrop spectrophotometer (Wilmington, DE, USA). The RNA quality was evaluated by electrophoresis on 1.5% formaldehyde agarose gel containing ethidium bromide. Also, the genomic DNA wipeout buffer was used to remove residual genomic DNA.
Real time PCR
cDNAs for the genes, CD4, IL1β, and MHC-1 were synthesized through reverse transcription of the extracted RNA and by using a cDNA Synthesis Kit (Pars-Tous Company, Iran). Briefly, 1 ng of extracted RNA was added to an assay solution containing 2 µl Enzyme Mix + 10 µl Buffer-Mix (2×) + 8 and 8 µl DEPC-treated water], vortexed for 3 s, incubated at 26°C for 8 min and re-incubated at 46°C for 60 min. The reaction was stopped by increasing the temperature up to 85°C for 5 min and then the mixture was chilled on the ice. Light Cycler 480 II (Roche, Basel, Switzerland) was used to perform a real-time quantitative polymerase chain reaction using a mixed set of primers (Table 1). The reaction program was 25°C for 10 min, 47°C for 60 min, and 85°C for 5 min. The β-actin was used as a reference gene. The relative mRNA expressions were estimated by the 2−∆∆Ct method.
Intestinal microbial population
To assess the microbial population in the intestine, fish skin (3 fish/tank) was first disinfected with 70% ethanol. After opening the abdominal cavity, the intestines were washed and homogenized using a tissue homogenizer in sterile PBS. The resulting homogenate was diluted in strile PBS, and 100 μl of the solution was plated on MYP agar (for Bacillus spp. bacteria) and tryptic soy agar (TSA) (for total intestinal bacteria). The plates were incubated at 28°C for 24 h, after which bacterial colonies were counted and expressed as colony-forming units per gram (CFU/g), following the procedure described by Merrifield et al. (2010).
Statistical analysis
After the evaluation of data normality by Kolmogorov–Smirnov test, the differences between the treatments during 30 days and 60 days of the experiment were analyzed by two-way analysis of variance, and Tukey’s HSD test was used to determine differences between means. The differences between day 30 and day 60 in each treatment were analyzed using the independent sample t-test. Statistical analysis was done by SPSS statistical package version 18.0 (SPSS Inc., 151 Chicago, IL, USA) and the differences were evaluated at level P<0.01.
Results
Growth
The growth performance (Table 2) of rainbow trout was recorded for four experimental treatments, measured at both day 30 and day 60. The growth parameters, including final weight (FW), weight gain (WG), specific growth rate (SGR), and feed conversion ratio (FCR), showed significant differences among treatments (P<0.01). On day 30, the highest FW was observed in the PRO + PAR group (282.5±7.4 g). By day 60, FW increased significantly in all groups, with the PRO + PAR group showing the highest weight (390.8±12.3 g). The highest WG was also observed in the PRO + PAR group on both day 30 (35.6±3.5%) and day 60 (115.4±6.5%), significantly greater than the other groups (P<0.01). The PRO + PAR group consistently exhibited the highest SGR (P<0.01), with no significant differences between day 30 (1.35±0.04%/day) and day 60 (1.28±0.06%/day) (P>0.01). FCR was most efficient in the PRO + PAR group at both day 30 (1.14±0.01) and day 60 (1.12±0.02), while the control group had the highest FCR, indicating less efficient feed utilization (P<0.01). There were no significant differences in survival rates among the groups at both time points, with all groups exhibiting high survival rates (P>0.01).
Table 2.
Effects of the experimental supplements on growth parameters of the rainbow trout, Oncorhynchus mykiss over 30 and 60 days supplementation. Control: probiotic-paraprobiotic free commercial diet; PRO: diet containing 1.5 × 10⁶ Bacillus subtilis (probiotic) CFU/g diet; PAR: diet containing 1.5 × 10⁶ CFU/g diet inactivated Bacillus subtilis (paraprobiotic); PRO + PAR: diet containing 1.5 × 10⁶ CFU/g diet probiotic + 1.5 × 10⁶ CFU/g diet paraprobiotic. IW: initial weight, FW: final weight, WG: weight gain, SGR: specific growth rate, FCR: feed conversion ratio, SR: survival rate
| Treatments | ||||||||
|---|---|---|---|---|---|---|---|---|
| Control | PRO | PAR | PRO + PAR | |||||
| IW (g) | 178.3±5.1 | 181.1±4.5 | 179.5±4.8 | 181.9±5.2 | ||||
| Day 30 | Day 60 | Day 30 | Day 60 | Day 30 | Day 60 | Day 30 | Day 60 | |
| FW (g) | 251.5±5.5 c | 325.9±7.5 C | 265.6±6.7 b | 378.9±8.2 A | 271.5±7.2 ab | 342.5±6.4 B | 282.5±7.4 a | 390.8±12.3 A |
| WG (%) | 29.1±2.5 b* | 82.5±4.2 C** | 31.8±2.2 ab# | 108.9±5.3 A## | 33.8±2.4 ab+ | 91.5±6.2 B++ | 35.6±3.5 a× | 115.4±6.5 A×× |
| SGR (%/day) | 1.02±0.02 b | 1.01±0.07 C | 1.35±0.05 a | 1.23±0.09 A | 1.28±0.03 a* | 1.08±0.07 B** | 1.35±0.4 a | 1.28±0.06 A |
| FCR | 1.38±0.02 a* | 1.22±0.05 A** | 1.28±0.03 b | 1.25±0.04 B | 1.28±0.02 b | 1.31±0.03 B | 1.14±0.01 c | 1.12±0.02 C |
| SR (%) | 97. 8±2.4 | 98. 5±2.5 A | 99. 5±1.5 | 96.8±2.3 A | 100% | 97.5±2.5 A | 100% | 96.4±2.6 A |
| Two-way ANOVA (P-value) | ||||||||
| IW | FW | WG | SGR | FCR | ||||
| PRO | 0.23 | 0.006 | 0.004 | 0.006 | 0.002 | |||
| PAR | 0.51 | 0.002 | 0.003 | 0.008 | 0.004 | |||
| PRO × PAR | 0.32 | 0.008 | 0.005 | 0.11 | 0.13 | |||
Serum immune and biochemical components
The effects of different treatments (control, PRO, PAR, and PRO + PAR) on serum components, including lysozyme activity, ACH50 activity, and immunoglobulin (IgM) levels, are presented in Table 3. On day 30, the highest lysozyme activity was observed in the PRO + PAR group (59.3±5.8 U/ml), which was significantly higher than the PAR, PRO, and control groups (P<0.01). By day 60, lysozyme activity significantly increased across all groups, with the PRO + PAR group maintaining the highest activity (71.5±7.5 U/ml). No significant changes were noted between day 30 and day 60 within the control group (P>0.01). ACH50 activity followed a similar trend, with significant differences between treatments. At day 30, the PRO + PAR group showed the highest activity (23.1±2.1 U/ml), which significantly increased by day 60 (27.4±2.2 U/ml) (P<0.01). Both the PAR (19.1±2.3 U/ml) and PRO (15.8±2.4 U/ml) groups had significantly higher activity than the control group (10.2±3.1 U/ml) at day 30, and these levels further increased by day 60 in all groups (P<0.01). The IgM levels in the PRO + PAR group were significantly higher than the other groups on both day 30 (2.7±0.1 mg/ml) and day 60 (3.9±0.2 mg/ml) (P<0.01). A similar trend was also observed in the PAR and PRO groups, with significant increases from day 30 to day 60 (P<0.01). The concentration of ALB in the PRO and PRO + PAR treatments at day 30 was more than control and PAR group (Figure 1 A, P<0.01). At day 60, ALB concentration showed a significant increase only in the PRO + PAR group compared to the control one (Figure 1 A, P<0.01). The highest concentration of ALB was observed in the PRO + PAR treatment (Figure 1 A, P<0.01). In each experimental treatment, except for the PRO + PAR treatment, the concentration of ALB at day 60 was higher than that at day 30 (Figure 1 A, P<0.01).
Table 3.
Effects of the experimental supplements on serum immune parameters of the rainbow trout, Oncorhynchus mykiss over 30 and 60 days supplementation. Control: probioticparaprobiotic free commercial diet; PRO: diet containing 1.5 × 10⁶ Bacillus subtilis (probiotic) CFU/g diet; PAR: diet containing 1.5 × 10⁶ CFU/g diet inactivated Bacillus subtilis (paraprobiotic); PRO + PAR: diet containing 1.5 × 10⁶ CFU/g diet probiotic + 1.5 × 10⁶ CFU/g diet paraprobiotic. Differences between the experimental treatments at day 30 are shown in lowercase subscripts (P<0.01). Differences between the experimental treatments at day 60 are shown in uppercase subscripts (P<0.01). Same symbols indicate no difference between day 30 and day 60 in each treatment (P<0.01)
| Treatments | ||||||||
|---|---|---|---|---|---|---|---|---|
| Control | PRO | PAR | PRO + PAR | |||||
| Serum components | Day 30 | Day 60 | Day 30 | Day 60 | Day 30 | Day 60 | Day 30 | Day 60 |
| Lysozyme activity U/ml) | 27.2±5.2 c * | 31.5±7.2 C* | 41.8±6.5 b | 55.3±5.1 B | 45.1±5.5 b# | 52.8±6.1 B# | 59.3±5.8 a | 71.5±7.5 A |
| ACH50 activity U/ml) | 10.2±3.1 b* | 12.5±2.2 C* | 15.8±2.4 b# | 20.5±2.5 B# | 19.1±2.3 a | 24.5±1.8 A | 23.1±2.1 a+ | 27.4±2.2 A+ |
| Total Ig (mg/ml) | 1.5±0.15 c* | 1.7±0.2 D* | 2.1±0.12 b | 2.4 ±0.1 C | 2.5±0.2 a | 3.4 ±0.15 B | 2.7±0.1 a | 3.9 ±0.2 A |
| Two-way ANOVA (P-value) | ||||||||
| Lysozyme activity | ACH50 activity | Total Ig | ||||||
| PRO | 0.002 | 0.004 | 0.003 | |||||
| PAR | 0.006 | 0.002 | 0.005 | |||||
| PRO × PAR | 0.007 | 0.006 | 0.009 | |||||
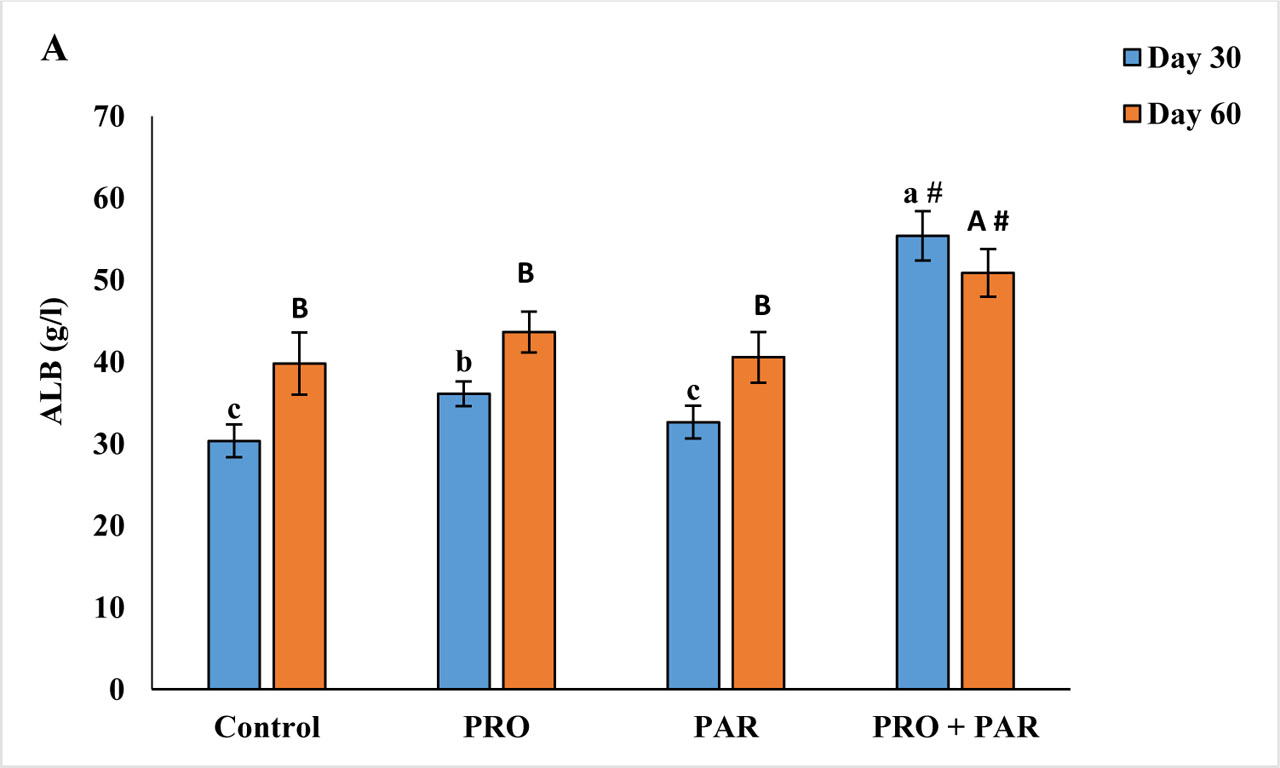
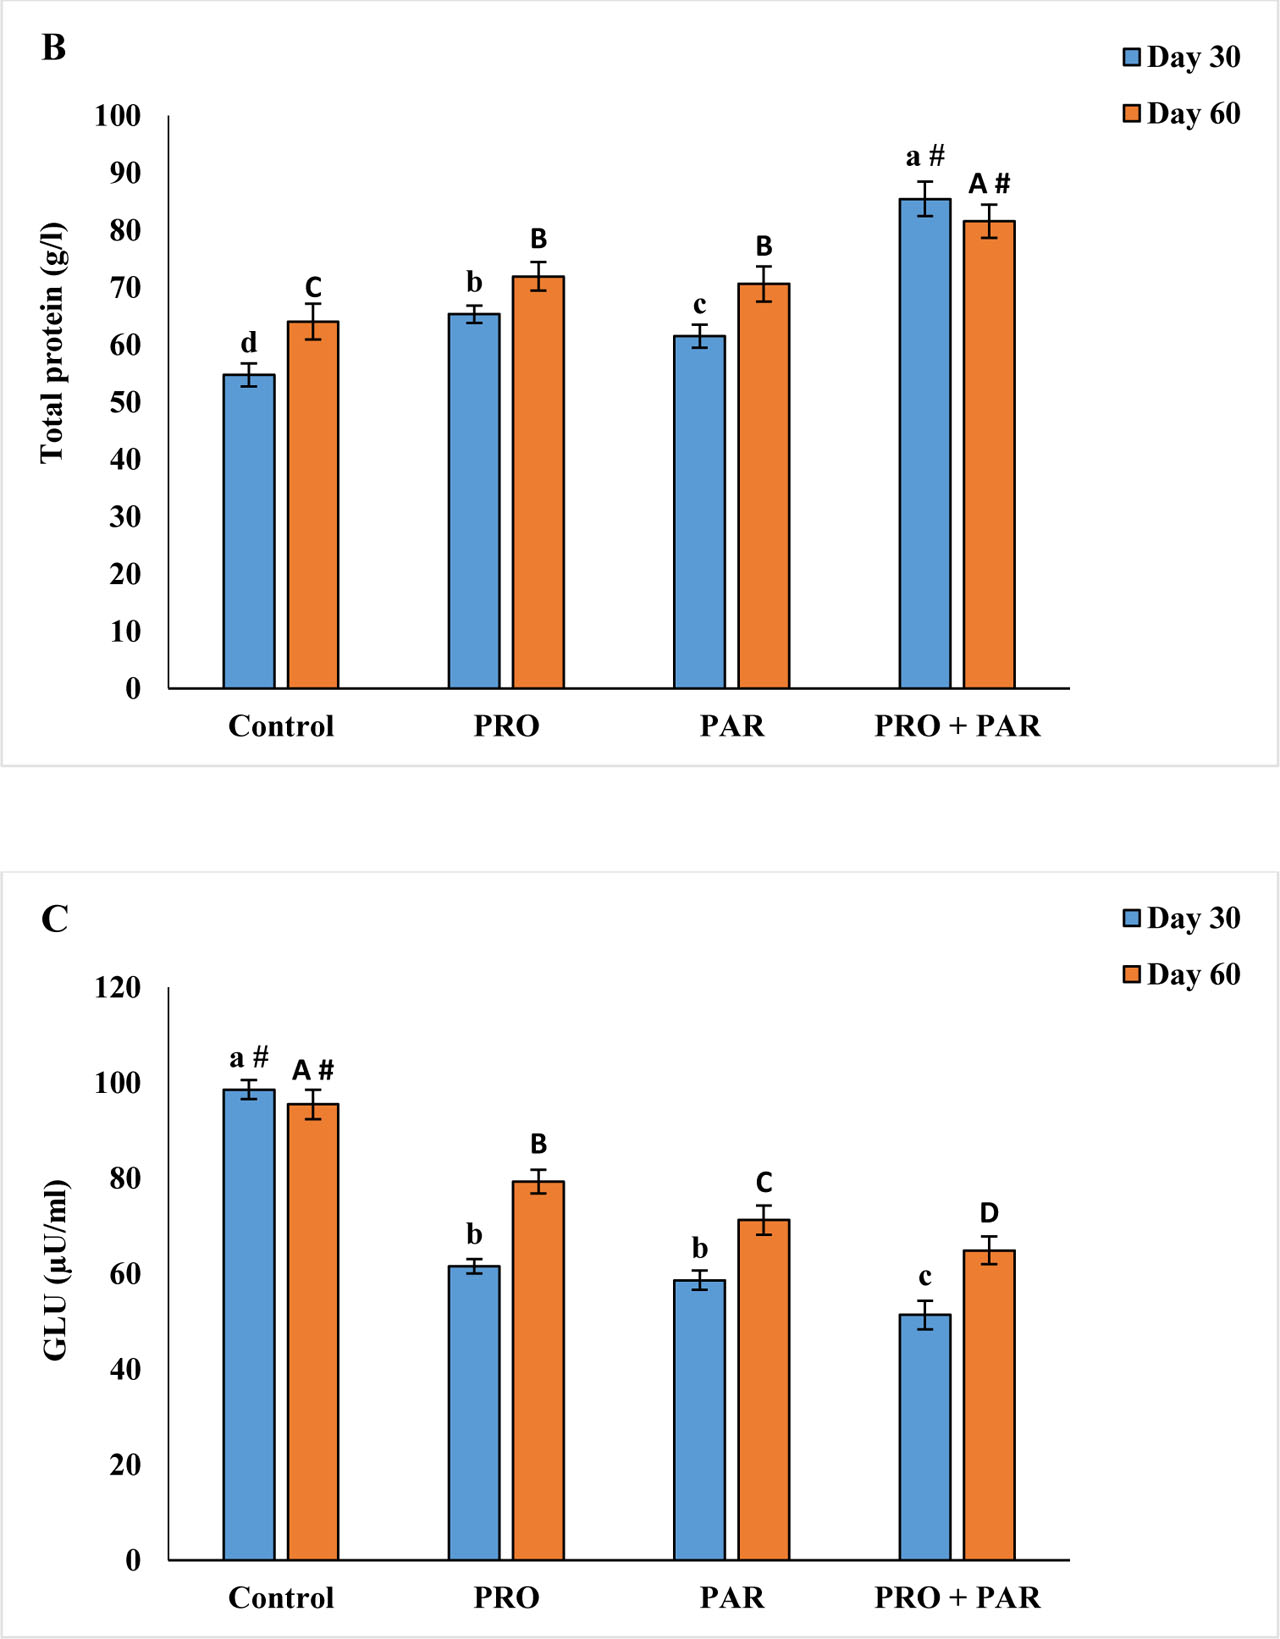
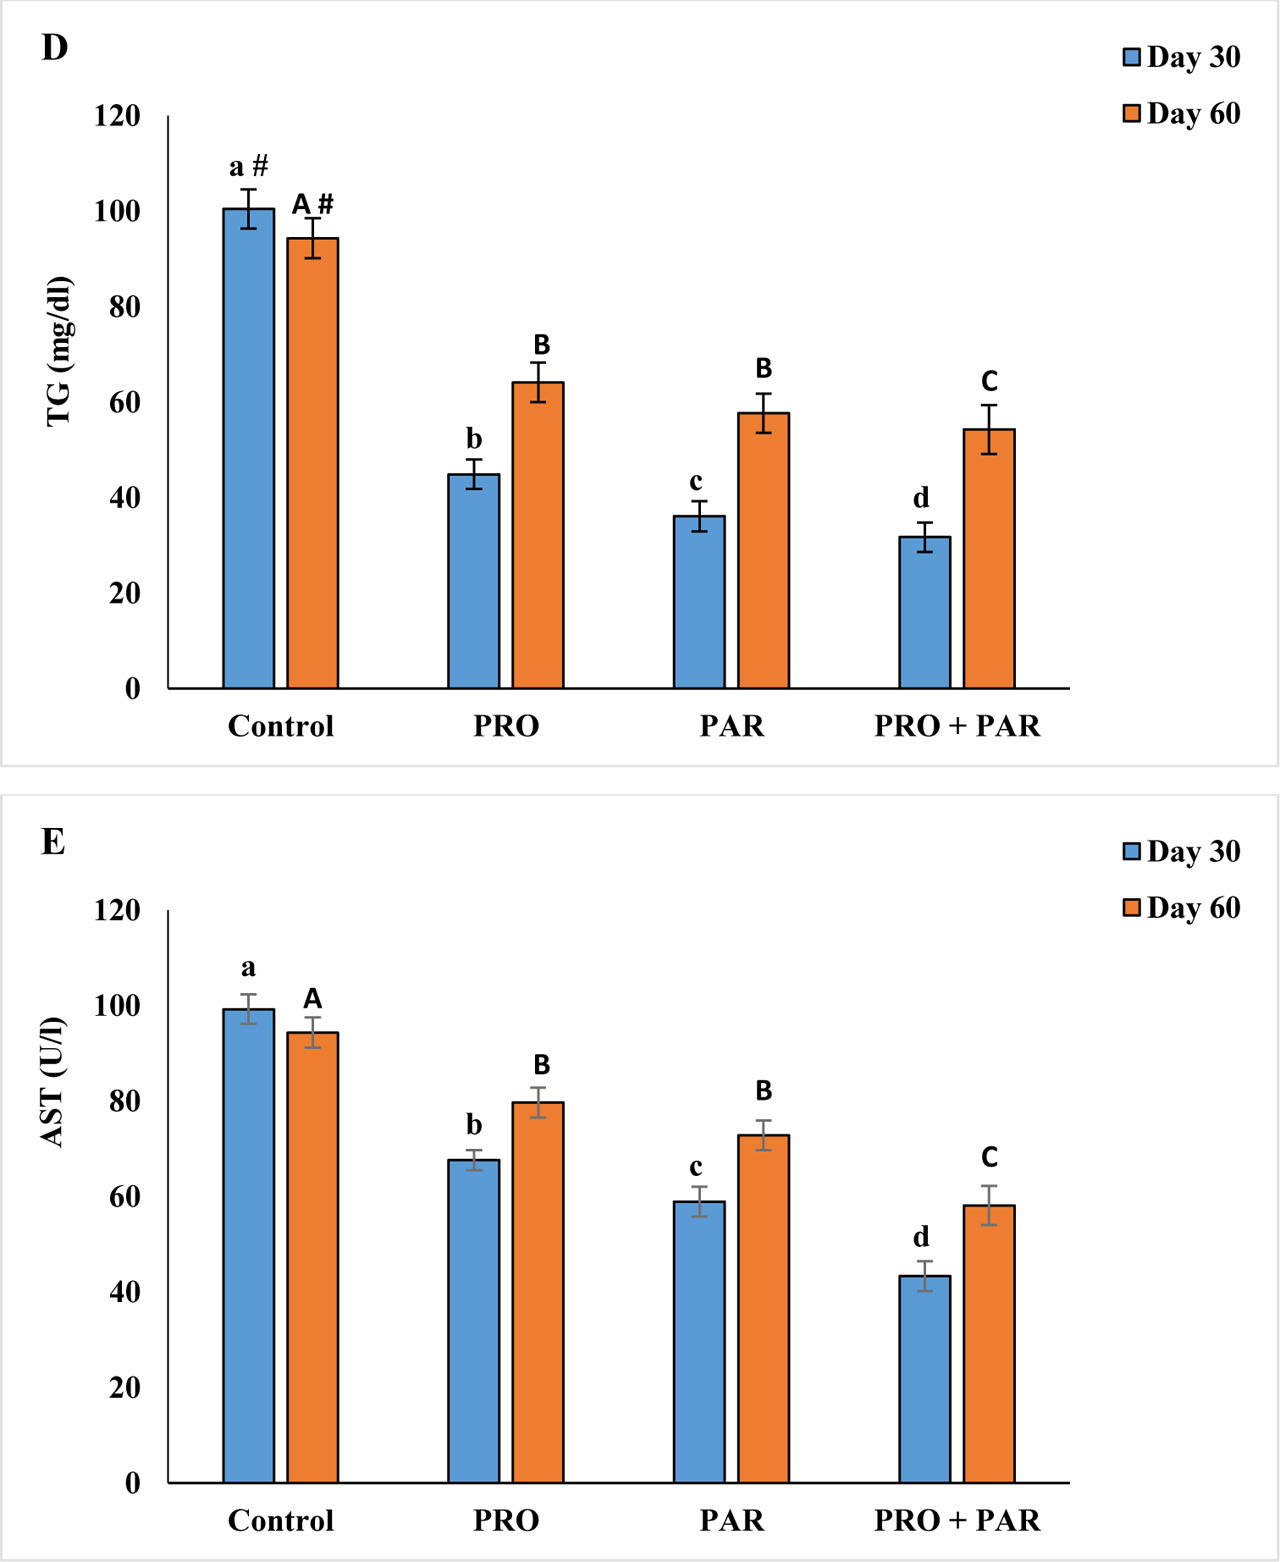
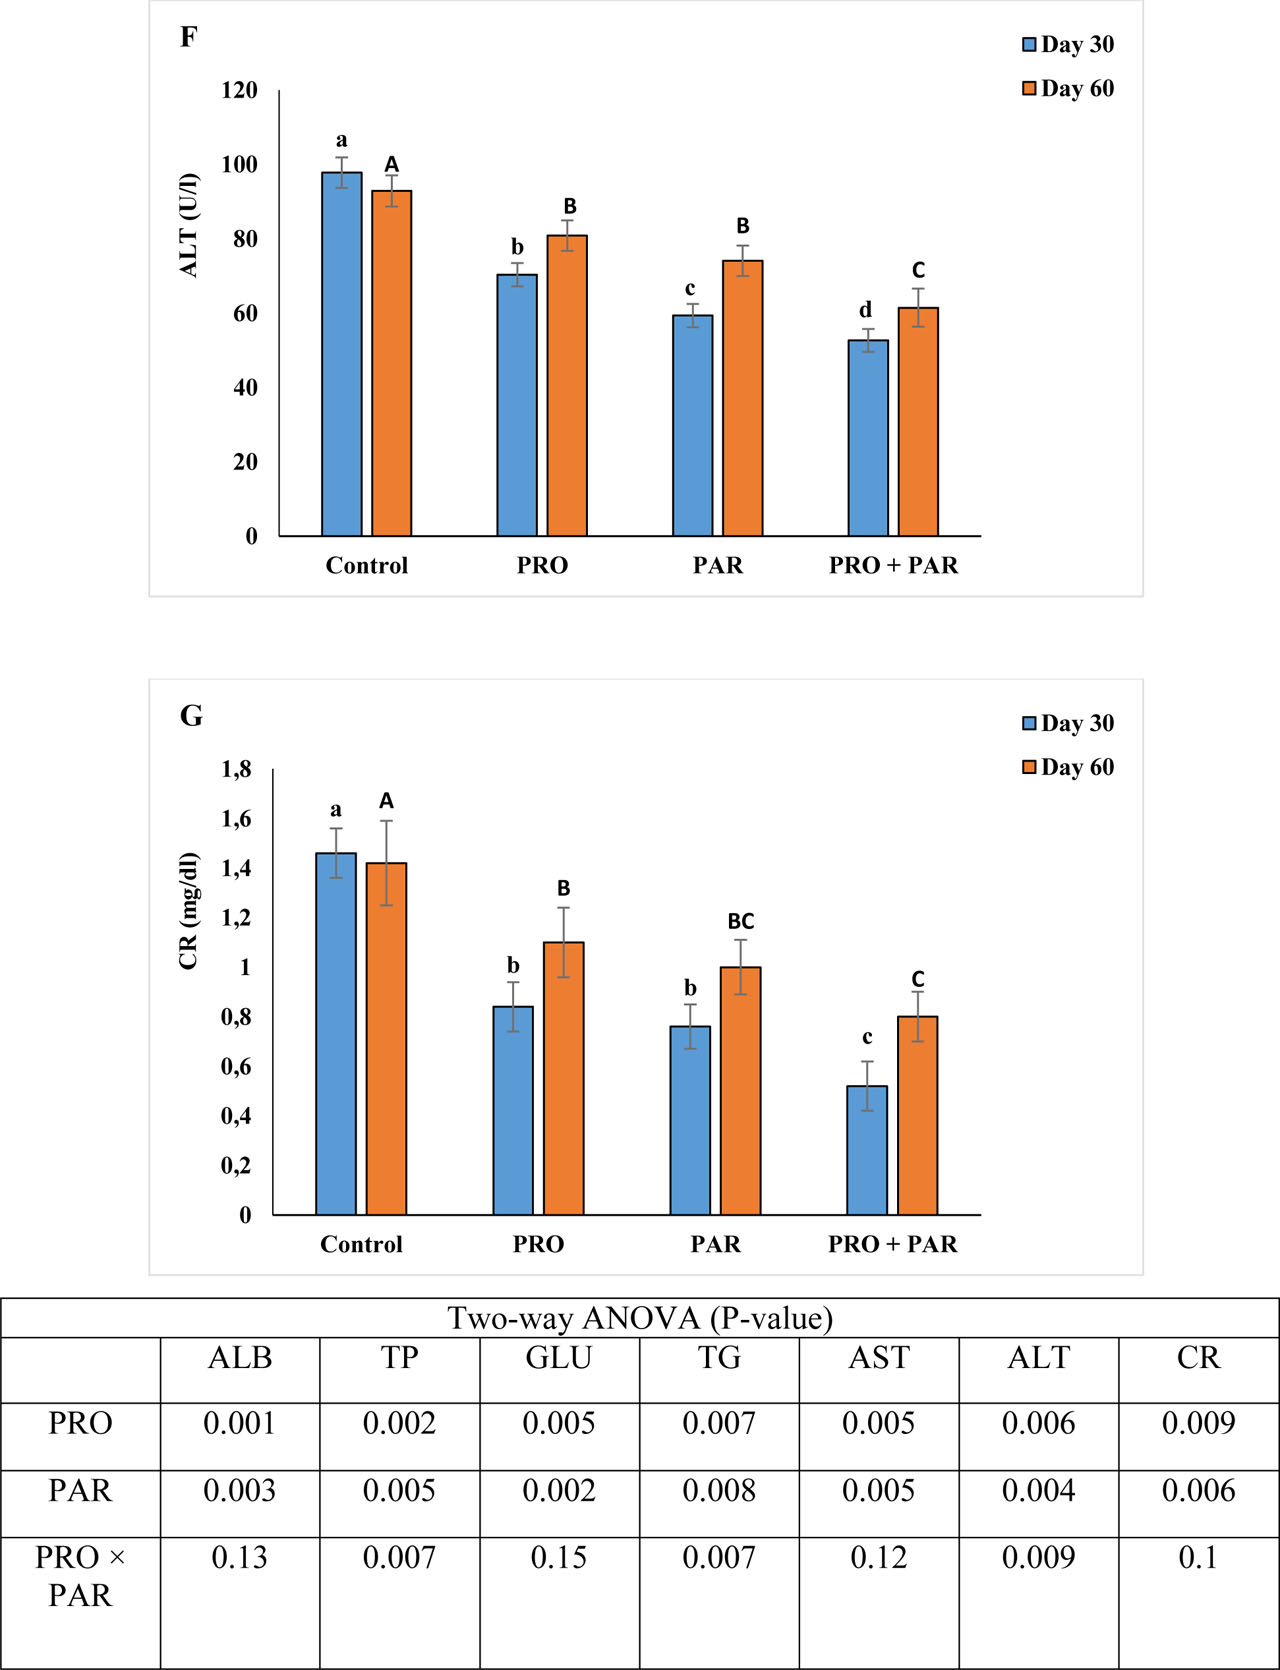
Figure 1.
Effects of the experimental supplements on serum biochemicals of the rainbow trout, Oncorhynchus mykiss over 30 and 60 days supplementation. Control: probiotic-paraprobiotic free commercial diet; PRO: diet containing 1.5 × 10⁶ Bacillus subtilis (probiotic) CFU/g diet; PAR: diet containing 1.5 × 10⁶ CFU/g diet inactivated Bacillus subtilis (paraprobiotic); PRO + PAR: diet containing 1.5 × 10⁶ CFU/g diet probiotic + 1.5 × 10⁶ CFU/g diet paraprobiotic. ALB: albumin, TG: triglyceride, GLU: glucose, AST: aspartate aminotransferase, ALT: alanine transaminase, CR: creatinine. Differences between the experimental treatments at day 30 are shown in lowercase subscripts (P<0.01). Differences between the experimental treatments at day 60 are shown in uppercase subscripts (P<0.01). Same symbols indicate no difference between day 30 and day 60 in each treatment (P<0.01)
The concentration of TP showed a significant increase in the supplemented treatments at both day 30 and 60 compared to the control (Figure 1 B, P<0.01). The highest concentration of TP was observed in the PRO + PAR treatment (Figure 1 B, P<0.01). In each experimental treatment, except for the PRO + PAR treatment, the concentration of TP at day 60 was higher than that at day 30 (Figure 1 B, P<0.01).
GLU (Figure 1 C), TG (Figure 1 D), AST (Figure 1 E), ALT (Figure 1 F), and CR (Figure 1 G) concentrations in all supplemented fish had significant decreases at both day 30 and 60 (P<0.01). AST, ALT, CR, GLU and TG concentrations in the PRO + PAR treatment showed lower levels than in other treatments (P<0.01). Except for the control group, the glucose concentration of each treatment was higher at day 60 than that at day 30 (P<0.01).
Antioxidant defense components
The activity of CAT (Figure 2 A), GPx (Figure 2 B), SOD (Figure 2 C), and TAC (Figure 2 D) in supplemented fish showed significant increases at both day 30 and 60 (P<0.01). Except for the control, the activity of the antioxidant enzymes and TAC were higher at day 60 than those at day 30 (P<0.01). The highest antioxidant activity was observed in the treatment PRO + PAR (P<0.01).
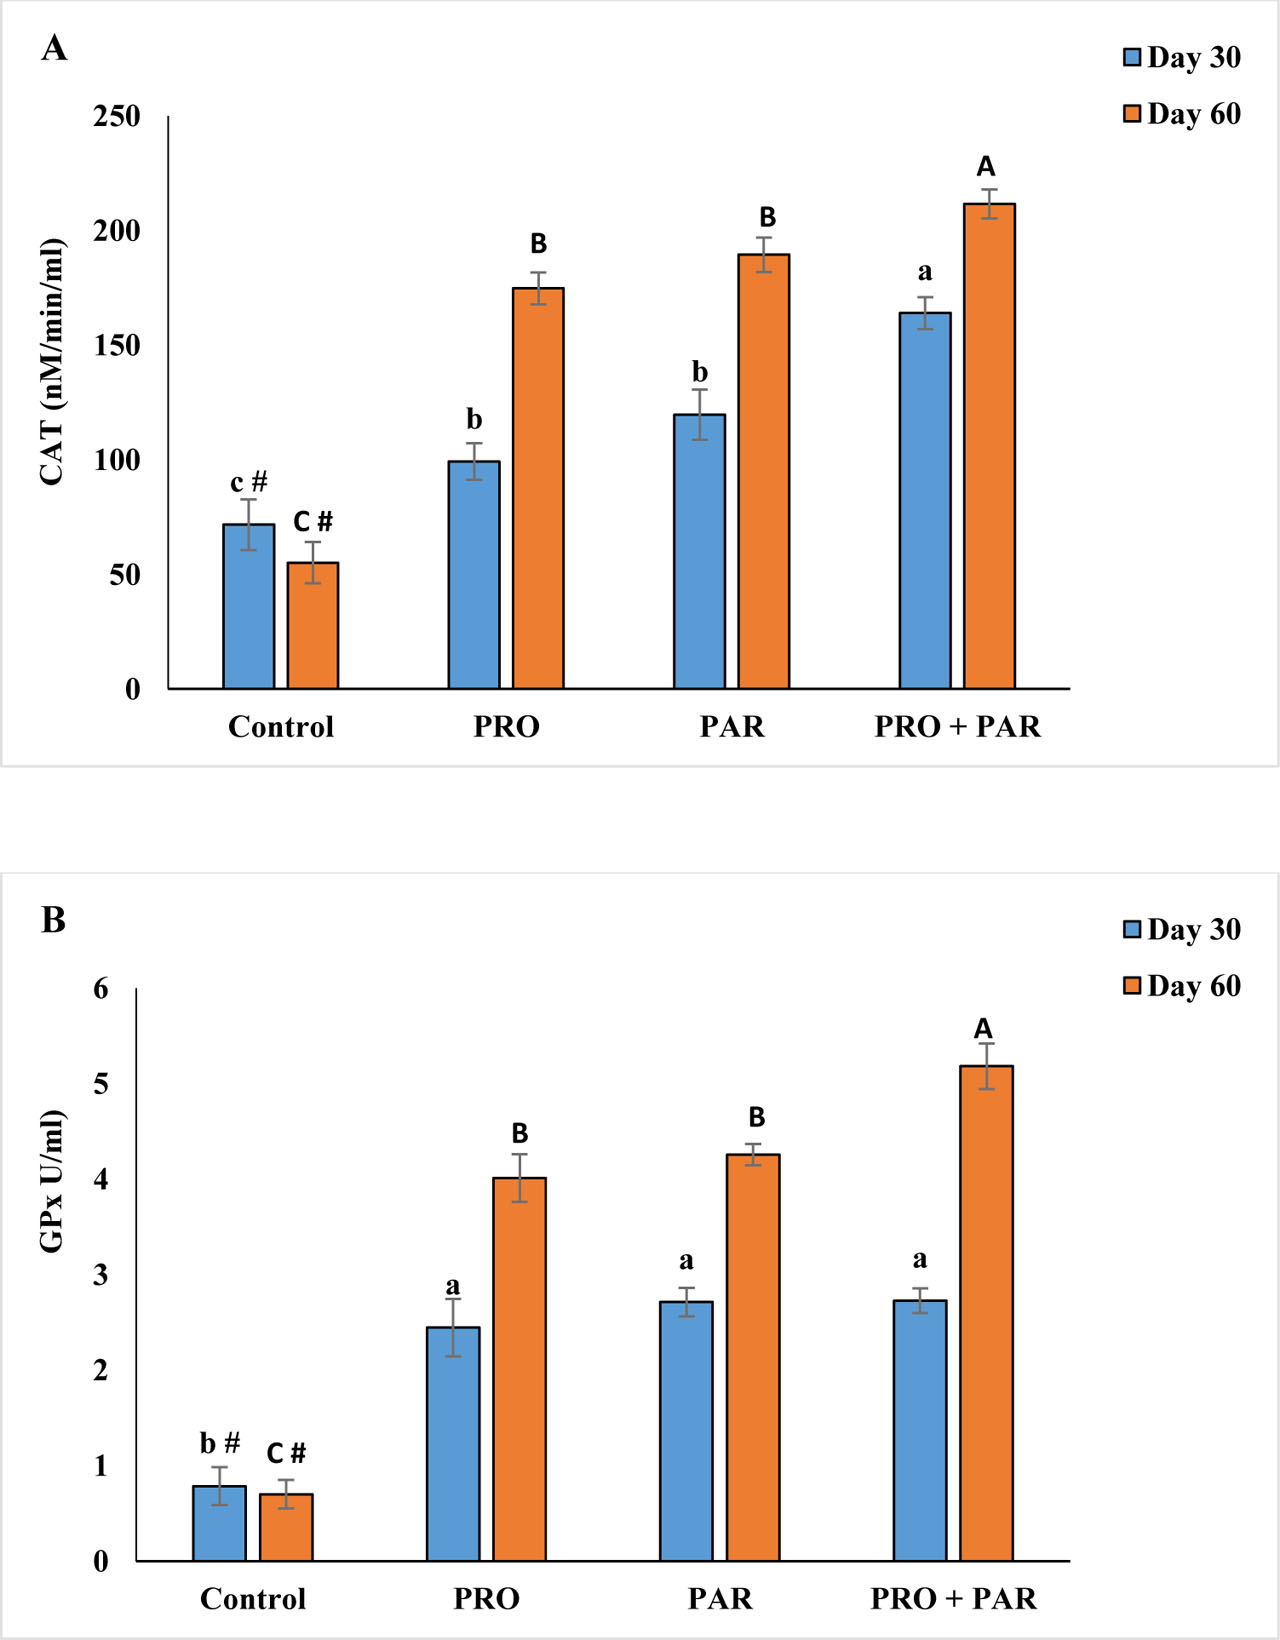
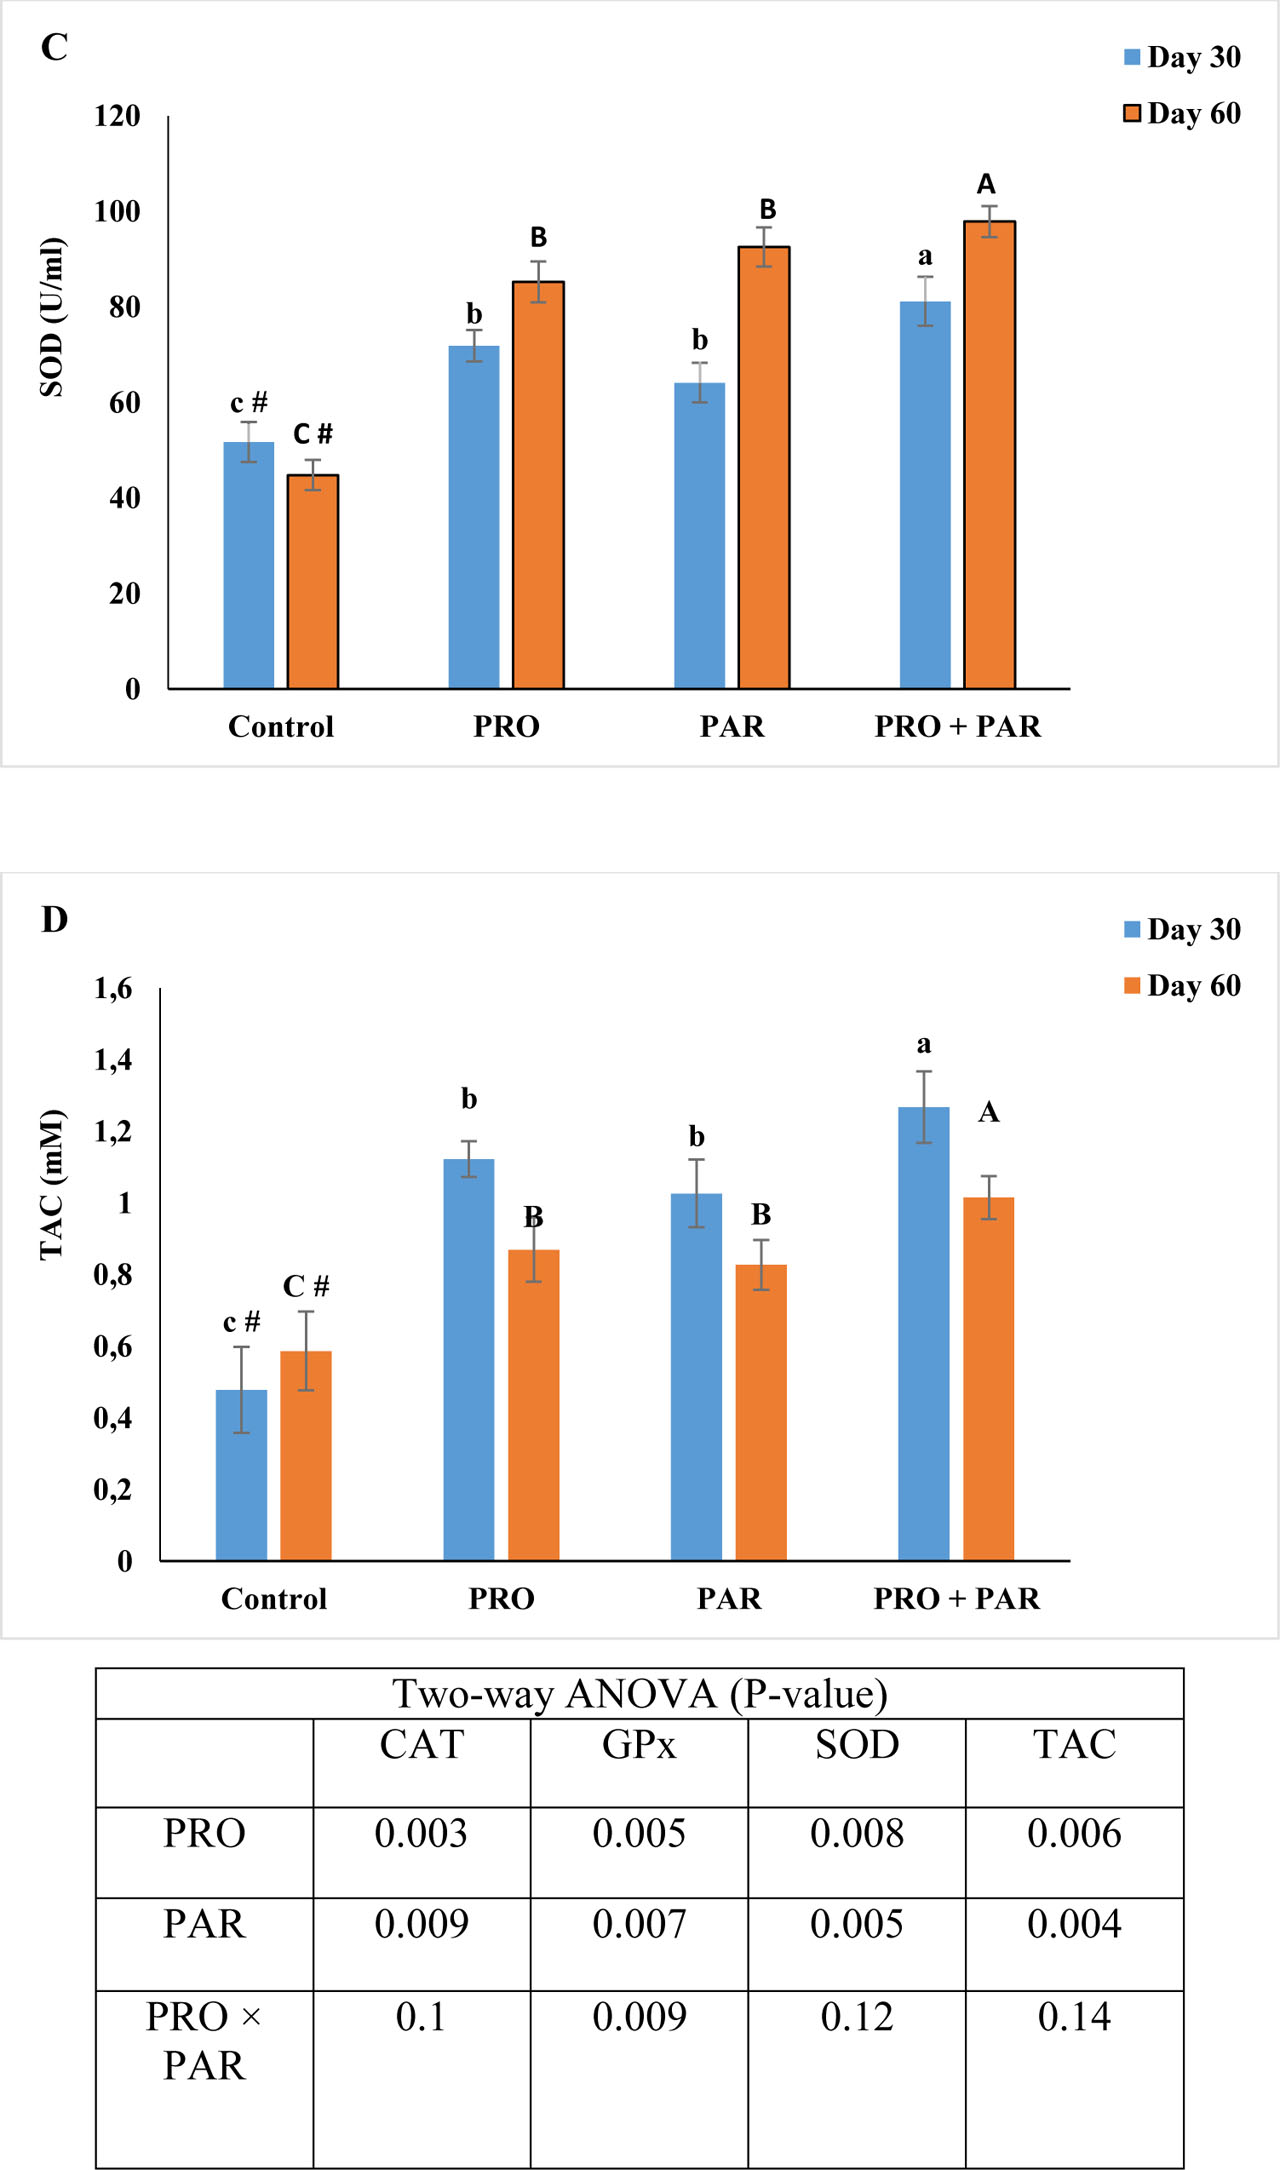
Figure 2.
Effects of the experimental supplements on antioxidant enzyme activities and total antioxidant capacity in the rainbow trout, Oncorhynchus mykiss over 30 and 60 days supplementation. Control: probiotic-paraprobiotic free commercial diet; PRO: diet containing 1.5 × 10⁶ Bacillus subtilis (probiotic) CFU/g diet; PAR: diet containing 1.5 × 10⁶ CFU/g diet inactivated Bacillus subtilis (paraprobiotic); PRO + PAR: diet containing 1.5 × 10⁶ CFU/g diet probiotic + 1.5 × 10⁶ CFU/g diet paraprobiotic. CAT: catalase, GPx: gluthatione peroxidase, SOD: superoxide dismutase, TAC: total antioxidant capacity. Differences between the experimental treatments at day 30 are shown in lowercase subscripts (P<0.01). Differences between the experimental treatments at day 60 are shown in uppercase subscripts (P<0.01). Same symbols indicate no difference between day 30 and day 60 in each treatment (P<0.01)
Gene expression
The expression of immune-related genes at both day 30 and 60 significantly increased in the supplemented fish compared to control group (Figure 3, P<0.01). Except for the control, CD4 gene expression at day 60 was higher than its values at day 30 (Figure 3 A, P<0.01). The IL-β expression at day 60 was higher only in the PRO group than that at day 30, and other treatments showed no difference between day 60 and day 30 (Figure 3 B, P<0.01). Also, there was no significant difference in the expression of the MHC-I gene between days 30 and 60 in all experimental groups (Figure 3 C, P>0.01). The highest level of immune-related gene expressions was observed in the treatment PRO + PAR (Figure 3, P<0.01).
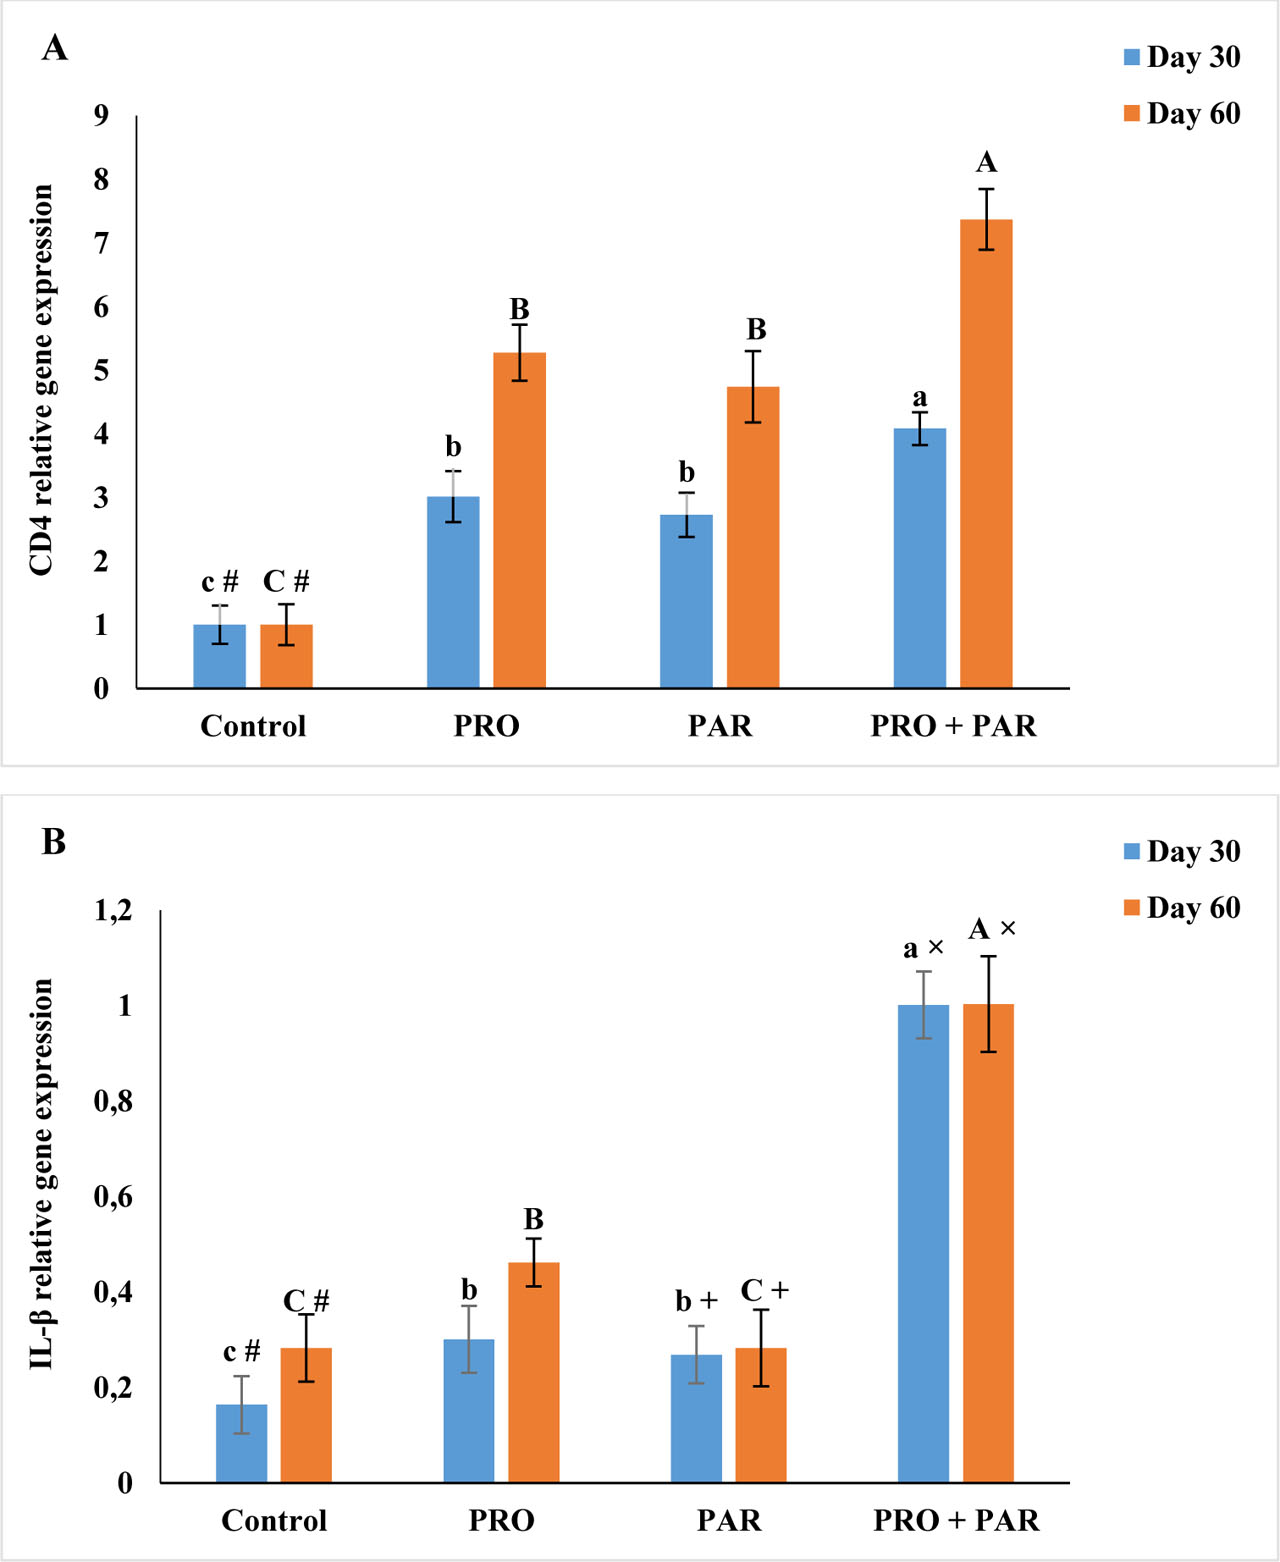
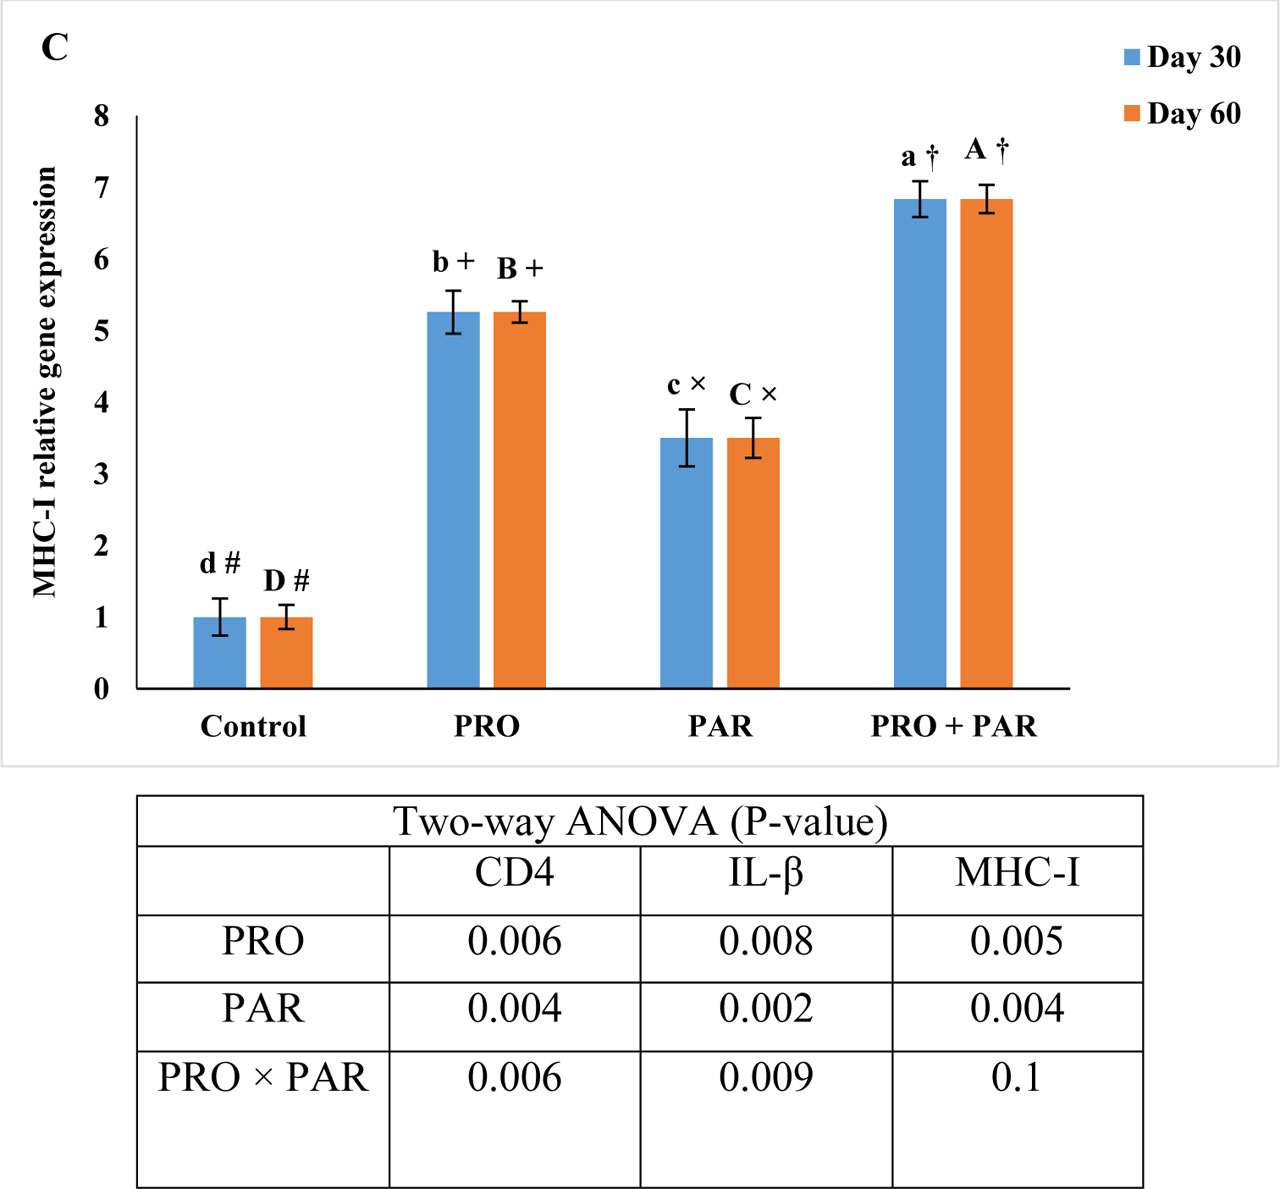
Figure 3.
Effects of the experimental supplements on the immune-related gene expression in the rainbow trout, Oncorhynchus mykiss over 30 and 60 days supplementation. Control: probioticparaprobiotic free commercial diet; PRO: diet containing 1.5 × 10⁶ Bacillus subtilis (probiotic) CFU/g diet; PAR: diet containing 1.5 × 10⁶ CFU/g diet inactivated Bacillus subtilis (paraprobiotic); PRO + PAR: diet containing 1.5 × 10⁶ CFU/g diet probiotic + 1.5 × 10⁶ CFU/g diet paraprobiotic. CD4: clusters of differentiation 4, IL-β: interleukin-β, MHC-I: major histocompatibility complex class I. Differences between the experimental treatments at day 30 are shown in lowercase subscripts (P<0.01). Differences between the experimental treatments at day 60 are shown in uppercase subscripts (P<0.01). Same symbols indicate no difference between day 30 and day 60 in each treatment (P<0.01)
Intestinal bacterial load
The effects of experimental supplements on total intestinal bacterial count (TBC) (Figure 4 A) and Bacillus spp. count (BAC) (Figure 4 B) of rainbow trout were assessed after 30 and 60 days of supplementation. At day 30 and day 60, no significant differences (P<0.01) were observed in the TBC among the experimental groups (P>0.01). At day 30, the control group (1.93±0.15 log CFU/g) had the lowest BAC, while the PRO + PAR (4.15±0.2 log CFU/g) and PRO groups (2.26±0.11 log CFU/g) showed a higher count, respectively (P<0.01). By day 60, significant differences (P<0.01) persisted in BAC. The PRO + PAR group (4.3±0.08 log CFU/g) had the highest count while the control (2.11±0.11 log CFU/g) maintained the lowest count (P<0.01). Except BAC in PRO treatment, no significant differences were observed between day 30 and day 60 for both TBC and BAC (P<0.01) across all treatments (P>0.01).
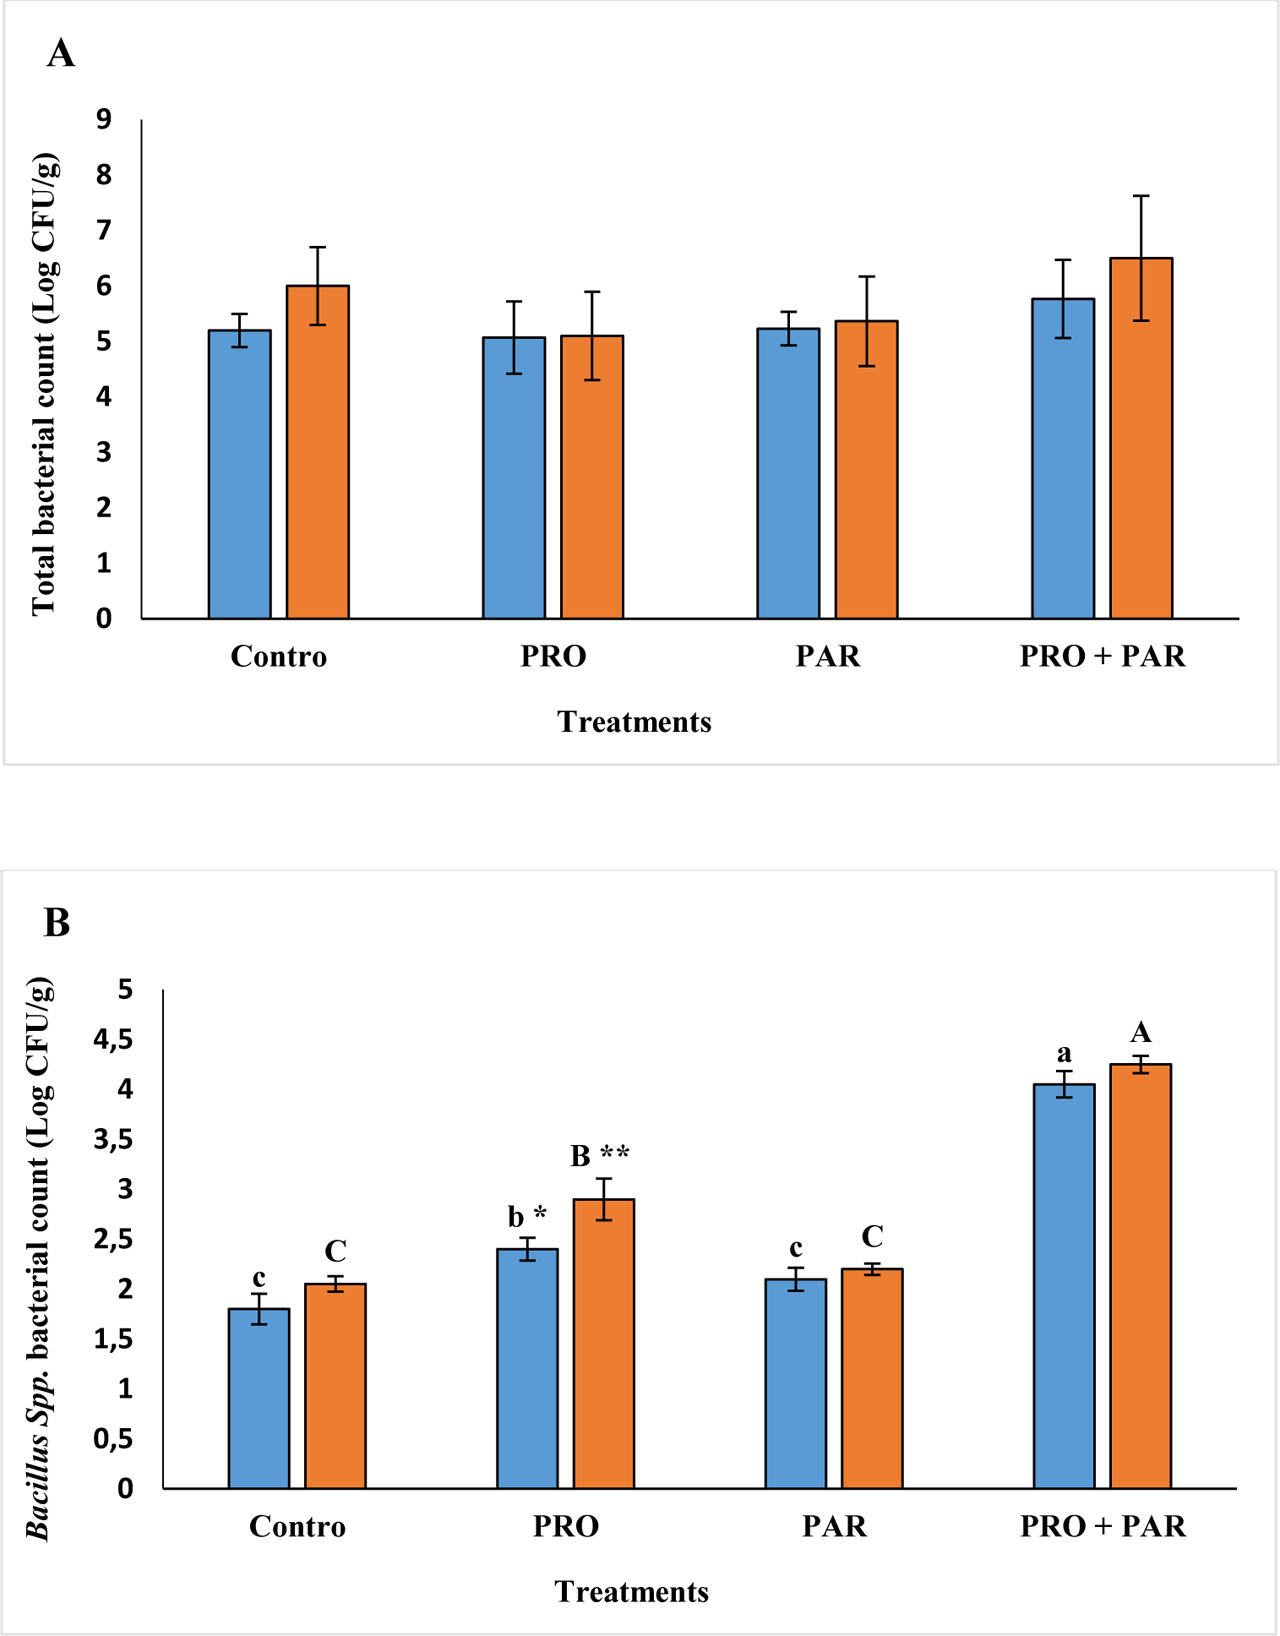
Figure 4.
The intestinal bacterial load in the rainbow trout, Oncorhynchus mykiss over 30 and 60 days supplementation. Control: probiotic-paraprobiotic free commercial diet; PRO: diet containing 1.5 × 10⁶ Bacillus subtilis (probiotic) CFU/g diet; PAR: diet containing 1.5 × 10⁶ CFU/g diet inactivated Bacillus subtilis (paraprobiotic); PRO + PAR: diet containing 1.5 × 10⁶ CFU/g diet probiotic + 1.5 × 10⁶ CFU/g diet paraprobiotic. Differences between the experimental treatments at day 30 are shown in lowercase subscripts (P<0.01). Differences between the experimental treatments at day 60 are shown in uppercase subscripts (P<0.01). Same symbols indicate no difference between day 30 and day 60 in each treatment (P<0.01)
Discussion
In this study, the probiotic, Bacillus subtilis in the live and inactivated forms, used alone or combined in the diet of the rainbow trout, altered the fish growth and immunity over the 60-day feeding trial. Since the long-term use of dietary supplements in aquaculture is usually expensive and accompanied high effort, therefore, we tested the performance of these experimental supplements in two periods of 30 days and 60 days. The growth data of this study showed that the growth parameters, including FW, WG, SGR, and FCR were improved over 60 days in the PRO and PAR treatments compared to the control group. Many studies have shown the improving impacts of Bacillus probiotics on fish growth (e.g., El-Haroun et al., 2006; Bandyopadhyay and Das Mohapatra, 2009; Standen et al., 2016; Ramos et al., 2017; Abarike et al., 2018; Elsabagh et al., 2018; Adorian et al., 2019). Bacillus subtilis at a dietary level of 1.19 × 10⁸ CFU/g improved growth performance in Nile tilapia (Mohammadi et al., 2020). In the same species, similar results were obtained by Zaineldin et al. (2018), when fish were fed a diet containing 104–1010 CFU/g probiotics. In the rainbow trout, a dietary level of 8 × 10⁷ CFU/g Bacillus subtilis improved the growth indices (Mahmoudzadeh et al., 2016).
Also, the improving effects of paraprobiotics on fish growth have been demonstrated (Yan et al., 2016; Van Nguyen et al., 2019; Hien et al., 2021; Duc et al., 2022). The probiotics improve fish growth mainly by improving nutrient assimilation, substituting beneficial bacteria removing gut pathogens, and producing extracellular enzymes (Das et al., 2017; Kuebutornye et al., 2020 b). Paraprobiotics are a killed type of probiotics that have advantages over probiotics in some ways, such as being available in pure form, easy to store and produce, and able to activate targeted responses in the body (Nataraj et al., 2020). In the present study, the use of PAR in the diet of the rainbow trout resulted in a better growth performance compared to control fish. However, a combination of PRO and PAR resulted in a better growth, which indicates their symbiotic function in promoting fish growth. In the treatment involving PRO and PRO + PAR supplementation, the population of Bacillus bacteria increased significantly, suggesting a positive impact of these supplements on the gut health of fish. A previous research has demonstrated similar changes in the intestinal microflora of fish due to probiotic supplementation, which can enhance fish growth and immunity against diseases (Burr et al., 2005). Probiotics promote beneficial bacterial populations by replacing pathogens and producing antimicrobial compounds (Burr et al., 2005). Interestingly, a synergistic effect was observed when probiotics were combined with the paraprobiotic, leading to a greater increase in Bacillus counts, while use of paraprobiotic alone showed an insignificant impact on fish intestinal flora. Although paraprobiotics are not viable to colonize fish gut, they retain many of the beneficial effects of live probiotics due to the presence of bioactive components in their cell walls, metabolites, and other cellular components (Piqué et al., 2019; Akter et al., 2020). Studies have shown that paraprobiotics can enhance gut microflora through stimulating the production of antimicrobial peptides, strengthening the intestinal mucosal barrier, creating hostile environments for pathogens and modulating the immune response, and thereby assisting to reduce pathogenic bacteria. Through these actions, paraprobiotics support a healthier gut environment, promoting the growth of beneficial microbes while limiting harmful ones (Akter et al., 2020).
The immune system and antioxidant status are key indicators when evaluating dietary supplements in aquaculture. Our study showed that probiotic (PRO) and paraprobiotic (PAR) supplementation, individually and in combination, significantly improved immune parameters in fish. The enhancements were noted in lysozyme activity, alternative complement pathway activity (ACH50), and total immunoglobulin (Ig) levels, with the combined PRO + PAR treatment producing the strongest effects. Lysozyme, an essential innate immune enzyme that disrupts bacterial cell walls (Saurabh and Sahoo, 2008), was highest in the PRO + PAR group at both 30 and 60 days, suggesting synergistic stimulation. These results align with prior reports of probiotics (Nayak, 2010) and paraprobiotics (Taoka et al., 2006; Singh et al., 2017; Giri et al., 2020) enhancing lysozyme activity in fish. Similarly, complement activity (ACH50) was significantly elevated, especially in the combined treatment, reflecting stronger opsonization and pathogen clearance (Holland and Lambris, 2002). These findings corroborate earlier evidence of probiotics (Ramos et al., 2015; Rahimi et al., 2022) and paraprobiotics (Díaz-Rosales et al., 2006; Giri et al., 2020; Jafarzadeh et al., 2024) stimulating the complement system. IgM levels, representing humoral immunity, were also markedly higher in the PRO + PAR group. Immunoglobulins are central to pathogen recognition and neutralization (Yu et al., 2020), and their enhancement here suggests robust immunostimulation. The time-dependent increases in Ig from day 30 to day 60 indicate sustained effects. Previous studies also report probiotics (Aly et al., 2008; Lee et al., 2017; Hajirezaee et al., 2024) and paraprobiotics (Sharifuzzaman et al., 2011) boosting Ig production, supporting our findings. Overall, the synergistic effect of PRO and PAR suggests they jointly strengthen innate and adaptive immunity, enhancing fish resistance against disease challenges.
In the present study, the expression of immune-related genes including CD4, IL-β and MHC-I was measured. The results showed that the PRO and PAR alone or in the combination form promoted trout immunity due to a higher expression of these genes in the supplemented fish compared to control fish. MHC-I is an essential molcule in the specific cellular immune system of vertebrates, including fish (Yamaguchi and Dijkstra, 2019). The main function of MHC-I is antigen presentation, which is accomplished through the binding of this protein to the antigen, as a result of which it is possible to recognize pathogens by lymphocytes (Fischer et al., 2005; Peatman et al., 2008). CD4 is a membrane glycoprotein, belonging to the Ig superfamily, which is involved in cell-mediated immunity as a T cell receptor. CD4 expressed in the T-helper lymphocytes has the main role in activating and stimulating other leukocytes (Santos et al., 2019).
In the rainbow trout, two different genes encoding CD4 including “Trout CD4” and “CD4REL” have been identified that resemble mammalian ones (Laing et al., 2006). “Trout CD4” encodes four extracellular Ig domains, while “CD4REL” codes for two Ig domains (Laing et al., 2006). IL-β is an important component of the fish immune system, which is involved in triggering inflammatory reactions to pathogens (Secombes, 2022). Similar to the results of this study, stimulation of the expression of immune-related genes by probiotics has been also reported in some studies. For instance, in humpback grouper, Cromileptes altivelis dietary administration of Lactococcus lactis HNL12 induced the expression of MHC-I (Sun et al., 2018). These authors concluded that probiotics may promote the presentation of antigens and activate MHC-I and II pathways (Sun et al., 2018). Use of Bacillus coagulans in the diet of turbots, Scophthalmus maximus enhanced the expression of MHC-I and IL-β within a 10-day period of supplementation (Guangxin et al., 2022). Dietary administration of a probiotic mixture (Paraburkholderia fungorum, Bacillus cereus, Enterobacter ludwigii strain) significantly increased the gene expression of MHC-I and IL-β in giant grouper, Epinephelus lanceolatus (Xiao Joe et al., 2021). Supplementation of largemouth bass (Micropterus salmoides) with 108 CFU/g Cetobacterium somerae significantly up-regulated the expression of IL-β gene (Zhang et al., 2023). Also, in grass carp, Ctenopharyngodon idella, the expression of MHC-I gene in the kidney was elevated in response to dietary Bacillus velezensis B8 over 2–3 weeks of feeding (Wu et al., 2021). In a study by Picchietti et al. (2009), the expression of IL-β gene increased, while CD4 expressions remained unchanged after dietary administration of Lactobacillus delbrueckii (Picchietti et al., 2009). In zebrafish, dietary B. subtilis KM0/Phy (1 × 10¹⁰ CFU/g) induced a 4.4–fold elevation in CD4 gene expression in kidney tissue (Santos et al., 2019). Unlike probiotics, the effects of paraprobiotics on immune parameters, especially the expression of related genes, are unknown to some extent. Only a few in vitro and in vivo studies in other vertebrates have shown that paraprobiotics can stimulate the expression of inflammatory genes such as IL-10, IL-12, IFN-ɣ in splenocytes (Chuang et al., 2007; Marcial et al., 2017). In general, the immunogenic role of paraprobiotics is similar to probiotics. Paraprobiotics prevent the penetration of pathogens into epithelial cells, and bacterial translocation, regulate inflammatory responses, modulate Th1- and Th2-mediated immune reactions, and antagonize pathogens with antimicrobial compounds (Yeşilyurt et al., 2021). In this study, supplementation of triut with PAR and PRO enhanced the fish immunity by inducing immune-related gene expressions. Also, the highest expressions were observed in the treatment PRO + PAR, suggesting a synergic interaction for PAR and PRO in enhancing immunity.
The antioxidant defense system, consisting of enzymatic such as SOD, CAT and GPx, and also non-enzymatic components, plays a key role in protecting fish against oxidative stress (Hoseinifar et al., 2020). In this study, supplementation with probiotics (PRO) and paraprobiotics (PAR) significantly increased antioxidant enzyme activities and TAC at both 30 and 60 days, with stronger effects after prolonged feeding. Probiotics generally outperformed paraprobiotics in stimulating antioxidant defenses. Previous studies have also confirmed that Bacillus subtilis enhances SOD, CAT, and GPx activities in various fish species such as grass carp and Prussian carp (Tang et al., 2019; Yin et al., 2019). While probiotic effects are well documented (Gobi et al., 2018; Hoseinifar et al., 2020; Qin et al., 2020; Yang et al., 2020), evidence for paraprobiotics remains limited (Yang et al., 2020). These findings emphasize the importance of Bacillus-based supplementation in strengthening fish antioxidant systems.
Also, the probiotic-induced elevations in antioxidant enzymes have been indicated in Nile tilapia (Dawood et al., 2020), grass carp (Tang et al., 2019; Xue et al., 2020), iridescent shark, Pangasianodon hypophthalmus (Abdel-Latif et al., 2023), common carp, Cyprinus carpio (Zhang et al., 2017), turbot, Scophthalmus maximus L. (Li et al., 2019) and rainbow trout (Habibnia et al., 2024). According to the literatures, although the mechanisms involved in the antioxidant properties of probiotics are still largely unknown, these properties may be exerted through producing antioxidant metabolites and compounds stimulating the antioxidant system, mediating antioxidant signaling pathways, regulating the enzymes producing ROS and modulating intestinal microbiota (Wang et al., 2017).
The antioxidant effects of paraprobiotics in fish remain underexplored, though recent studies suggest promising outcomes (Giri et al., 2020; Shawky et al., 2023). Heat-inactivated Bacillus subtilis enhanced SOD, GPx, and CAT activities in striped catfish (Pangasianodon hypophthalmus) (Shawky et al., 2023), while heat-killed Pseudomonas aeruginosa VSG2 also boosted GPx and SOD (Giri et al., 2020). Similarly, heat-killed Bacillus sp. SJ-10 increased SOD activity in olive flounder (Paralichthys olivaceus) (Hasan et al., 2019). In our study, antioxidant enzyme activities peaked in the combined PRO + PAR group, suggesting synergism between probiotics and paraprobiotics. Serum biochemical indices further reflected improved physiological health, with ALB increasing only in the PRO + PAR group and TP elevated across all supplemented groups. Comparable increases in TP and ALB have been observed in probiotic-supplemented fish (e.g., Nandi et al., 2017; Valiallahi et al., 2018; Akbari et al., 2021; Choudhary et al., 2021; Hassaan et al., 2021; Eissa et al., 2022; Taherpour et al., 2023), though paraprobiotic data remain scarce (Shawky et al., 2023; Wu et al., 2023). Probiotics are also known to enhance hepatic protein synthesis (Harding et al., 2008; Krishna Rao and Samak, 2013; Kim et al., 2021), though mechanisms in fish are not yet clarified.
The liver is the most important site for the synthesis of proteins and ALB, and therefore, protein and ALB levels in serum are a function of their hepatic synthesis (Li et al., 2022; Saed et al., 2023). Regulating osmotic pressure and transporting substances in the blood are among the most important functions of ALB (Andreeva, 2019; Espinosa and Esteban, 2020). In fish, ALB also plays an important role in the immune system as an antioxidant (Roche et al., 2008; Ghafarifarsani et al., 2022). Total protein is one of the components indicating immune and health status in fish, because globulins form a significant part of serum protein (Yarahmadi et al., 2016; Fawole et al., 2017). A combination of PAR and PRO had the greatest effect on increasing the levels of ALB and TP in trout. Also, the use of a combination of PRO and PAR for 30 days resulted in the same TP and ALB levels as the 60 days. In this study, the serum levels of TG decreased following the supplementation of the fish with PAR and PRO alone or in combination form. Also, a 60-day use of the supplements had a greater effect on TG reductions than the 30 days. Furthermore, a combination of PAR + PRO had more impact on reducing the TG levels. The reduction in TG levels observed in the probiotic treatments could be attributed to the impact of probiotics on lipid metabolism and their ability to decrease fat deposition, as noted in the study conducted by Feng et al. (2021) in the Chinese perch, Siniperca chuatsi. It seems that paraprobiotics have the same effects as probiotics on lipid metabolism (Lee et al., 2018; Sagada et al., 2021; Fan et al., 2022), as we observed a significant decrease in serum TG levels.
Increased levels of liver enzymes in the blood can indicate liver damage and disorders, although this marker is not necessarily specific (Rudneva et al., 2012; Mohamed et al., 2019). In the present study, it seems that both PAR and PRO and their combination have a protective effect on the liver, because the levels of AST and ALT in these treatments, especially in PAR + PRO treatment, were lower than the control group. Similar to our results, the protective effect of probiotics and paraprobiotics on the liver and their role in reducing the serum levels of fish hepatic metabolic enzymes have been previously demonstrated (Mohapatra et al., 2012; Adorian et al., 2019; Mollanourozi et al., 2021). Also, some studies have reported no change in these enzymes in fish fed some probiotics (Nofouzi et al., 2019; Abdel-Latif et al., 2023). Glucose is an essential metabolite for energy supply in fish (Polakof et al., 2012). However, increased blood glucose level is a major marker of stress in fish (Sopinka et al., 2016). According to our results, PAR, PRO, and PAR + PRO decreased the serum glucose levels, which may suggest a stress-moderating role for B. subtilus in form of either probiotic or paraprobiotic. Glucose levels in the PAR + PRO treatment were lower than in other groups, which could suggest a synergistic effect of the supplements in reducing stress. In fish, the ameliorating effect of probiotics on stress has been indicated (Carnevali et al., 2006; Varela et al., 2010; Gonçalves et al., 2011; Sutthi and Van Doan, 2020), although the related mechanisms are still not well understood. Paraprobiotics seem to have a similar role in fish, however, there is not much study in this regard. For example, heat-killed Lactobacillus plantarum decreased cortisol levels and ameliorated the stress induced by ammonium chloride in the Nile tilapia (Van Nguyen et al., 2019). However, the stress-reducing effects of paraprobiotics have been confirmed in other vertebrates (Reber et al., 2016; Alqayim and Handel, 2018; Kang et al., 2021). Creatinine is a by-product of muscle metabolism, which is produced from creatine, an important energy-generating metabolite in cells (Kulkarni and Pruthviraj, 2016; Solomon and Oguike, 2017). The kidney plays an essential role in maintaining normal levels of creatinine, and any dysfunction of the kidney causes an increase in the concentration of creatinine in the blood (Kulkarni and Pruthviraj, 2016; Solomon and Oguike, 2017). In the present study, the serum concentration of creatinine showed a significant decrease at both day 30 and day 60 in the supplemented groups. The lowest creatinine levels were observed in the PAR + PRO group, indicating the more effective effect of the supplements when they act synergistically. Similar results were observed by Eissa et al. (2022), where dietary Pediococcus acidilactici probiotic decreased the serum concentrations of creatinine in the European sea bass, Dicentrarchus labrax. Ziaei-nejad et al. (2021) showed a decrease in serum creatinine after supplementation of the common carp with 108 CFU/g commercial Lactobacillus probiotic. The supplementation of the fish with PAR showed results similar to PRO treatment with creatinine level. We did not find any data on the effect of paraprobiotics on the blood creatinine levels in fish and even data were very rare for other vertebrates. For example, Zhu et al. (2020) observed a decrease in creatinine levels after feeding broilers with a diet containing heat-inactivated compound probiotics. In the study of Abdel-Tawwab et al. (2021), the serum levels of creatinine remained unchanged in the Nile tilapia after supplementation with Yucca schidigera, extract and/or yeast, Saccharomyces cerevisiae, suggesting that fish were unstressed. Anyway, the decreases in the creatinine levels of the treated fish may suggest a renal protective effect for the PAR and PRO (Abdel-Tawwab et al., 2021).
Conclusion
The study’s findings indicate that both probiotic and paraprobiotic forms of Bacillus subtilis enhanced growth and immunity in rainbow trout. Combining these two forms led to a superior performance, highlighting a synergistic effect. Notably, day 60 of the experiment yielded more favorable outcomes compared to day 30, emphasizing the benefits of long-term supplement use of these products.
Notes
[5] Data availability
The data that support the findings of this study are available upon reasonable request to the corresponding authors.
[6] Contributed by Author contributions statement
N.B: writing – original draft, formal analysis, methodology. M.T.E: supervision, conceptualization, resources, funding acquisition, writing – review and editing. M.S: supervision, conceptualization, project administration, writing – review and editing. B.O: supervision, funding acquisition. All authors reviewed the manuscript.
[7] Compliance with ethical standards
All applicable international, national, and/or institutional guidelines for the care and use of animals were followed.