
Figure 1.
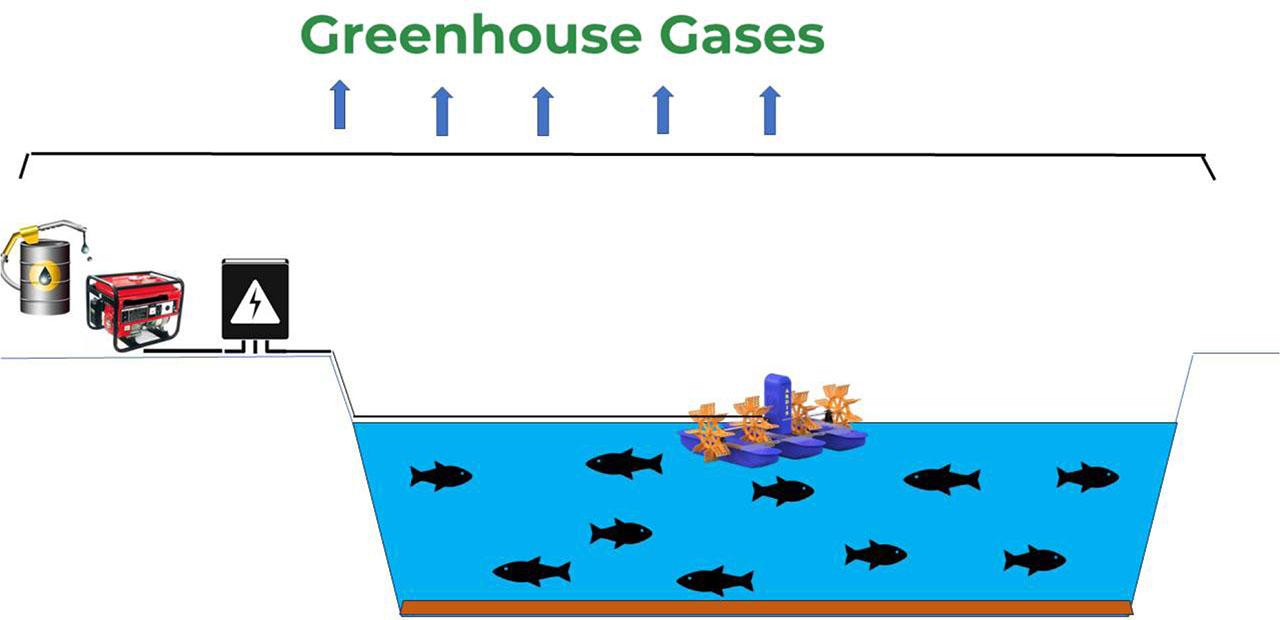
Figure 2.
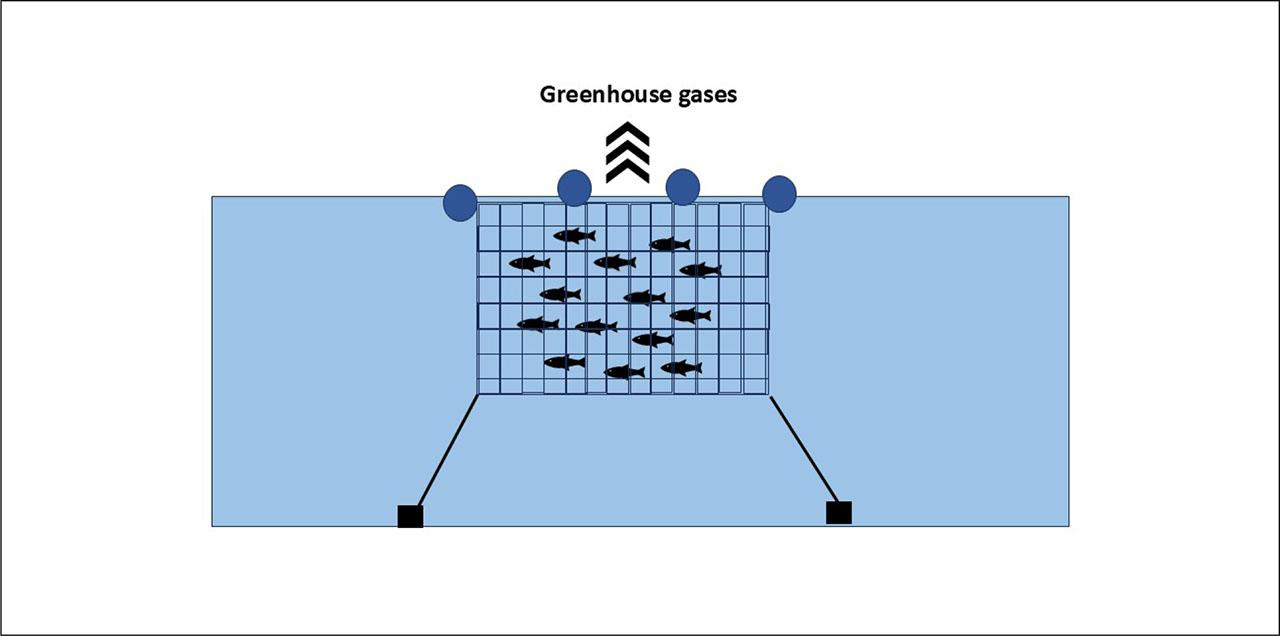
Figure 3.
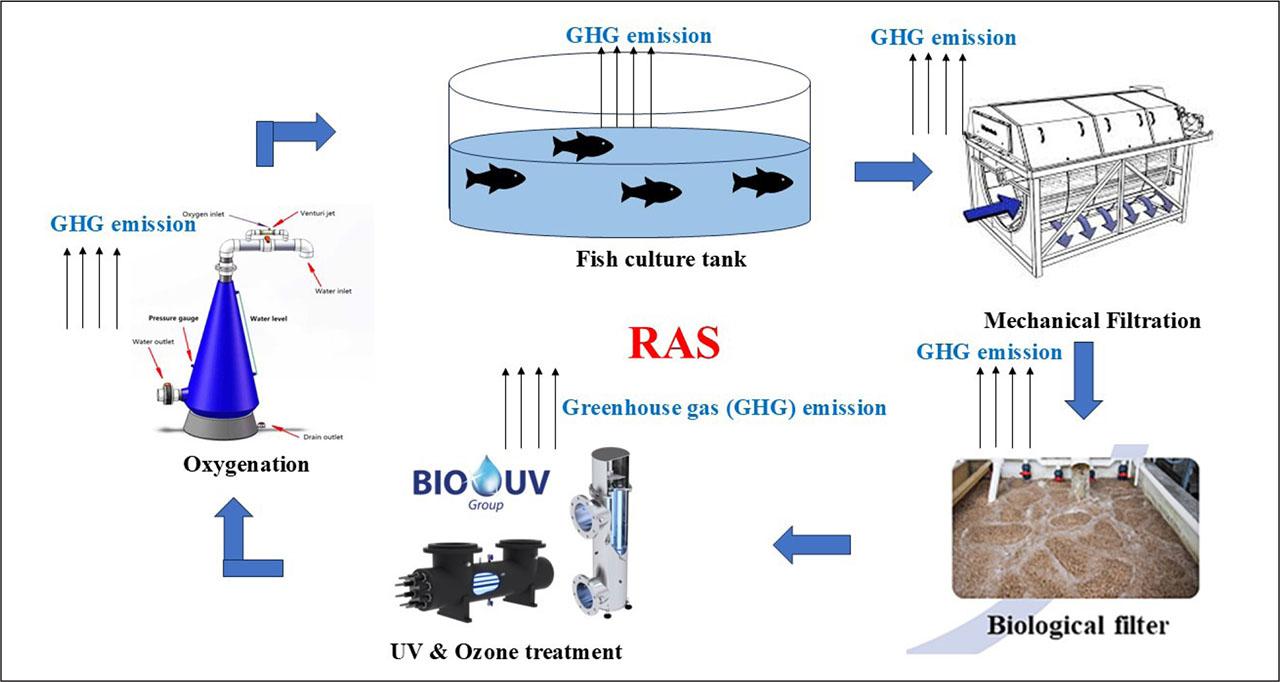
Figure 4.
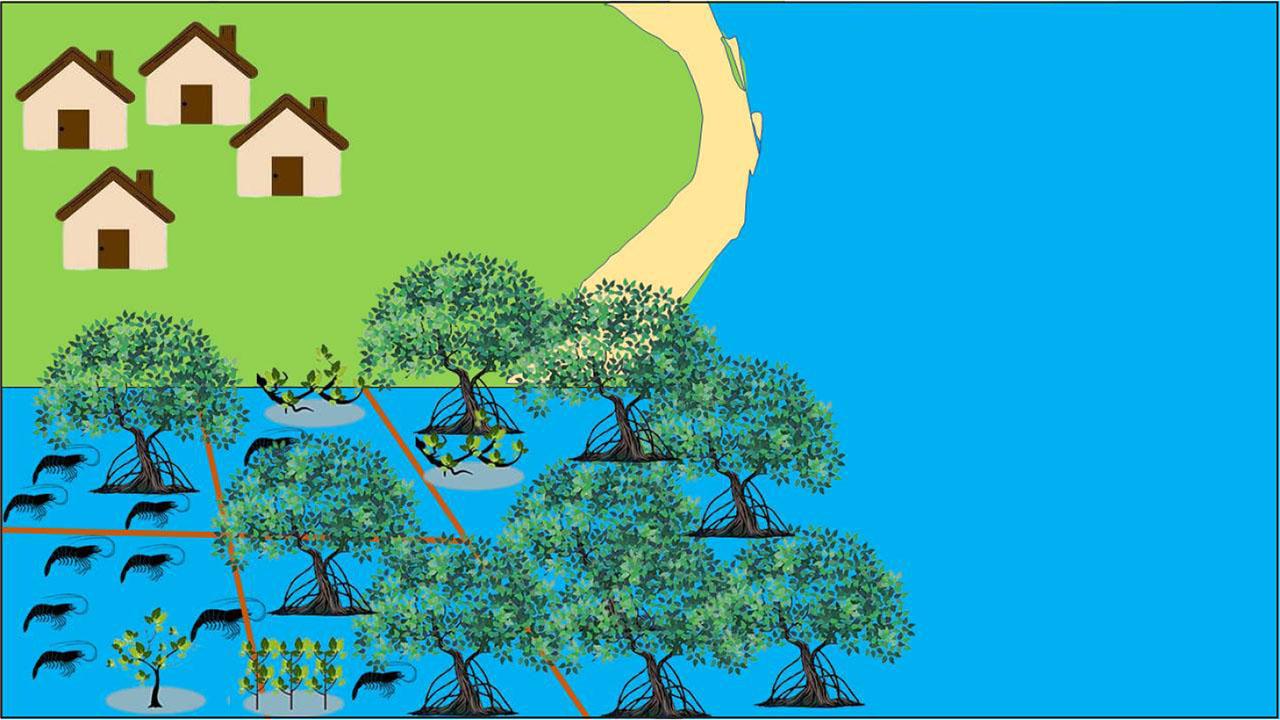
Figure 5.
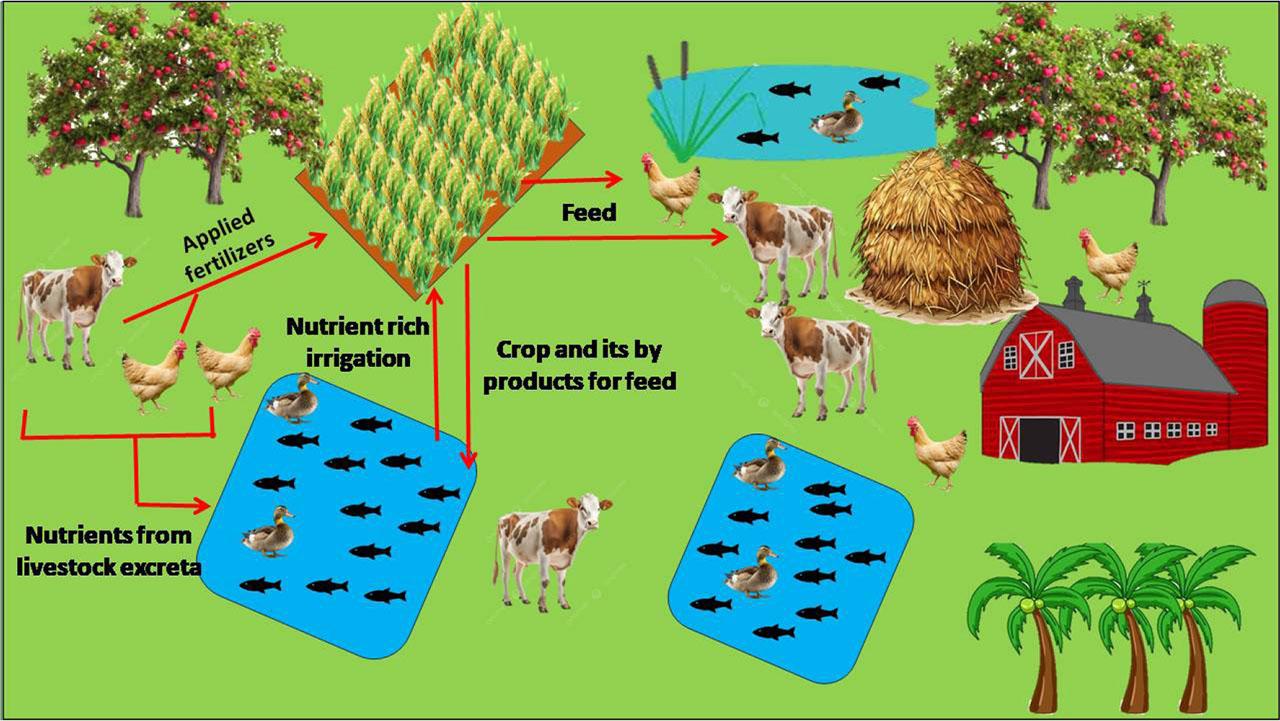
Figure 6.
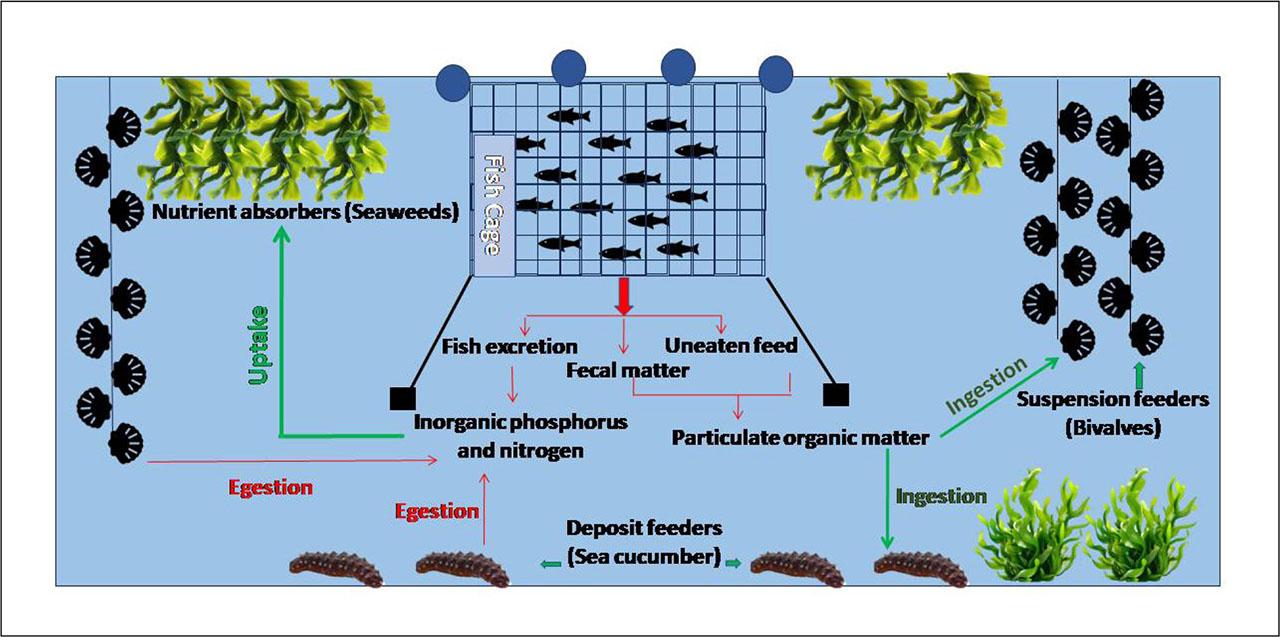
Figure 7.
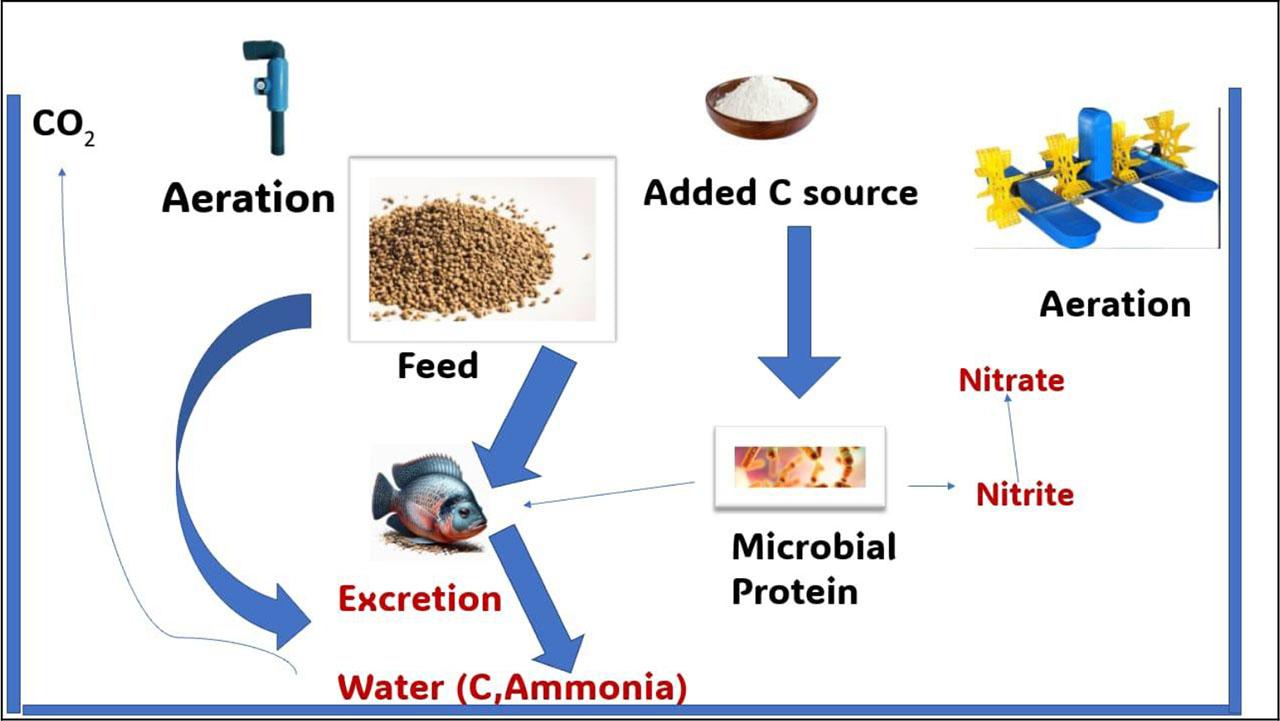
Figure 8.
Emission status of various GHGs in India (1980 and 2018)
| Greenhouse gases | 1980 value | 2018 value | Unit | Main source | References |
|---|---|---|---|---|---|
| Carbon dioxide (CO2) | 1.82 | 16.39 | Quad BTU | Electricity sector (75.31%) which mainly relies on coal | Ahmed et al. (2023) |
| Methane (CH4) | 444,528 | 666,510 | kt CO2e | General emissions | Ahmed et al. (2023) |
| Nitrous oxide (N2O) | 114,802 | 253,790 | Thousand metric tonnes CO2e | Agriculture (wheat, paddy) | Lu et al. (2022); Ahmed et al. (2023) |
Different amounts of GHGs emitted from various aquaculture systems
| Aquaculture system | Types | Quantity of greenhouse gases emitted | Unit | References |
|---|---|---|---|---|
| Pond culture | Vietnamese striped catfish | 1.37 | tCO2e/t of live weight | Mungkung et al. (2014) |
| Bangladeshi Nile tilapia system | 1.58 | tCO2e/t of live weight | ||
| Indian major carp system | 1.84 | tCO2e/t of live weight | ||
| Cage culture | O. mykiss cage farming | 1.13 | kgCO2e/kg of live fish | Diken et al. (2022) |
| Larimichthys polyactis | 7.553 × 10⁴ | kgCO2e/tonne | Liu et al. (2023) | |
| Sea cucumber (Apostichopus japonicus) | 5148.7 | kgCO2e/tonne | Yang et al. (2024) | |
| Dicentrarchus labrax | 2.34 to 2.85 | kgCO2e/kg | Bahida et al. (2022) | |
| Bivalve aquaculture | Mussels raised on floating platforms | 500 | kgCO2e/tonne | Tamburini et al. (2019) |
| Long lines of cultivated oysters | 1500 | kgCO2e/tonne | ||
| Shrimp farming (Penaeus vannamei) | Taiwanese farm | 6.9389 | kgCO2e/kg | Chang et al. (2017) |
| Mexican farm | 7.6 | kgCO2e/kg | Cortés et al. (2021) | |
| High-place ponds (HPP) | 4,424.2 | kgCO2e | Sun et al. (2023) | |
| Biofloc technology (BFT) | 4,657.2 | kgCO2e | ||
| RAS | Northern Chinese indoor RAS (Salmo salar) | 16.7 | tCO2e/tonne | Song et al. (2019) |
| P. vannamei | 13769.32 to 14860.87 | kgCO2e/tonne | Rong et al. (2025) | |
| O. niloticus | 2.03 | kgCO2e/kg | de Melo Júnior et al. (2025) | |
| P. vannamei | 4,965.6 | kgCO2e | Sun et al. (2023) |
GHG emissions intensity of various integrated farming systems (Fatima et al_, 2023)
| Different integrated systems | GHG intensity (kg CO2e/kg food production) |
|---|---|
| Crop + dairy + fishery | 0.189±0.019 |
| Crop + dairy + fishery + poultry | 0.183±0.021 |
| Crop + dairy + fishery + poultry + duckery | 0.176±0.023 |
| Agriculture crops + dairy + fisheries + poultry + duck farming + apiaries | 0.172±0.024 |
| Agriculture crops + dairy + fisheries + poultry + duck farming + apiaries + boundary plantation | 0.170±0.025 |
| Agriculture crops + dairy + fisheries + poultry + duck farming + apiaries + boundary plantation + biogas unit | 0.169±0.025 |
| Agriculture crops + dairy + fisheries + poultry + duck farming + apiaries + vermicompost + biogas unit + boundary plantation | 0.164±0.027 |
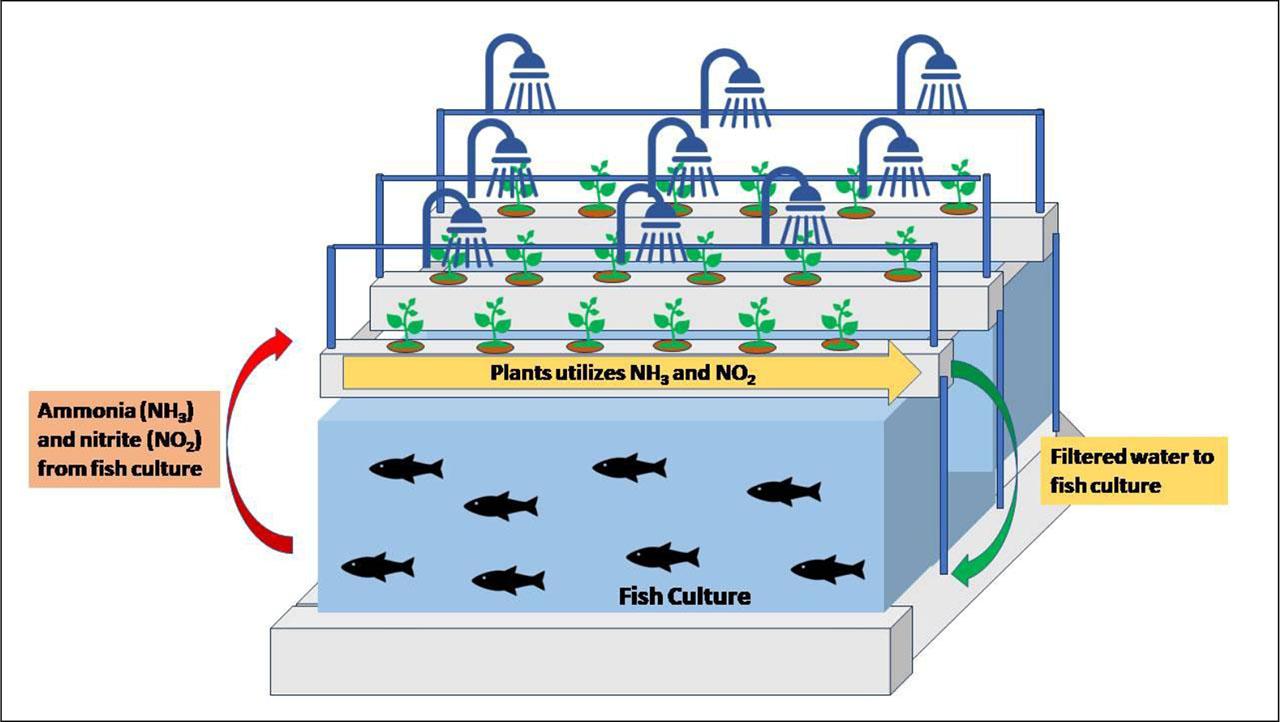
Greenhouse gas emissions from sustainable aquaculture systems
| Type of aquaculture system | GHG emission | Reference | |
|---|---|---|---|
| Integrated multi-trophic aquaculture (IMTA) | Abalone farming | Decreased by 290 to 350 tCO2e/year | Nobre et al. (2010) |
| Biofloc system | Shrimp farming | 5945 kgCO2e/tonne | Huang et al. (2024) |
| Aquaponics system | Pilot scale system | Fish tank – 52.8 to 131.3 kg CO2e; clarifier – 9.8 to 16.2 kg CO2e; plant growth system – 0.3 to 1.0 kg CO2e. | Kalvakaalva et al. (2022) |