
Aquaculture has expanded rapidly over recent decades, now serving as a major contributor to global food production (Boyd et al., 2022). This growth is promoted further by population expansion, changes in dietary preferences, and the depletion of wild stocks, which have increased the demand for seafood (Blanchard et al., 2017; Rather et al., 2024). While aquaculture addresses this growing demand, its rapid development has raised environmental concerns, specifically the emissions of greenhouse gases (GHG). According to the Emissions Database for Global Atmospheric Research (EDGAR), agriculture is one of the sectors with a significant carbon footprint, while aquaculture has been considered the sector with less carbon footprint (MacLeod et al., 2020). In aquaculture sectors, feed production processes and energy consumption are the major contributors to GHG emissions (Hilborn et al., 2018; MacLeod et al., 2020). Besides, aquatic organisms and microbes in the aquatic environment can transform the carbon in feeds into carbon dioxide (CO2) and methane (CH4) through biological processes and anaerobic decomposition, possibly contributing to GHG emissions (Zhang et al., 2024). A survey by the International Feed Industry Federation (IFIF) estimates that 1 billion tonnes of formulated feed are now used worldwide in fisheries and livestock, indirectly contributing 16 million tonnes of carbon to aquaculture systems from the feed sector (Raul et al., 2020). This potentially impacts the growing aquaculture industry’s contribution to global climate change through GHG emissions.
To escape climate change’s severe effects, the Inter-governmental Panel on Climate Change (IPCC) suggested that global GHG emissions should be reduced by 45% by 2030 to achieve zero emissions by 2050 (Anika et al., 2022). Without additional interventions, achieving these long-term goals will necessitate significant reductions in emissions over the next few decades, particularly in sectors such as transportation, where emissions are projected to increase by 2050 (Arroyo et al., 2017). The Paris Agreement also aimed to maintain global warming below 2 degrees Celsius (°C) and work toward a 1.5°C limit to mitigate climate impacts (Seneviratne et al., 2018). The concept of a carbon footprint has been developed to support these efforts. The carbon footprint method measures the GHG emissions of different public and private production and consumption sectors (SubhashreeDevasena et al., 2022). This measure has garnered attention from businesses, consumers, and policymakers alike. Investors and purchasing managers monitor the carbon impact of their portfolios to gauge investment risk, while consumers are increasingly presented with carbon-labelled products (Hertwich and Peters, 2009; Miao et al., 2024). Given the significant contribution of food production to global emissions, particular attention must be paid to the carbon footprint of food, especially with the annual rise in aquatic food production from the aquaculture sector (MacLeod et al., 2020).
It is estimated that GHG emissions have caused approximately US$13 billion in damage to human health and US$0.679 trillion to the surrounding ecosystems (Adegbeye et al., 2019). Accurate estimation of GHG emissions from various aquaculture systems, alongside an in-depth understanding of the mechanisms of GHG production, is essential for establishing effective future mitigation strategies to support sustainable growth in the aquaculture sector (Robb et al., 2017). This article, therefore, aims to review the current status of carbon emissions from various aquaculture practices and their effective mitigation strategies through sustainable farming approaches, which aquafarmers around the globe can effectively adopt to promote sustainable aquaculture.
The term “carbon footprint” refers to all GHG emissions, mainly CO2 and CH4, directly or indirectly linked to a person, group, occasion, organisation, product, or country (Zhang et al., 2024). These emissions also include nitrous oxide (N2O), ozone, and water vapour, which are present in Earth’s atmosphere (Buder, 2020). Generally, the carbon footprint of a product is measured by life cycle assessment (LCA), which considers the total GHG emissions produced over the product’s lifespan from raw material to discarding (Correa et al., 2019). Carbon footprint measuring is also called consumption-based accounting (Tukker et al., 2020), as it quantifies the GHG emissions generated at each stage of the supply chain, including production, manufacturing, usage, and end-of-life phases (Wu et al., 2014). The ability of each GHG to trap heat varies, impacting climate change differently (Soeder, 2021). To standardize these emissions, they are typically expressed in carbon dioxide equivalents (CO2e), which account for the global warming potential (GWP) of each gas (Wright et al., 2011).
Carbon footprints are classified into two categories, namely primary and secondary footprints (Czerkauer-Yamu and Frankhauser, 2010). The primary footprint measures direct GHG emissions from using fossil fuels for transportation and energy. These emissions can be managed and reduced. Electricity in shrimp farms (Chang et al., 2017) contributes to a primary footprint. Secondary footprint measures the indirect GHG emissions associated with an individual or organization’s product life cycle. These emissions are generated indirectly and are generally less controllable. For example, in Atlantic salmon (Salmo salar) farming, a secondary carbon footprint is contributed by the production of feed, particularly the sourcing and processing of fish meal and fish oil (Shepherd et al., 2017).
There are several methods to calculate a carbon footprint, with common approaches including (Pandey et al., 2011):
Life Cycle Assessment (LCA): A comprehensive approach that considers all greenhouse gas emissions generated throughout a product or activity’s entire life cycle (Pacana and Siwiec, 2024).
Product Carbon Footprint (PCF): A specific method for calculating the carbon footprint of individual products (He et al., 2019). However, this method has a drawback of high cost for data collection, modelling and large time investments (Henriksson et al., 2015).
Organizational Carbon Footprint (OCF): A method designed to assess the total carbon footprint of an organization (Awanthi and Navaratne, 2018). However, a limited focus on the direct emissions from an organization’s activities may not cover major GHG emissions, leading to a misinterpretation of the resulting GHG emissions from that organization (Radonjič and Tompa, 2018).
Even though different measurement methods reveal different results (Zhang et al., 2020 a), these standardized methods help in consistent assessment across various contexts, enabling stakeholders to develop effective strategies for emissions reduction (Castilla-Gavilán et al., 2024). In this regard, an evaluation of the GHG emissions of developing countries such as India is needed because of their complex and increasingly changing consumption patterns and significant contribution to climate change (Lee et al., 2021).
India’s energy consumption primarily depends on fossil fuel use, as indicated by the consistent trend of CO2 emissions since 1980 (Table 1). In India, the historical pattern for methane emissions shows an upward trend annually (Ahmed et al., 2023). Emissions of N2O show an upward tendency over time (Lu et al., 2022).
Emission status of various GHGs in India (1980 and 2018)
| Greenhouse gases | 1980 value | 2018 value | Unit | Main source | References |
|---|---|---|---|---|---|
| Carbon dioxide (CO2) | 1.82 | 16.39 | Quad BTU | Electricity sector (75.31%) which mainly relies on coal | Ahmed et al. (2023) |
| Methane (CH4) | 444,528 | 666,510 | kt CO2e | General emissions | Ahmed et al. (2023) |
| Nitrous oxide (N2O) | 114,802 | 253,790 | Thousand metric tonnes CO2e | Agriculture (wheat, paddy) | Lu et al. (2022); Ahmed et al. (2023) |
Note: Quad BTU – Quadrillion British Thermal Units; ktCO2e – kilotonnes of carbon dioxide equivalent.
In India, the historical pattern of methane emissions has shown an upward trend annually. The primary cause of India’s approximately 17 million tonnes of N2O emissions is wheat and paddy production (Bijay and Singh, 2017; Tewatia and Chanda, 2017). According to Tewatia and Chanda (2017), N-fertilizer usage is projected to increase by 24 million tonnes in 2030 to fulfil the growing demands of India’s population. The Centre for Science and Environment (CSE) estimates that, under normal circumstances, India’s GHG emissions in 2030 will be 4.48 giga tonnes. The average annual carbon footprint of all Indians was calculated to be 0.56 tonnes of CO2e (SubhashreeDevasena et al., 2022). In 2017, approximately 0.49% of anthropogenic GHG emissions were emitted from global aquaculture, equating to about 263 million metric tonnes of CO2 equivalent (MacLeod et al., 2020).
Global aquaculture is essential to maintaining food security since it fosters economic growth and makes food more accessible and available (Subasinghe et al., 2009). However, to support the industry’s sustainable growth, it is vital to know its input to global GHG emissions and explore strategies for their reduction. The GHG emissions associated with major aquatic species raised for human consumption, such as bivalves, shrimp, prawns, and finfish (including catfish, cyprinids, Indian major carps, salmonids, and tilapia), are typically assessed through the LCA approach (MacLeod et al., 2020). This LCA framework quantifies emissions across the entire aquaculture supply chain from “cradle to farmgate” from the farm activities such as the production of raw materials of feed; transport and processing of materials associated with feed; production of feed in feed mills and transport to the farm; nurturing of fish in the culture water (MacLeod et al., 2020; Nilsson and Martin, 2022).
LCA is a practical method frequently used to evaluate the quantitative environmental impacts of technologies, processes, or products at various phases of their life cycles (Bohnes and Laurent, 2019). LCA includes assessments of global warming, acidification, carbon footprint, etc. (Shree et al., 2021). Generally speaking, a product or technology’s life cycle encompasses all phases of its existence from conception to death, including production, use, upkeep, and eventual destruction (Wang et al., 2019). The LCA methodologically constitutes one of the most sophisticated and accessible methods for multi-impact evaluation, focusing on measurable energy flows and emissions throughout the production process (Konstantinidis et al., 2020). Aquaculture studies are increasingly employing this tool (Wang et al., 2019). LCA has been used in the aquaculture industry for the past 16 years for rearing technologies (Henriksson et al., 2017; Philis et al., 2019), aquaculture feeds (Avadí et al., 2020), and many species, including S. salar (Ayer et al., 2016), rainbow trout (Oncorhynchus mykiss) (Aubin et al., 2009; Chen et al., 2015; Silvenius et al., 2017; Pouil et al., 2024), striped catfish (Pangasianodon hypophthalmus) (Nhu et al., 2016), Nile tilapia (Oreochromis niloticus) (Henriksson et al., 2017), turbot (Scophtalmus maximus) (Aubin et al., 2009) and giant freshwater prawn (Macrobrachium rosenbergii) (Santos et al., 2015). The importance of the industry and the tool’s utility are demonstrated by the growing number of pertinent LCA studies published on species of Mediterranean provenance, including gilthead seabream (Sparus aurata) (Basto-Silva et al., 2019) and European seabass (Dicentrarchus labrax) (Aubin et al., 2009; García García et al., 2019).
The source of GHG from aquaculture systems includes the following, namely: CO2: feed residues, faecal matter of fishes, manure applications, as well as dead phytoplankton biomass, which also contribute to the organic matter content in most aquaculture systems (Sabu, 2022). CH4: bottom sediment is the major site. An increase in temperature stimulates methanogenesis activities, which would contribute to higher CH4 emissions (Wang et al., 2018 a). N2O: released from the degradation of the uneaten protein-rich aquafeed and faecal excreta of fishes. Algal photosynthesis also releases N2O. 90% of N2O is produced by denitrification and 10% by nitrification (Yang et al., 2015).
In assessing these emissions, it becomes clear that reducing the carbon footprint of aquaculture requires targeted improvements across multiple areas. Sustainable practices within aquaculture systems, such as utilizing low-impact feed options and optimizing resource usage, are critical to minimizing the environmental impact caused by the industry and ensuring its viability (Zhang et al., 2024).
Earthen fish ponds, entirely made of soil components, are the most commonly utilized facilities in aquaculture (Kosten et al., 2020). These shallow ponds are thought to be responsible for more than 80% of aquaculture’s GHG emissions (Figure 1), making them significant emission hotspots (Yuan et al., 2019). Frequent additions of feed or manure to these ponds are intended to boost primary production, resulting in increased levels of organic matter, further contributing to GHG emissions (Rutegwa et al., 2019; Huang et al., 2020). These ponds’ key sources of labile organic matter include fish waste, primary production, unconsumed feed, and runoff from nearby catchments (Kosten et al., 2020; Emerenciano et al., 2025). This abundance of organic matter supports high methanogenic rates, particularly in the anaerobic conditions just below the sediment surface (Wallenius et al., 2021). Hu et al. (2013) reported that the greater availability of ammonium (NH4+) and nitrate (NO3−) within these ponds may also enhance the nitrification and denitrification processes.
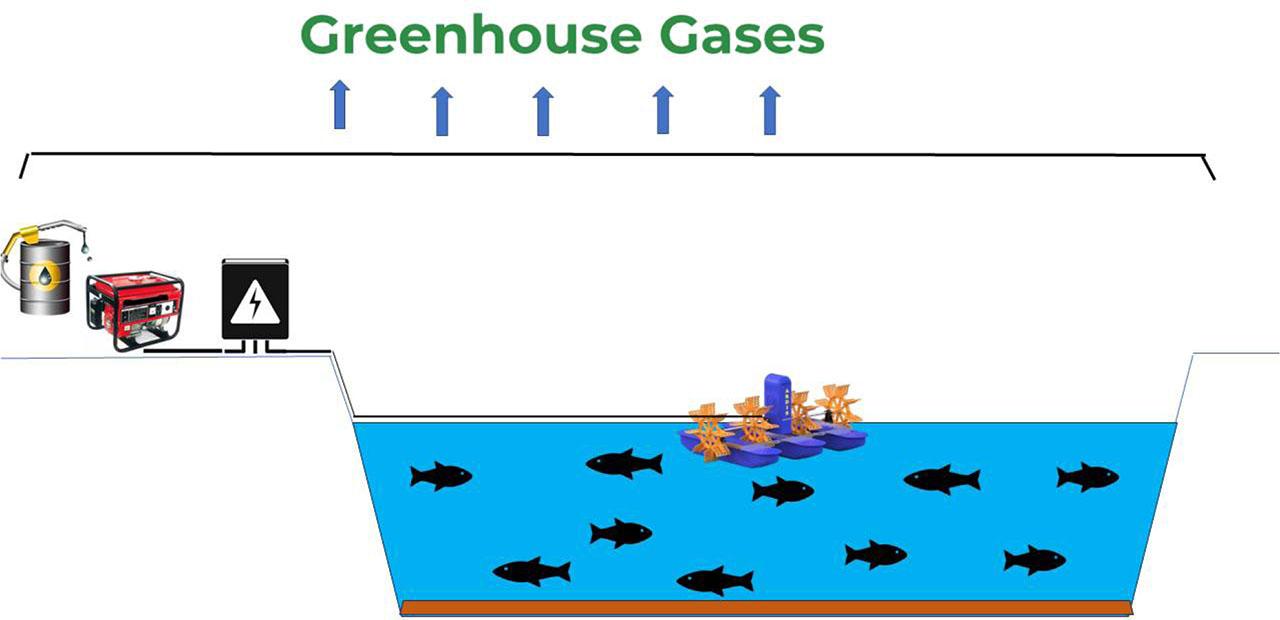
Greenhouse gas emissions from a pond aquaculture system. Modified from Zhang et al. (2022)
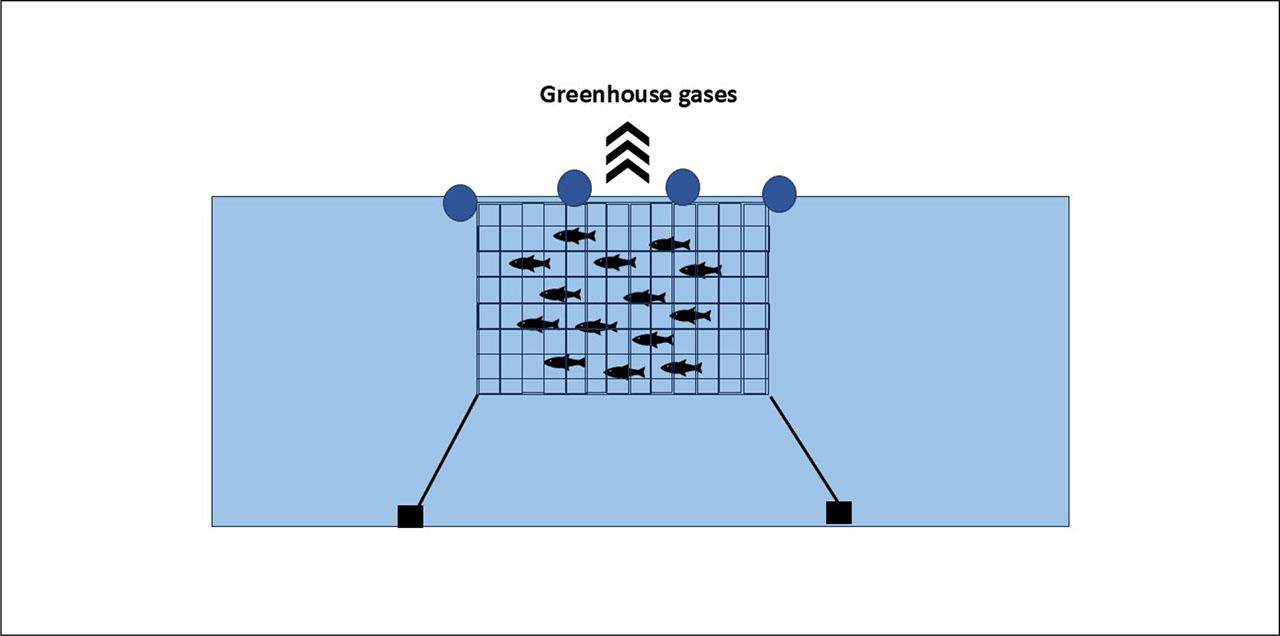
Greenhouse gas emissions from a cage culture system. Modified from da Silva et al. (2021)
Additionally, recent studies suggested that N2O production within the intestines of reared organisms, particularly shrimp, may add to overall emissions from the pond ecosystem (Heisterkamp et al., 2016). There is a limited understanding of the role played by the microbial population in fish gills, which may convert ammonia into nitrogen gas, potentially impacting pond emissions (Van Kessel et al., 2016). Regarding emission intensity, the average from three Asian pond aquaculture systems was reported by Mungkung et al. (2014) (Table 2).
Different amounts of GHGs emitted from various aquaculture systems
| Aquaculture system | Types | Quantity of greenhouse gases emitted | Unit | References |
|---|---|---|---|---|
| Pond culture | Vietnamese striped catfish | 1.37 | tCO2e/t of live weight | Mungkung et al. (2014) |
| Bangladeshi Nile tilapia system | 1.58 | tCO2e/t of live weight | ||
| Indian major carp system | 1.84 | tCO2e/t of live weight | ||
| Cage culture | O. mykiss cage farming | 1.13 | kgCO2e/kg of live fish | Diken et al. (2022) |
| Larimichthys polyactis | 7.553 × 10⁴ | kgCO2e/tonne | Liu et al. (2023) | |
| Sea cucumber (Apostichopus japonicus) | 5148.7 | kgCO2e/tonne | Yang et al. (2024) | |
| Dicentrarchus labrax | 2.34 to 2.85 | kgCO2e/kg | Bahida et al. (2022) | |
| Bivalve aquaculture | Mussels raised on floating platforms | 500 | kgCO2e/tonne | Tamburini et al. (2019) |
| Long lines of cultivated oysters | 1500 | kgCO2e/tonne | ||
| Shrimp farming (Penaeus vannamei) | Taiwanese farm | 6.9389 | kgCO2e/kg | Chang et al. (2017) |
| Mexican farm | 7.6 | kgCO2e/kg | Cortés et al. (2021) | |
| High-place ponds (HPP) | 4,424.2 | kgCO2e | Sun et al. (2023) | |
| Biofloc technology (BFT) | 4,657.2 | kgCO2e | ||
| RAS | Northern Chinese indoor RAS (Salmo salar) | 16.7 | tCO2e/tonne | Song et al. (2019) |
| P. vannamei | 13769.32 to 14860.87 | kgCO2e/tonne | Rong et al. (2025) | |
| O. niloticus | 2.03 | kgCO2e/kg | de Melo Júnior et al. (2025) | |
| P. vannamei | 4,965.6 | kgCO2e | Sun et al. (2023) |
Note: tCO2e/t – tonnes of CO2/tonne; kgCO2e/kg – kilograms of CO2e/kilogram; kgCO2e/tonne – kilograms of CO2e/tonne.
The practice of cage culture for fish has been in existence for centuries (Schmittou, 2024). Cage culture has several advantages over other fish farming methods, including the use of existing water bodies, which relieves land pressure, the need for relatively low capital investment, ease of mobility and relocation, a decreased impact of drought on production regarding accessibility to water, significantly higher output per single volume of water, relatively low investment per unit of production, potential significant levels of its viability, and management flexibility (Liu et al., 2023). Cage farming has a lower carbon footprint (Figure 2) than other methods, with low energy requirements and investment costs (Angel et al., 2019). Diken et al. (2022) evaluated the three-year carbon footprint of the O. mykiss cage farming project, which has an annual production capacity of 49 tonnes (Table 2). The total carbon footprint produced was equal to the sum of the carbon footprints of feed, general management, transportation, machinery, and equipment. The most considerable portion of the total carbon footprint was contributed by consuming a compound diet (73.69%), followed by general management (13.88%), of which labour and diesel made up 19.36% and 78.49%, respectively. Liu et al. (2023) and Bahida et al. (2022) revealed the carbon footprint released from the mariculture cages of the yellow croaker (Larimichthys polyactis) (Table 2). A major contributor to these carbon emissions was diesel consumption, which reached 6.69 × 10⁴ kg-CO2e/tonne and could be considered the primary source of carbon emissions. With a total emission of 0.793 × 10⁴ kgCO2e/tonne, wood was another significant source of carbon emissions. Electricity produces a carbon emission value of 5.56 × 101 kgCO2e/tonne. Traditional cages were made primarily of wood, which raised the cost of inputs and was prone to corrosion due to the influence of ocean salinity. GHG emissions rose due to wood substitution and processing (Liu et al., 2023). Similarly, Yang et al. (2024) also estimated the GHG emission from a marine cage farming of sea cucumber (Apostichopus japonicus) (Table 2) and major contributions have been observed from electricity consumption and coal-based electricity.
The astounding growth of shellfish aquaculture in recent decades has regained interest in crustaceans and molluscs’ potential uses and services (Zhao and Wu, 2024). Even yet, mussels raised on floating platforms or suspended from long lines have a carbon footprint of less than that of mussels based on the cradle-to-farm concept (Iribarren et al., 2012), it can rise in intertidal sandbanks or long lines of cultivated oysters (Table 2) (Tamburini et al., 2019). They influence the GHGs emitted from the bivalves, and the microbiological metabolism in the sediment is due to the faecal matter of the bivalves (Ray et al., 2019). They also emit CO2 at the time of the respiration process and as the end product of the process of shell calcification. N2O is emitted from the gut of the bivalves as it carries denitrifying microorganisms, and N2O is also found in the biofilm on the bivalve shell (Heisterkamp et al., 2013). However, compared to finfish aquaculture systems, the GHG emitted from bivalve farming is relatively less (Alonso et al., 2021).
From less than 9000 tonnes in 1970 to more than 5.4 million tonnes in 2019, the world’s whiteleg shrimp (Penaeus vannamei) production has grown by 600% in less than 50 years (Sun et al., 2023). However, this rapid growth has also increased the environmental risk of GHG emissions. LCA is applied in shrimp aquaculture, particularly when comparing various shrimp production techniques (Sun et al., 2023). The LCA method evaluated a Taiwan shrimp (P. vannamei) farm for its carbon footprint (Table 2). The top five factors that contributed most to the carbon emissions were waste treatment (0.7783 kgCO2e/kg, 11.40%), transportation and refrigerant (0.7524 kgCO2e/kg, 11.01%), indirect raw materials (1.4782 kgCO2e/kg, 21.62%), electricity (2.0093 kg-CO2e/kg, 29.39%), and feed (1.6395 kgCO2e/kg, 23.98%) (Chang et al., 2017). Similarly, Cortés et al. (2021) evaluated the carbon footprint of P. vannamei farming in Mexico using LCA (Table 2). Feed management and electricity usage are the primary factors contributing to GHG emissions. To overcome these hurdles, a comparative assessment of three production systems such as higher-place ponds (HPP), biofloc technology (BFT), and recirculating aquaculture systems (RAS), was carried out to identify the low carbon emission system by Sun et al. (2023) (Table 2). These findings suggest that combining BFT and RAS mitigates their negative environmental impacts. The recommended actions to enhance these aquaculture systems’ environmental performance are feeding control, wastewater treatment, and substituting feed additives (Munguti et al., 2020).
RAS is an alternative method to address the main environmental issues with traditional cage culture systems. The entire life cycle must be considered to evaluate the environmental performance of RAS farming properly (Badiola et al., 2012), which is needed for formulating sustainable ecological measures. S. salar raised at a Northern Chinese indoor RAS farm revealed that to produce one tonne of live-weight S. salar, 7509 kilowatt-hours (kWh) of farm-level electricity was used, which showed that the energy utilization contributes to the major GHG emissions (Song et al., 2019) (Table 2). Although RAS has efficient, controlled land-based operations and reduced environmental impact, it challenges climate goals due to its significant GHG emissions from energy-intensive processes (Figure 3) like water treatment (Zhang et al., 2023). It was estimated that RAS release GHG more than twice as much per gram as conventional fish farming systems (Tilman and Clark, 2014). Additionally, it was discovered that the carbon footprint of S. salar raised in open net pens (3.39 tCO2e/t) is double that of S. salar raised in RAS using electricity based on fossil fuel (7.01 tCO2e/t) (Liu et al., 2016). Rong et al. (2025) also estimated the carbon footprint of P. vannamei cultured in RAS (Table 2), which is mainly contributed by electricity, feed, and infrastructure. Another study by de Melo Júnior et al. (2025) showed that O. niloticus raised in an RAS tends to produce a carbon footprint in which 98% of direct emissions are mainly from the biofilter. The suggested environmental improvement approaches for RAS farms are optimizing stocking density, feeding management, grow-out effluent treatment, feed ingredient substitution, and energy-generating source selection (Song et al., 2019).
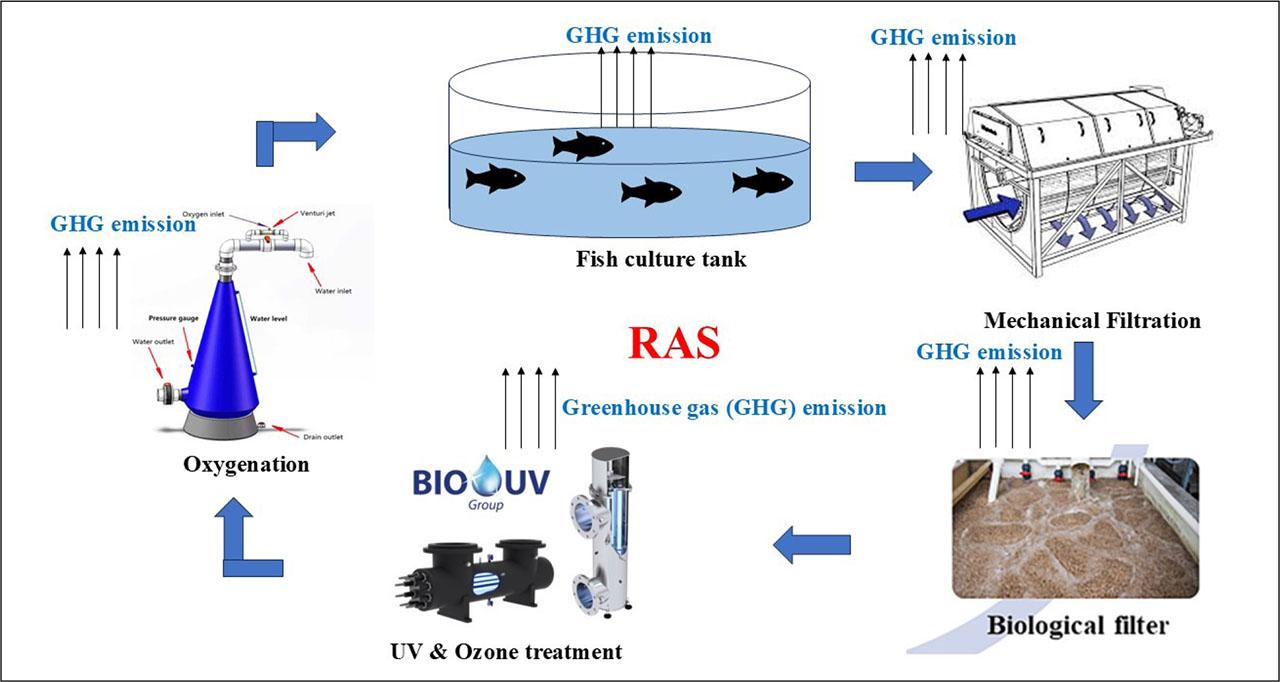
Greenhouse gas emissions from a recirculating aquaculture system (RAS). Source: Author
Farming of extractive (non-fed) marine organisms, such as amphipods, seaweeds, and bivalves, was considered a sustainable and eco-friendly method of aquaculture (Nijdam et al., 2012; Guerra-García et al., 2016; Hilborn et al., 2018). Seaweeds and bivalves release less GHG emissions among the above-listed extractive species, according to Gephart et al. (2021) and Jones et al. (2022). Both species are crucial for sequestering CO2, which helps mitigate global warming and climate change (Duarte et al., 2017, 2023; Feng et al., 2023). Because these extractive species are autotrophic, meaning they can absorb nutrients that dissolve and suspend particles from the water column, they can usually be grown with less energy and inputs. This reduces excess nutrient levels and improves water quality (Krause et al., 2022). Without requiring external nourishment, bivalves are very effective at turning organic materials into protein (Wright et al., 2018). This species integration improves the aquatic ecosystem’s health and reduces nutrient contamination (Feng et al., 2023).
Adopting low tropic level herbivorous fish species aquaculture has been identified as one of the sustainable approaches (Castilla-Gavilán et al., 2024). It has been shown that they offer benefits in terms of energy conversion and resource use because they typically require little nutrients, which they can get from microalgae or cultivable seaweeds (Castilla-Gavilán et al., 2024). Furthermore, the Food and Agricultural Organization (FAO) has suggested that aquaculture be developed for these species since they provide cheap production costs and high-quality meat in a favourable market demand setting, primarily in Asian nations (Tolentino-Pablico et al., 2009). Numerous research has been carried out worldwide to re-populate or commercialize their culture. It includes herbivorous fish species such as acha (Medialuna ancietae) (Lozano-Muñoz et al., 2022), rabbit fish species (Siganus spp.) (Li et al., 2018) and milkfish (Chanos chanos) (Jose and Divya, 2022).
One of the well-known strategies to reduce GHG emissions in aquaculture is to grow several species simultaneously in a single aquaculture system (Čížková et al., 2013; Raul et al., 2020). Polyculture systems enhance nutrient cycling and function as natural bioremediators by facilitating interactions among many species (Jones et al., 2022). This lessens the environmental impact on nearby ecosystems while improving the aquaculture system’s water quality. This nutrient cycle increases system efficiency overall, decreases waste and the need for waste management, and lessens the need for external inputs (Wang et al., 2014; Strand et al., 2019). Additionally, the requirement for additional feeds is reduced depending on the species’ ecological interactions, which has less environmental impact and saves farmer’s expenditure.
Natural wetlands are responsible for 20–30% of the worldwide terrestrial carbon sequestration (Lal, 2008; Mitsch et al., 2013). However, commercial shrimp and fish farming have disrupted several countries’ salt marshes, mangroves, estuaries and seagrass beds (Ahmed et al., 2017; Arifanti et al., 2019). The altered ecosystems of these wetlands may result in higher GHG emissions from the organic matter currently stored there. Numerous studies have shown that locations transformed into aquaculture ponds emit more GHG (Yang et al., 2017, 2022; Yuan et al., 2019). For example, aquaculture farms created in the Mahakam delta due to mangrove conversion resulted in a loss of 1,925 megagrams of CO2e/hectare (Mg CO2e/ha) (Arifanti et al., 2019). Similarly, the 100-year GWP increased from 8.15 to 28 Mg CO2e/ha when paddy fields were converted to big crab ponds, mainly due to 96.3% greater CH4 emissions (Yuan et al., 2019). In addition to sequestering carbon, mangroves, seagrass beds, estuaries, and salt marshes support nutrient cycling (Morris et al., 2013), offer essential habitats for aquatic life, and prevent coastline erosion. Due to their numerous advantages, these habitats should be preserved to promote sustainability and mitigate the effects of climate change (Castilla-Gavilán et al., 2024).
Aquaculture’s environmental impact is determined mainly by its feeding management (Holmer et al., 2008). In addition to increasing farmers’ operating expenses, inefficient feeding plays a significant role in the sector’s GHG emissions (Davis, 2022). Studies have been conducted to reconsider feeding practices, focusing on minimizing the environmental impact of aquafeed manufacturing by maximizing nutrient utilization, incorporating novel additives, and increasing the value of waste (Giamouri et al., 2023). Aquafeed manufacturing significantly contributes to marine aquaculture’s carbon footprint (MacLeod et al., 2020). Advancements in aquaculture nutrition science have highlighted alternative and sustainable feed ingredients. The choice of ingredients is the primary aspect of feeding efficiency; other factors include the feeding practices used on aquaculture farms (Robb et al., 2013). In addition to using less energy during processing, specific ingredients, such as plants and insects, positively impact wild fish populations and ecosystems (Nijdam et al., 2012). It has been shown that insect flour is nutrient-dense and high in lipids, protein, and essential amino acids (Gasco et al., 2018; Hachero-Cruzado et al., 2024). Raising insects for aquafeed offers several benefits from a sustainability perspective, including the potential to utilize organic waste, promote the circular economy, and provide environmental benefits through reduced land use (Quang Tran et al., 2022; Sogari et al., 2023).
Studies have revealed that certain feed additives can increase the feeding efficiency of the fishes (Encarnação, 2016; Ogunkalu, 2019). Compared to hormones or antibiotics, feed additives derived from organisms are more environmentally friendly (Ogunkalu, 2019). Aquafeeds commonly utilize oil and single-cell protein derived from bacterial, microalgal, or yeast biomass, which can also be sourced from discarded materials from other industries (Glencross et al., 2020; Pereira et al., 2022). Additionally, it has been demonstrated that these compounds have immunostimulant and probiotic effects on the cultured species (Glencross et al., 2020), as have some seaweed-derived compounds, such as the polysaccharide ulvan (Ponce et al., 2024). Additionally, adding enzymes to fish feed enhances feeding efficiency and digestibility (Liang et al., 2022). The use of enzymes in the diets of marine species has been the subject of very few investigations (Kalhoro et al., 2018). Nonetheless, the potential of animal waste materials, such as fish viscera, as a source of enzymes for marine fish diets has been emphasized (González-Riopedre et al., 2013). Automated feeding systems and real-time monitoring are examples of precision feeding technology that allow farmers to customize feed distribution to the unique nutritional requirements of their fish. This minimizes surplus feed and nutrient waste while ensuring the fish get the proper nutrition at the correct time, fostering healthier and quicker growth (Zhang et al., 2020 b).
Degraded uneaten feed and faeces from aquaculture operations generate substantial amounts of inorganic waste, primarily phosphate, nitrate, and ammonium. If not controlled, these wastes lead to environmental deterioration, including algal blooms and eutrophication (Farmer, 2018). These possible effects can be effectively mitigated by inorganic waste management technologies, such as the use of biofilters that convert ammonia wastes (Martins et al., 2010; Badiola et al., 2012) into less toxic compounds through nitrification (Camargo et al., 2005), which lessens the demand for water exchange, minimizes the release of nutrients into the environment, and advances waste treatment technologies like ozone and ultraviolet (UV) treatment (Tripathi and Hussain, 2022; Kurniawan et al., 2023) that enable more effective elimination of polluting contaminants in the aquaculture wastewater. Sand filters are the primary mechanical filtering method used in wastewater treatment. After that, sludges are recovered and stored in decantation tanks, which can be reused as fertilizer or converted into biofuels (Del Campo et al., 2010; Mirzoyan et al., 2010). It has also been emphasized that recovering biomolecules, including proteins, polysaccharides, and biosurfactants from the waste of fish, algae, and crustaceans, can be valuable (Alvarado-Ramírez et al., 2023). Furthermore, the current study’s primary focus has been on creating environmentally acceptable enzyme-assisted techniques for extracting such substances (Dumay et al., 2013; Le Strat et al., 2022; Le Guillard et al., 2023).
Aquaculture facilities can significantly reduce their carbon footprint by transitioning to renewable energy sources, such as solar panels, photovoltaics, or wind turbines; utilizing fully electric and hybrid trucks; and employing alternative fuels for vessels, including electricity, natural gas, biodiesel, and methanol (Li et al., 2025). Heating is often necessary for aquaculture operations to maintain optimal water temperatures, particularly in colder regions or during winter. Waste heat from the industry (Kuyumcu et al., 2016) or the aquaculture process itself (effluent treatment or water recirculation) (Ion et al., 2022) can be captured by heat recovery systems. The culture units can then be heated again using this waste heat. Research has examined waste heat from agricultural or industrial sources and the energy savings from using little or no carbon-based heat (Castilla-Gavilán et al., 2024).
Additionally, it has been demonstrated that the usage of waste heat results in controlled production costs. Last but not least, a reduction of more than 26% in CO2 emissions and the addition of value to both solid and liquid effluents within a “zero waste” goal show a reduced environmental impact (Castilla-Gavilán et al., 2024). Anaerobic digesters and gasification systems are two examples of waste-to-energy technologies that are an effective strategy. Aquaculture on land may become even more circular and sustainable (Bergman et al., 2020) by utilizing anaerobic digestion to produce biogas from sludges in methanogenic reactors, thereby generating heat and energy (Mirzoyan et al., 2010). This approach could even be integrated into the system to maintain stable temperatures. Finally, installing infrastructure and equipment that use less energy and monitoring energy use can help save energy (He et al., 2018).
Organic aquaculture production has recently garnered much attention from investors and consumers, and it must be considered (Perdikaris and Paschos, 2010; Lagutkina and Ponomarev, 2018). Organic agriculture is a production strategy that prioritizes the health of soils, ecosystems, and people, as defined by the International Federation of Organic Agriculture Movements (IFOAM). Science, creativity, and tradition are all combined in organic farming to improve the environment, foster just relationships, and elevate living standards for all (Lušić and Tadić, 2008). This word can be used in aquaculture using the ideas of justice, care, ecology, and health (Angel et al., 2019). The requirements that must be fulfilled for aquaculture activities to be deemed organic within the European Union (EU) are outlined in the organic aquaculture criteria (The Regulation (European Commission; EC) No. 710/2009) (Sicuro, 2019). Regional variations may exist in certification procedures and regulatory structures (Castilla-Gavilán et al., 2024).
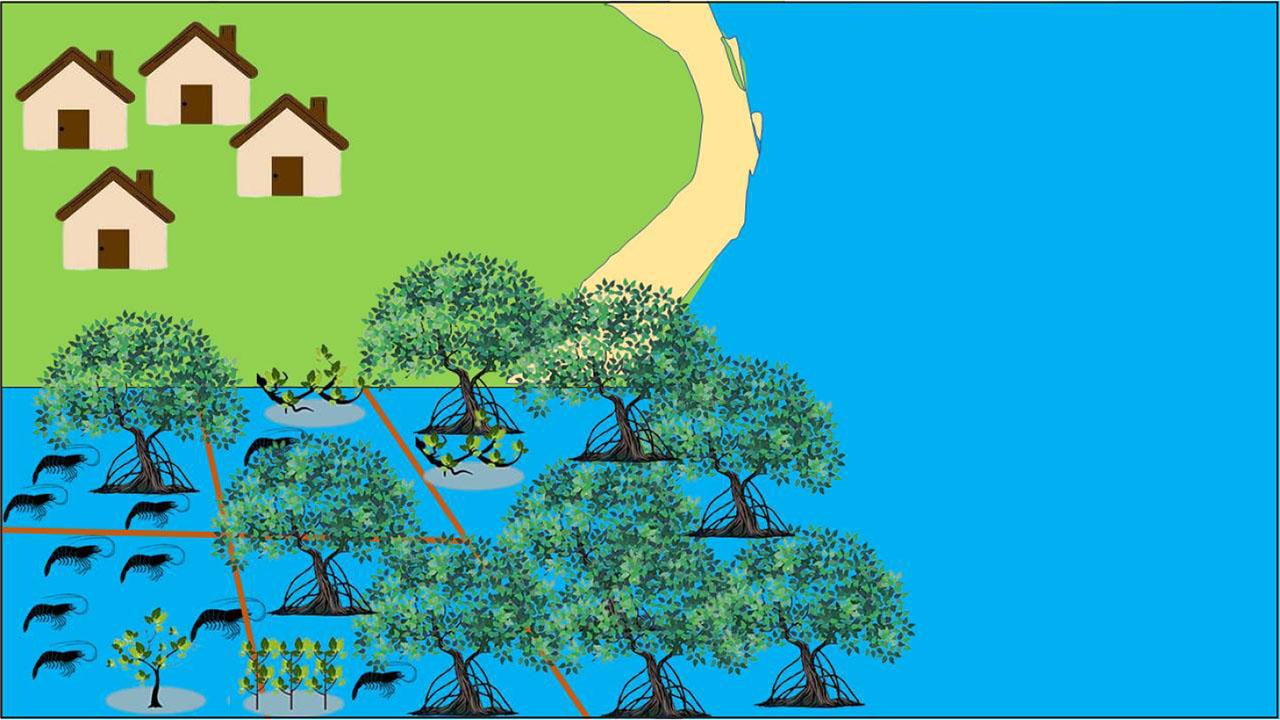
Integrated mangrove aquaculture system. Modified from Su et al. (2025)
Mangrove forests have suffered dramatically due to unplanned and uncontrolled shrimp cultivation. One of the primary causes of the recent acceleration of global mangrove degradation is coastal aquaculture, specifically shrimp farming (Primavera, 2006; Hamilton, 2013; Richards and Friess, 2016; Thomas et al., 2017). Due to the rapid expansion of shrimp farming, mangroves were severely damaged in Brazil, India, Malaysia, Mexico, Myanmar, Sri Lanka, the Philippines, Thailand, Vietnam, Bangladesh, China, and Indonesia, among other countries (Nations, 2007). To mitigate climate change, preserving mangrove forests and preventing their destruction can help lower the emission of blue carbon (Pendleton et al., 2012; Duarte et al., 2013; Murdiyarso et al., 2015).
About 53 million tonnes of blue carbon are sequestered annually worldwide, with mangroves accounting for 16 million tonnes (30%) of this total (Siikamäki et al., 2012). 10% (0.15 million hectares) of the world’s deforested mangrove land should be restored using integrated or organic shrimp culture, which might store 0.17 to 0.21 million tonnes of blue carbon yearly, as mangroves can sequester the blue carbon at a rate of 1.15 to 1.39 tonnes/hectare/year (t/ha/year) (Bouillon et al., 2008; Nellemann and Corcoran, 2009; Siikamäki et al., 2012). Likewise, if half of the world’s deforested mangroves (0.75 million ha) of habitat are restored through integrated or organic shrimp farming, blue carbon may be sequestered from 0.86 to 1.04 million tonnes per year. Therefore, growing shrimp and mangroves together to store blue carbon has the potential to mitigate global warming.
Worldwide, combined mangrove-shrimp culture (Figure 4) has garnered interest as a potential solution to the environmental challenges faced by shrimp aquaculture, including biotic depletion, eutrophication, salinization of groundwater and soil, and groundwater pollution (Primavera et al., 2000; Ha et al., 2012). Combined man-grove-shrimp production can help lower the emissions of blue carbon, even though the restoration of mangroves effectively sequesters blue carbon (Jiang et al., 2024). Integrated mangrove-shrimp production, also known as silvoaquaculture or silvofishery, has been recognized as an environmentally beneficial aquaculture technique (Primavera et al., 2000; Ha et al., 2012; Bosma et al., 2016). Establishing silvofishery for the preservation, restoration, and use of mangroves is one adaptation method developed in Southeast Asian countries to combat the destruction of mangroves caused by shrimp farming (Primavera et al., 2000). Small-scale farmers can adopt mangrove-friendly aquaculture to conserve mangroves (Primavera, 2006). Low-input sustainable aquaculture includes integrated mangrove-shrimp farming (Fitzgerald Jr, 2000). Mangrove-shrimp production systems fall into three main categories: (1) integrated: in Vietnam and Indonesia, canals of water connect mangroves and platforms; (2) related: in Vietnam, a sizable mangrove region is interspersed with broad water areas; and (3) separated: dykes in the South America and Philippines divide water from mangrove (Bosma et al., 2016). Integrated mangrove-shrimp culture often uses extensive and semi-intensive farming techniques. Farmers use tidal water exchange and hatchery supplies to stock prawns and fish fry from the wild; they rarely use pesticides or feeds and instead rely on natural shrimp recruitment (Johnston et al., 2000; Primavera et al., 2000; Bosma et al., 2016).
Agricultural practices such as the rice-wheat system maximize profitability, but simultaneously, they have increased natural resource demands and created a large amount of heterogeneous bio-waste (Fatima et al., 2023). It has been shown that crops such as paddy and wheat can produce a carbon footprint of 23.75 and 4.03 teragram carbon equivalent per hectare (Tg CE/ha), respectively (Sah and Devakumar, 2018). It is also estimated that livestock production contributes between 12 and 14.5% of anthropogenic GHG emissions, with meat and milk production responsible for 11–12% and 3–4%, respectively (Andrade et al., 2024). Environmentally friendly and integrated farming systems (IFS) provide efficient resource recycling and promote a circular economy that can potentially mitigate potential GHG emissions. IFS relies on the “take-make-waste” principle, making it a circular economy model (Fatima et al., 2023).
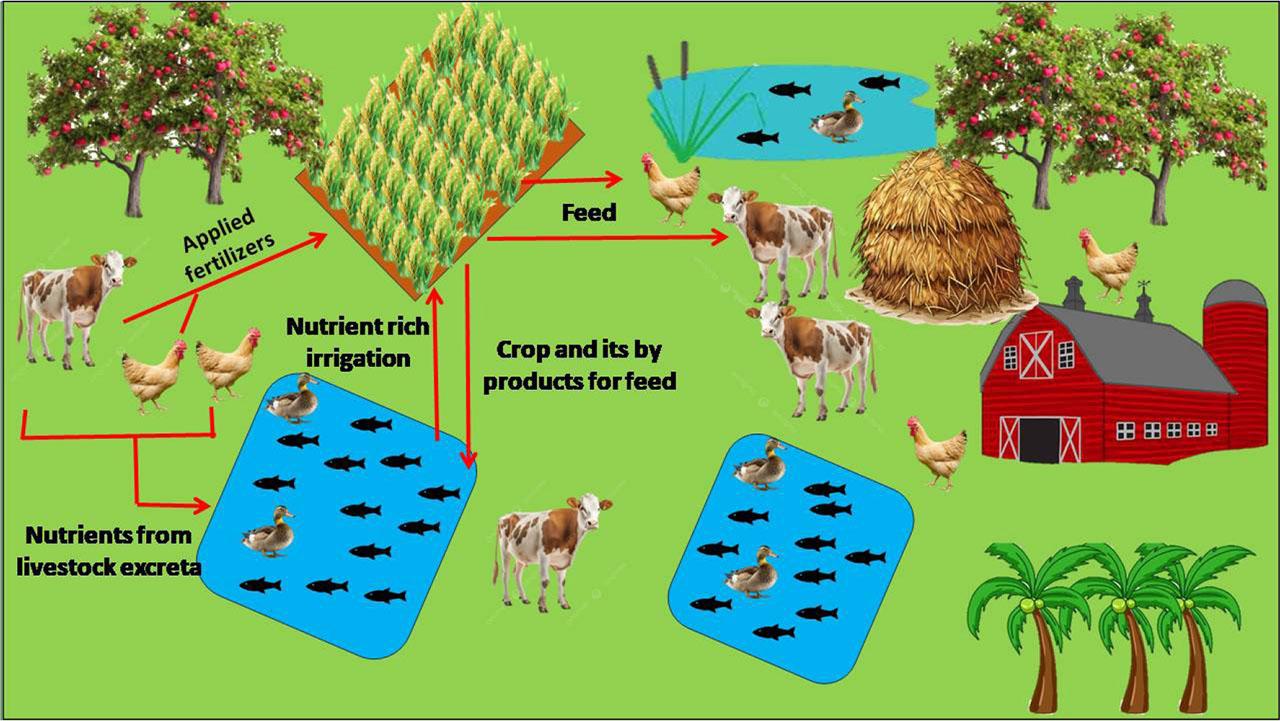
Integrated agri-aquaculture systems (IAAS) and integrated fish farming (IFF) are both sustainable farming models that combine aquaculture with agriculture (Lakra and Krishnani, 2022). IAAS is a broader system integrating aquaculture with crops, livestock, and agroforestry to enhance overall resource efficiency and farm productivity through synergistic interaction among components (Zajdband, 2011). In contrast, IFF is a subset of IAAS where fish farming is the central activity and other agricultural practices such as crop cultivation or livestock rearing are incorporated primarily to support and enhance fish production (Edwards, 2013). According to Little and Edwards (2003), integrated fish farming (IFF) is a “concurrent or sequential linkage in terms of utilization or recycling of wastes/byproducts from one farming component to others and vice versa of which fish remains major component” (Majumdar et al., 2018). IFF enables efficient resource utilization, waste recycling, energy conservation, diversification, additional income, diverse food options, and ecological balance. Under the control of farming families, the IFF is a compound interwoven soil, plant, animal, machinery, power, labour, capital, and another input matrix. Institutional, political, economic, and other farm-level issues have varying degrees of impact on the IFF. For the most effective use of resources, it symbolizes the integration of agricultural businesses like crops, livestock husbandry, fisheries, sericulture, forestry, duck farming and poultry (Figure 5) (Paramesh et al., 2022). Building resilience in crop production is best achieved through diversified farming systems that include crops and livestock (Sahoo et al., 2019; Babu et al., 2023). The only way to guarantee the food security of the world’s growing population when land degradation and climate change are twin problems is to develop climate-resistant agriculture through an integrated approach (Fatima et al., 2023). IFF offers a safe and sustainable manufacturing system through various businesses that reduce risk and increase climate change resilience (Behera and France, 2016). As a result, the different IFF models’ production potential and environmental sustainability were evaluated and presented in Table 3 regarding energy efficiency, greenhouse gas emissions, and eco-efficiency (Fatima et al., 2023), and it has been displayed that the integration of different farming systems potentially reduced the GHG emissions.
Integrated agri-aquaculture system (IAAS). Modified from Ibrahim et al. (2023)
GHG emissions intensity of various integrated farming systems (Fatima et al., 2023)
| Different integrated systems | GHG intensity (kg CO2e/kg food production) |
|---|---|
| Crop + dairy + fishery | 0.189±0.019 |
| Crop + dairy + fishery + poultry | 0.183±0.021 |
| Crop + dairy + fishery + poultry + duckery | 0.176±0.023 |
| Agriculture crops + dairy + fisheries + poultry + duck farming + apiaries | 0.172±0.024 |
| Agriculture crops + dairy + fisheries + poultry + duck farming + apiaries + boundary plantation | 0.170±0.025 |
| Agriculture crops + dairy + fisheries + poultry + duck farming + apiaries + boundary plantation + biogas unit | 0.169±0.025 |
| Agriculture crops + dairy + fisheries + poultry + duck farming + apiaries + vermicompost + biogas unit + boundary plantation | 0.164±0.027 |
In India, integrated fish-duck farming (IFDF) has long been practised (Sathoria and Roy, 2022). Ducks will eat snails, tadpoles, insects, and other benthic species found in fish ponds, and their excrement serves as fertilizer so that the fish and ducks benefit from one another when raised together (Sapcota and Begum, 2022). Additionally, ducks contribute to pond water aeration, increasing dissolved oxygen content. Additionally, when the duck searches for a meal, its faecal matters are evenly spread across the pond bottom, promoting plankton growth and the aerobic decomposition of pond bottom sediments, enabling reduced CH4 emissions (Carlson, 2023). Ducks are frequently referred to as “bioaerators” and “live manuring machines” for fish ponds (Gill, 2024). Kumar et al. (2023) evaluated the GHG emissions of the IFDF system, and it was estimated that 0.56 kgCO2e/t GHG was released per kg of fish. Electricity and fossil fuels accounted for the largest share of the current IFDF system’s GHG emissions (63%), which can be somewhat reduced by using solar energy. Solar energy may significantly contribute to the energy efficiency and environmental friendliness of the IFDF system by lowering the usage of energy that is not renewable inputs and GHG emissions, which are now recognized as critically important (Kumar et al., 2023).
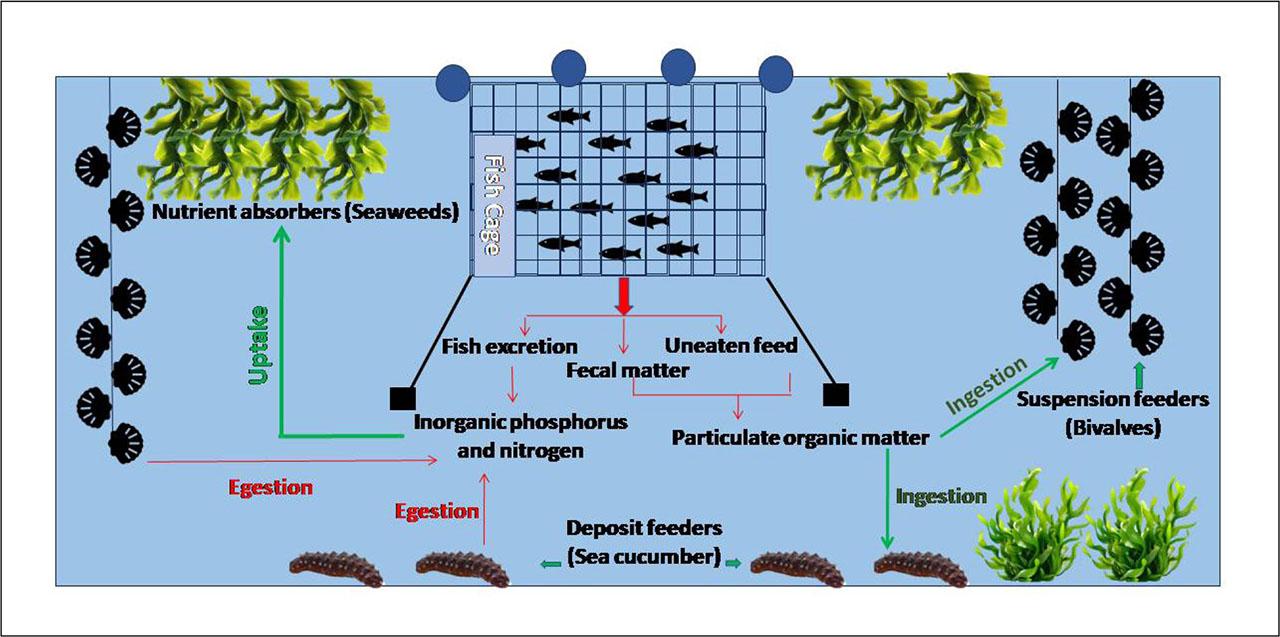
IMTA is a technology promoted because of its environmental effectiveness (Hossain et al., 2022), which addresses the two major concerns in aquaculture, which are organic matter and nutrients that have been dissolved from uneaten foods and faecal matter and the proper use of water (Emerenciano et al., 2025). Many species with different trophic levels are raised in similar or separate partitions interconnected by the flow of nutrients in the IMTA system (Figure 6) (Dunbar et al., 2020). Thus, following UN Sustainable Development Goal 12: resources will be converted into goods, end products will be transformed into waste, and the waste will become usable resources in a circular economy model, the extractive species which is at a lower trophic position or positions that can use these wastes (both inorganic and organic stuff) released from the primary species at a higher trophic position are valued (Castilla-Gavilán et al., 2024). There are many different types of IMTA, both based on land (which is based on RAS, large ponds, etc.) and offshore (based on longlines, net cages, floating rafts, etc.) (Buck et al., 2018). IMTA can mix low-value species like seaweeds and mussels with high-value species like salmon, oysters, and sea urchins (Khanjani et al., 2022 b). Economically speaking, it is significant that consumers generally accept IMTA items favourably, with many being willing to pay more for goods with the IMTA mark (Knowler et al., 2020). Among the many types of IMTAs, land-based IMTAs based on recirculation have been suggested to have the most significant capability for retaining nutrients (Nederlof et al., 2022). A marine IMTA with four species with finfish (feeding species) and marine algae, bivalve molluscs, and detritivores as the lower trophic position species would theoretically gain the increased efficiency of nutrient retention (Castilla-Gavilán et al., 2024). Between 79% and 94% of the carbon, phosphate, and nitrogen that the aquafeed contains would be absorbed by this system. Pacific fish farms that produce seaweed (Gracillaria sp.), common orient clam (Meretrix lusoria), giant tiger prawn (Penaeus monodon), and C. chanos have extensively used this method (Chang et al., 2019).
In IMTA, carbon sequestration is feasible, mainly through producing seaweed and shellfish (Song et al., 2024). The potential for macroalgae farming to aid in worldwide, blue carbon capture has been highlighted because of its capability to photosynthesize CO2 absorption (Chung et al., 2011; Hill et al., 2015) and has been suggested as a way to mitigate climate change (Castilla-Gavilán et al., 2024). Cunha et al. (2019) found that oysters increased carbon sequestration in land-based IMTA (fish + phytoplankton + seaweeds) by 0.50 to 0.53 mg/L. Additionally, Liu et al. (2022) noted that large-scale macroalgae and shellfish IMTA contribute significantly to the local carbon cycle and serve as CO2 sinks. For example, when abalone was grown in IMTA, Nobre et al. (2010) found that GHG emissions decreased (Table 4).
Greenhouse gas emissions from sustainable aquaculture systems
| Type of aquaculture system | GHG emission | Reference | |
|---|---|---|---|
| Integrated multi-trophic aquaculture (IMTA) | Abalone farming | Decreased by 290 to 350 tCO2e/year | Nobre et al. (2010) |
| Biofloc system | Shrimp farming | 5945 kgCO2e/tonne | Huang et al. (2024) |
| Aquaponics system | Pilot scale system | Fish tank – 52.8 to 131.3 kg CO2e; clarifier – 9.8 to 16.2 kg CO2e; plant growth system – 0.3 to 1.0 kg CO2e. | Kalvakaalva et al. (2022) |
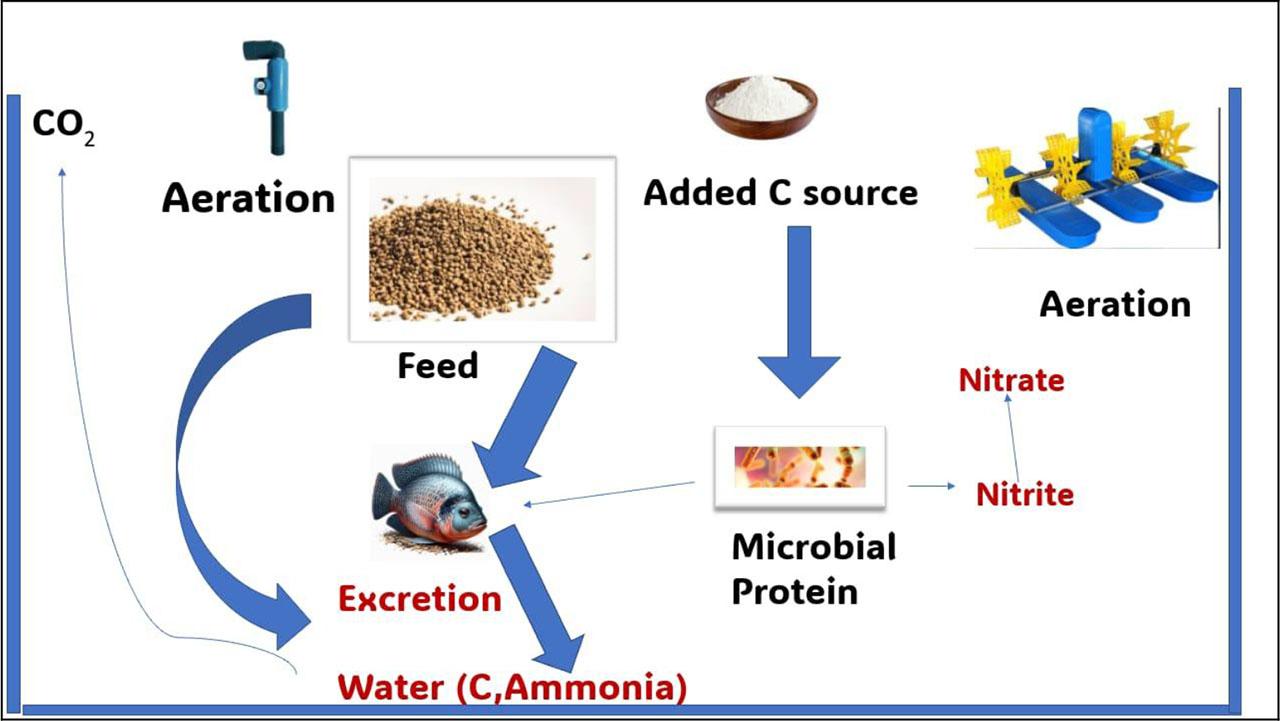
Developing bioflocs in a culture medium is the foundation of BFT systems (Figure 7) (Khanjani et al., 2024 a). These are microscopic ecosystems where bacteria, microalgae, diatoms, and protozoa congregate with leftover food, surplus inorganic nutrients, and waste. The microbes secrete a matrix of extracellular polymeric molecules that facilitate this aggregation (Garibay-Valdez et al., 2023). By keeping an increased ratio of carbon/nitrogen (C/N) (Hargreaves, 2013), chemoautotrophic bacterial colonies present within the biofloc absorb ammonium (NH4) released from the cultivated animals at the time of the process of nitrification and convert that to nitrate (NO3) by adding the sources of carbon (glycerol, molasses, wheat flour) to the culture medium (Zhao et al., 2016; Khanjani et al., 2025). Heterotrophic bacteria can also incorporate ammonium into their biomass immediately away. Also, microalgae help to absorb nitrogen during photosynthesis (Ebeling et al., 2006). BFT contributes to the preservation of culture media quality by transforming ammonium, which is detrimental to farmed animals, into nitrate (NO3), which does not threaten the well-being of the stocked animals (Emerenciano et al., 2021).
Integrated multi-trophic aquaculture (IMTA) system. Source: Author
Biofloc technology. Modified from Castilla-Gavilán et al. (2024)
Additionally, because microbial protein is synthesized from nitrogenous organic wastes, biofloc can supply high-quality protein that can be utilized as an additional food source for farmed animals (Burford et al., 2004; Khanjani et al., 2024 b). Due to several economic and environmental advantages, BFT is widely used, particularly in intensive shrimp farming systems (Zimmermann et al., 2023). Despite shrimp’s increased commercial value, it has to be noted that the filamentous cyanobacteria, actinomycetes, and high turbidity can induce off flavours in the BFT system (Khanjani et al., 2022 a). These factors may degrade the quality and market value of the shrimp produced by BFT (Mugwanya et al., 2021). To mitigate this issue, several approaches have been put up, such as incorporating specific microbes, like those belonging to the Bacillaceae family, into the designs of BFT systems as bioreactors (Lauderdale et al., 2004; Guttman and Van Rijn, 2012).
BFT encourages low-protein diets while lowering the expenses and environmental effects of producing feeds high in protein (Faizullah et al., 2019). BFT also encourages polyculture and the production of low-trophic-level species like IMTA (Castilla-Gavilán et al., 2024). Higher efficiency than monospecific BFT has been demonstrated by a wide range of integrated BFT systems, including shrimp (P. vannamei) in BFT with Nile tilapia (O. niloticus) (Holanda et al., 2023), liza mullet (Mugil liza) (fin-fish) and seaweeds (Ulva fasciata) (Legarda et al., 2021), Ulva lactuca (Carvalho et al., 2023), O. niloticus and the halophyte Sarcocornia ambigua (Poli et al., 2019). It has been proved that the sequestration of blue carbon can happen in biofloc ponds because the phytoplankton in BFT can utilize carbon through the photosynthesis process and act as the sinks of carbon (Ogello et al., 2021; Manan et al., 2024). This phenomenon, together with the drop in the feed conversion ratio (FCR) noted in BFT, has led to the idea that these technologies could be used as a way to lower the greenhouse gas releases related to farming shrimp, even when a source of carbon is included in the ponds (Hu et al., 2013; Soares and Henry-Silva, 2019; Huang et al., 2024). According to Huang et al. (2024), the greenhouse gas release in a BFT system of shrimp was estimated to be 25% of the GHG emissions from the super-intensive farming system (Table 4) in which utilization of commercial feed alone accounted for 31–47% of the total emissions and also the infrastructure emissions increased the emissions, the manufacture of biofloc technology accounted for 60% of the super-intensive output where energy utilization is the major factor responsible for emission which was followed by feed and infrastructure.
According to Gao et al. (2018) and Krause-Jensen et al. (2018), seaweeds provide refuge, foraging, and nidification environments for marine life, as well as food, medicine, and biofuels for humans; they are crucial to the health of coastal ecosystems. Seaweed aquaculture is growing internationally due to the increased demand (Ferdouse et al., 2018). The potential of seaweed farming to mitigate climate change and sequester carbon for extended periods in the sea has been investigated (Chung et al., 2011; Duarte et al., 2017; Chen and Xu, 2020). China’s seaweed production from 2015 to 2019 showed that harvested seaweed extracted 6,05,830 tonnes (t) of carbon (C), 70,615 t of nitrogen (N), and 8,515 t of phosphorus (P) from marine waters yearly, while seaweed sequestered 3,44,128 t of C and produced 25,33,221 t of oxygen (O2) (Gao et al., 2021). With the high capabilities for both C removal (9.58 t/ha/yr) and sequestration (5.44 t/ha/yr) among seven farmed seaweeds, Gracilariopsis lemaneiformis has the less farming space needed to sequester the 2.5 Giga tonnes of CO2 that is required yearly to meet the carbon neutrality of China target by 2060 (Gao et al., 2021; Chen et al., 2022). Seawater deoxygenation could be efficiently countered by the oxygen produced by seaweed cultivation, which, excluding gas exchange, could increase the dissolved oxygen (DO) in marine waters at depths of 0–3 m by 21% per day (Pereira and Pardal, 2024). Saccharina japonica has the best capacity to remove P, while G. lemaneiformis has the most capacity to remove N (Mao et al., 2009). It would need two or three times larger to absorb the N and P emitted from the mariculture (assuming productivity remains constant). According to this study, cultivating seaweed may be crucial to achieving carbon neutrality and mitigating eutrophication and deoxygenation in saltwater. Increased sales of the seaweed’s harvested portions for food and biofuel could somewhat offset the expense of cultivation (Gao et al., 2021).
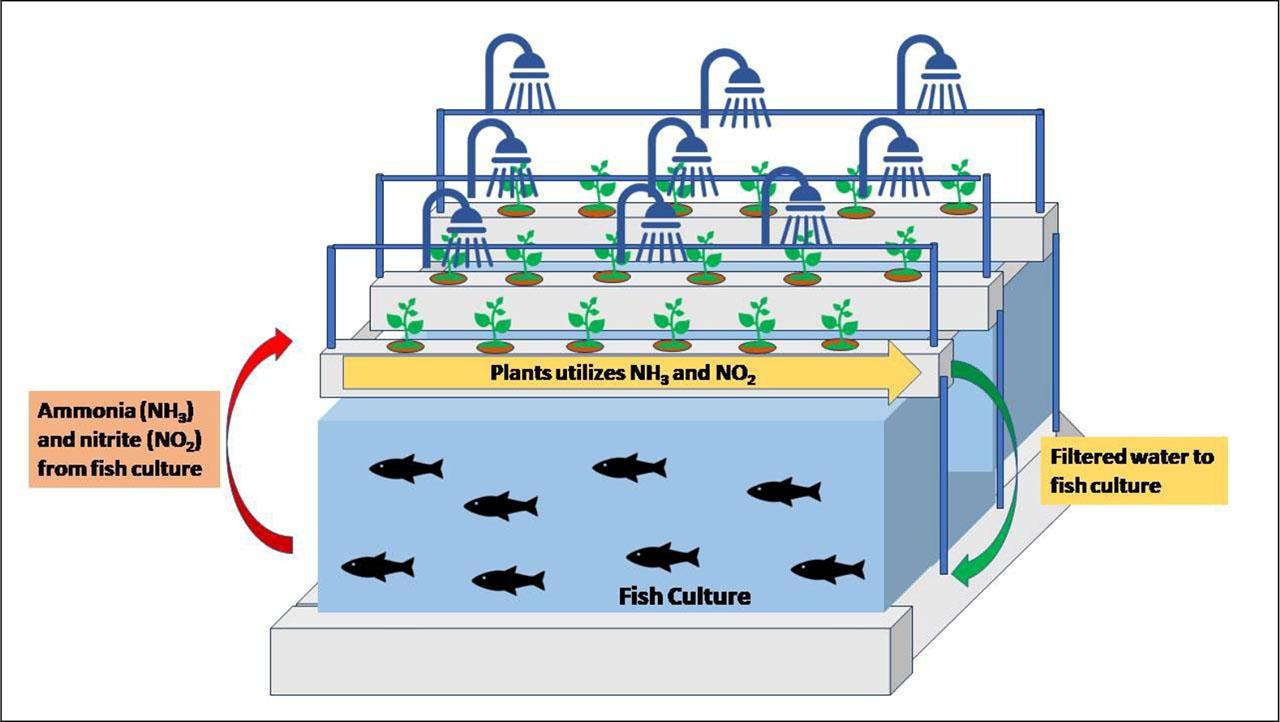
Research on developing innovative production methods, such as aquaponics, which is typically described as less susceptible to climate change, has been conducted in recent years (Vasdravanidis et al., 2022). Freshwater fish farming and plant co-cultivation are combined in aquaponic systems to provide a sustainable recycling system and reduce GHG emissions (Table 4; Figure 8) (Farrant et al., 2021; David et al., 2022). In particular, adopting and advancing such creative and sustainable methods are essential for producing aquaculture goods with less adverse environmental effects and preventing environmental variations that could endanger the fish and lower their productivity (Little et al., 2018). Currently, research on aquaponics is primarily focused on studies with smaller populations of individual stocks, concentrating on plant traits or abiotic and economic factors (Schoor et al., 2023). As a result, it is impossible to determine with certainty whether fish grown in aquaponics will be able to survive the impacts of a changing climate. However, it is anticipated that the effects of changing climate will have a considerable or minor influence on several fish species in the future (Ficke et al., 2007). The Salmonidae family of freshwater fish, including O. mykiss and S. salar, are the species most impacted (Abisha et al., 2022). However, fish belonging to the Cichlidae family, including carps, catfish, and tilapia (Oreochromis spp.), are more resilient to climate change (Abisha et al., 2022).
It is suggested that an aquaponic system feed with a high carbon footprint can be replaced with alternative feeds to maintain a fully sustainable economy (Ogello et al., 2024). These feeds could be extracted from specific plant species or insects. Bordignon et al. (2022) discovered that the affordability and appeal of products of aquaponics can be increased by rearing fish with high commercial value in an aquaponics system and substituting insect meal (Hermetia illucens) for their diet if the value of insect meals is lowered. Furthermore, adding plant extracts from Achillea millefolium and Acorus calamus to a rainbow trout’s diet enhances its growth by improving its physiological state and feed conversion ratio (FCR) without compromising the quality of the fish’s flesh or the aquaponic system’s productivity through water recirculation (Sirakov et al., 2019; Velichkova et al., 2020).
The factors that affect traditional carbon capture and storage technologies include high energy consumption, transportation difficulties, inefficient capture utilization, and potential atmospheric leakage during storage (Onyeaka et al., 2021). However, microalgae, a feedstock of third-generation bioenergy, have a high carbon dioxide fixation efficiency, solving the previously mentioned issues (Jacob et al., 2021). Compared to traditional carbon capture and storage systems, the approach lowers capital and operating costs, promoting economies of scale. As a result, the method is environmentally beneficial because the conversion process takes place at room temperature and pressure. Through photosynthesis, this microalgae method offers a possible means of recycling CO2 into feedstock biomass (Jaiswal et al., 2023). Bioenergy, including biogas produced through gasification, fermentation, anaerobic digestion, and hydrothermal liquefaction, bio-oil, and other products such as biochar and syngas are subsequently produced from this biomass feed-stock (Choi et al., 2019). Furthermore, Valdovinos-García et al. (2020) noted that microalgae are an attractive method for carbon capture due to their greater capacity compared to terrestrial plants. Additionally, the present combined bio-refinery architecture would encourage the expansion of a biological capture of carbon technique based on microalgae to improve biomass feedstock availability.
The most promising species for extracting CO2 from combustion gases is believed to be Chlorella. Interestingly, it has been demonstrated that Chlorella species may flourish in conditions with 40% (v/v) carbon dioxide (Brennan and Owende, 2010), and their CO2 fixation ranges from 0.77 to 2.22 gram/litre/day (g/L/day) (Cheah et al., 2015). The formation of microalgae biomass is unaffected by nitrogen dioxide and sulphur dioxide, typically found in the CO2 stream (Pires et al., 2011; Cheah et al., 2015). According to research by Kao et al. (2014) and Duarte et al. (2016), Chlorella species is one bioremediation technique for CO2 emissions from power plant operation.
The temperature, pond chemistry, and algal physiology affect how well microalgae bio-capture CO2. According to research by Keffer and Kleinheinz (2002), under typical circumstances, CO2 collection efficiency can reach 80% to 99%, with gas residence times of less than two seconds. One of the most important factors that can eventually aid in decarbonization and, thus, mitigate global warming is biological CO2 capture from point sources using rapidly growing microalgae (Tiwari et al., 2024).
Sources of energy that release CO2 are included in a carbon tax, a type of carbon pricing and a pollution tax (Metcalf and Weisbach, 2009). By reducing the harmful amount of CO2 emissions, a carbon tax seeks to retard climate change and its adverse impacts on humanity and the environment. A carbon tax also boosts production and advances many efficient production services or methods (Elkins and Baker, 2001). In general, it is estimated by the carbon tax rate applied to energy sources that release CO2. It is a type of carbon pricing and environmental tax. To retard the change in climate and its impacts on the health of humans and the ecosystem, a carbon tax aims to lower dangerous and unfavourable levels of CO2 emissions (Avi-Yonah and Uhlmann, 2009).
Aquaponics system. Modified from Verma et al. (2023)
Under cap-and-trade systems, carbon pricing also takes the form of carbon trading. One strategy for controlling and eventually lowering carbon emissions is cap and trade (Wang et al., 2018 b). The government restricts the amount of CO2 businesses emit after setting a national cap on carbon emissions. Any excess permits in the emission market can be sold by a business that can lower carbon emissions more effectively to businesses that find it difficult to cut carbon emissions (Baldwin, 2008). Markets for carbon trading are so established. Globally, the number of carbon trading schemes is growing. Additionally, the EU emissions trading system (EU ETS) and national systems are currently in existence or are being created in the United States, China, Japan, New Zealand, Canada, South Korea, and Switzerland (Tsai, 2020).
Reducing CO2 or other GHG emissions to offset or make up for emissions from different sources is known as a carbon offset (Coulter et al., 2007). Reducing one tonne of CO2 or its equivalent in other greenhouse gases (GHGs) is represented as one tonne of carbon offset (Broekhoff et al., 2019). For carbon offsets, there are two markets: (1) the large market, where governments, companies, or organizations procure them to meet release caps, and (2) the voluntary smaller market, where governments, companies, or individuals procure them to lower their own GHG emissions from sources like usage of electricity and transport (Lovell, 2010). Carbon offsets are usually utilized to assist projects that lower GHG emissions over the short or long term (Aldy and Halem, 2024). Hydropower dams, wind farms, and bio-mass energy are examples of renewable energy projects that are frequently implemented. REDD (reducing emissions from deforestation and forest degradation), landfill methane destruction, energy efficiency programs, the destruction of industrial pollutants or agricultural byproducts, LULUCF (land use, land-use change, and forestry), and so on are some more (Tsai, 2020).
In conclusion, aquaculture’s growth has made it a vital contributor to global economic growth and food security; however, it also poses serious environmental problems, particularly regarding GHG emissions from energy use, feed production and waste management. Implementing measures for carbon reduction across aquaculture practices, such as improving feed components, developing waste management systems, and embracing sustainable energy solutions, is crucial to meeting global climate targets. Integrated methods, including polyculture, IAAS, and IMTA, present viable strategies to reduce emissions while boosting system productivity and resilience. Furthermore, developments in carbon markets, seaweed farming, and sustainable feed techniques provide practical ways to mitigate and balance the environmental impact of the aquaculture industry. These environmental issues must be addressed for the aquaculture sector to grow sustainably and fulfil future demands in an environmentally responsible way.