
Table 1.
Dietary formulation and proximate composition (% on dry matter basis) of the experimental diets containing different levels of chlorogenic acid (CGA)
| Ingredients (%) | T0 (0.0) | T1 (0.4) | T2 (0.6) |
|---|---|---|---|
| Kilka fish meal (60.6% protein) | 48 | 48 | 48 |
| Soybean meal (44.2% protein) | 23 | 23 | 23 |
| Wheat flour | 7 | 7 | 7 |
| Corn flour | 10 | 10 | 10 |
| Fish oil | 4 | 4 | 4 |
| Soy lecithin | 1 | 1 | 1 |
| Cellulosea | 3 | 2.6 | 2.4 |
| CGA | 0 | 0.4 | 0.6 |
| Vitamin premixb | 2 | 2 | 2 |
| Mineral premixc | 2 | 2 | 2 |
| Total | 100 | 100 | 100 |
| Chemical composition | |||
| dry matter (%) | 89.71 | 90.11 | 89.54 |
| crude protein (%) | 40.61 | 40.31 | 40.56 |
| crude lipid (%) | 16.77 | 16.56 | 16.73 |
| ash (%) | 7.78 | 7.82 | 7.73 |
| nitrogen-free extract (%)d | 34.84 | 35.31 | 34.98 |
| gross energy (Kcal/100 g)e | 531.959 | 530.202 | 531.872 |
b Vitamins mixtures (IU or mg kg−1 diet): DL-alpha tocopherol acetate, 60 IU; DL-cholecalciferol, 3000 IU; thiamin, 15 mg; riboflavin, 30 mg; pyridoxine, 15 mg; B12, 0.05 mg; nicotinic acid, 175 mg; folic acid, 5 mg; ascorbic acid, 500 mg; inositol, 1000 mg; biotin, 2.5 mg; calcium pantothenate, 50 mg; choline chloride, 2000 mg.
c Minerals mixture (g or mg kg−1 diet): calcium carbonate (40% Ca), 2.15 g; magnesium oxide (60% Mg), 1.24 g; ferric citrate, 0.2 g; potassium iodide (75% I), 0.4 mg; zinc sulfate (36% Zn), 0.4 g; copper sulfate (25% Cu), 0.3 g; manganese sulfate (33% Mn), 0.3 g; dibasic calcium phosphate (20% Ca, 18% p), 5 g; cobalt sulfate, 2 mg; sodium selenite (30% Se), 3 mg; KCl, 0.9 g; NaCl, 0.4 g.
Table 2.
Growth performance of stellate sturgeon (Acipenser stellatus) fed with different levels of chlorogenic acid (CGA) for 45 days
| Initial weight (g) | Final weight (g) | Weight gain (g) | SGR (%/day) | FI (g feed/fish) | FCR | Survival rate (%) | |
|---|---|---|---|---|---|---|---|
| T0 | 603.47±14.52 | 769.52±15.46 b | 166.05±14.25 b | 0.44±0.04 b | 86.6±5.7 | 5.29±0.49 a | 100 |
| T1 | 601.61±15.27 | 825.01±16.03 ab | 223.40±18.46 ab | 0.56±0.05 ab | 91.17±1.22 | 4.09±0.36 ab | 100 |
| T2 | 597.86±14.25 | 863.93±12.82 a | 266.08±13.66 a | 0.66±0.04 a | 91.10±1.26 | 3.40±0.17 b | 100 |
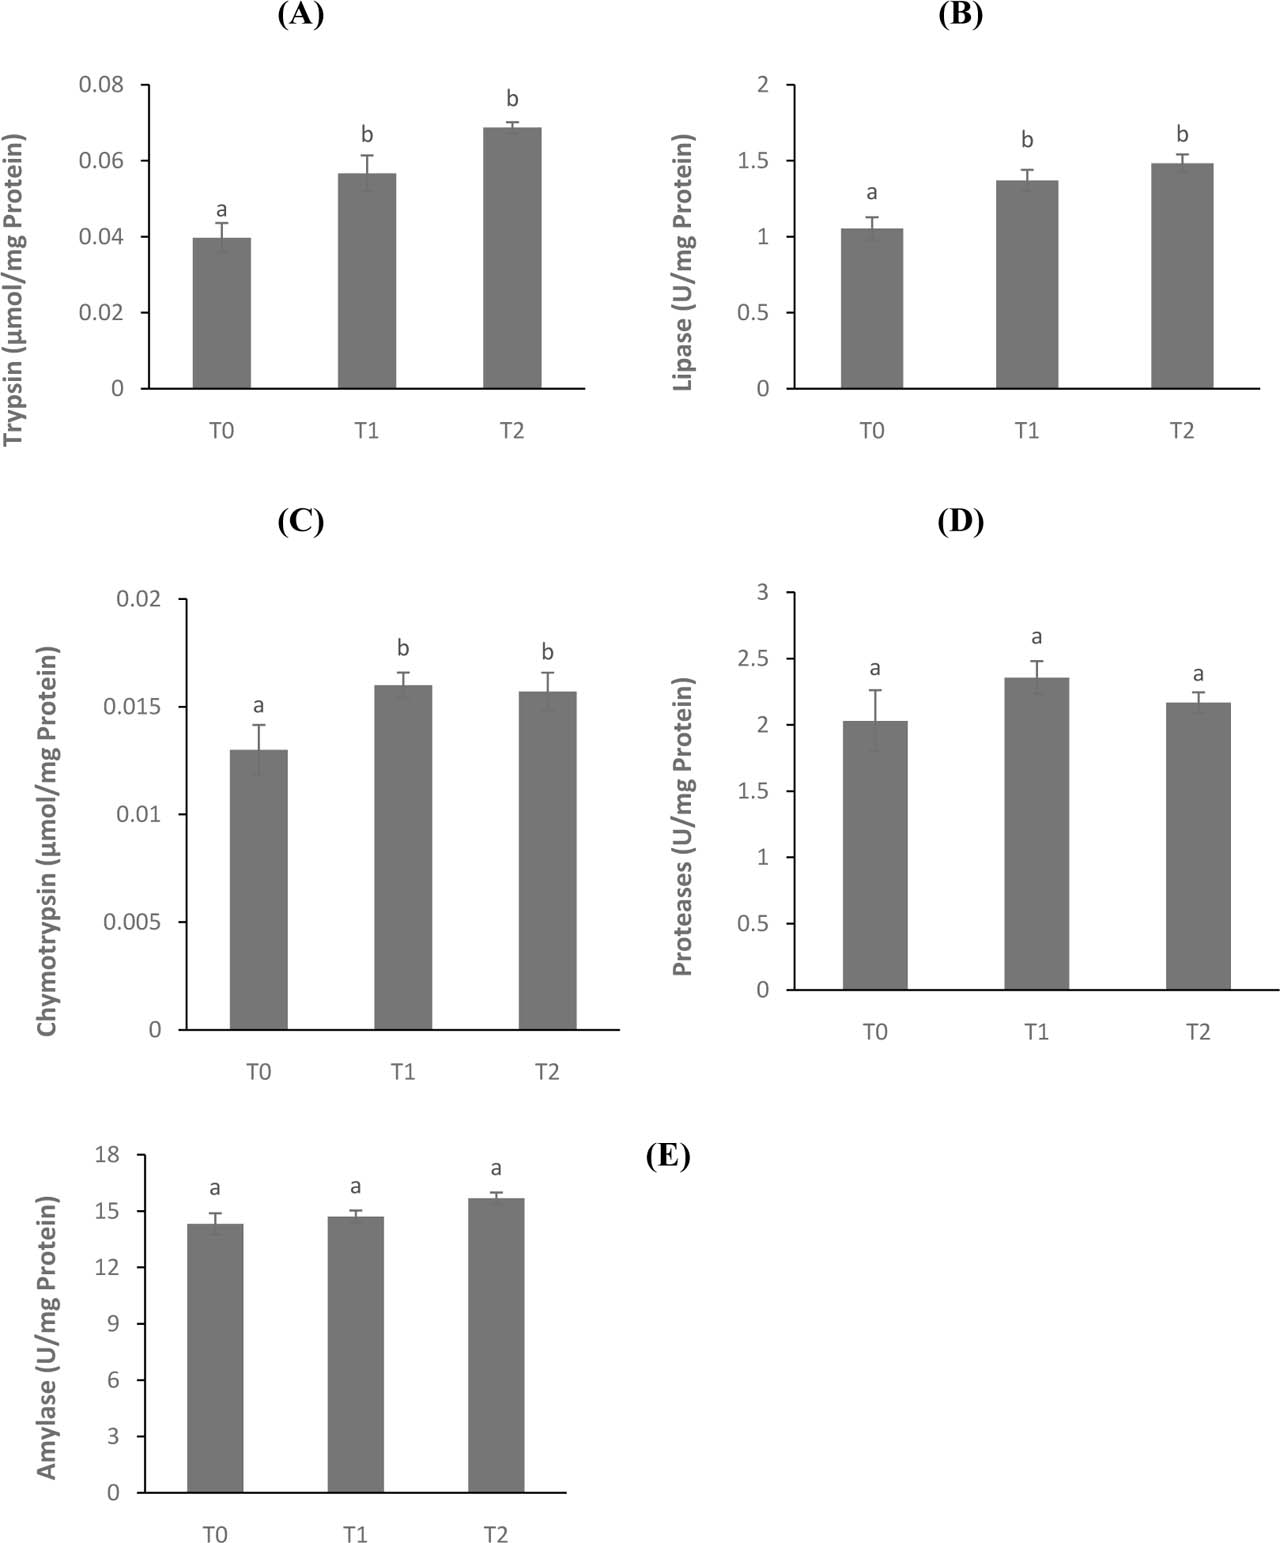
Figure 1.
Trypsin (A), lipase (B), chymotrypsin (C), proteases activity (D), and alpha-amylase activity (E) of stellate sturgeon (Acipenser stellatus) fed with 0 (T0), 400 (T1), and 600 (T2) mg CGA/kg feed for 45 days. Different letters designate significant differences as determined by Tukey’s post-hoc tests (mean ± SE)
Table 3.
Hematological parameters of stellate sturgeon (Acipenser stellatus) fed with different levels of chlorogenic acid (CGA) for 45 days
| T0 | T1 | T2 | |
|---|---|---|---|
| Hematocrit (%) | 25.67±1.76 a | 27.00±1.53 a | 26.33±1.33 a |
| Hemoglobin (g/dL) | 3.17±0.27 a | 3.33±0.26 a | 3.33±0.19 a |
| RBCs (×106 cells/μL) | 0.95±0.03 a | 0.97±0.03 a | 0.97±0.06 a |
| WBCs (×103 cells/μL) | 4700.00±208.17 a | 5600.00±173.21 b | 5866.67±218.58 b |
| Lymphocytes (%) | 77.67±1.45 a | 86.67±2.19 b | 84.67±1.67 ab |
| Neutrophils (%) | 14.33±0.67 a | 9.00±2.08 a | 10.33±1.76 a |
| Monocytes (%) | 2.00±0.58 a | 1.33±0.33 a | 1.67±0.88 a |
| Eosinophils (%) | 6.00±1.00 a | 3.00±0.58 a | 3.33±1.33 a |
| MCV (fL) | 268.63±11.11 a | 278.93±24.69 a | 274.97±25.17 a |
| MCH (pg) | 33.07±2.03 a | 34.37±2.27 a | 34.40±0.25 a |
| MCHC (g/dL) | 12.30±0.26 a | 12.53±1.43 a | 12.70±1.15 a |
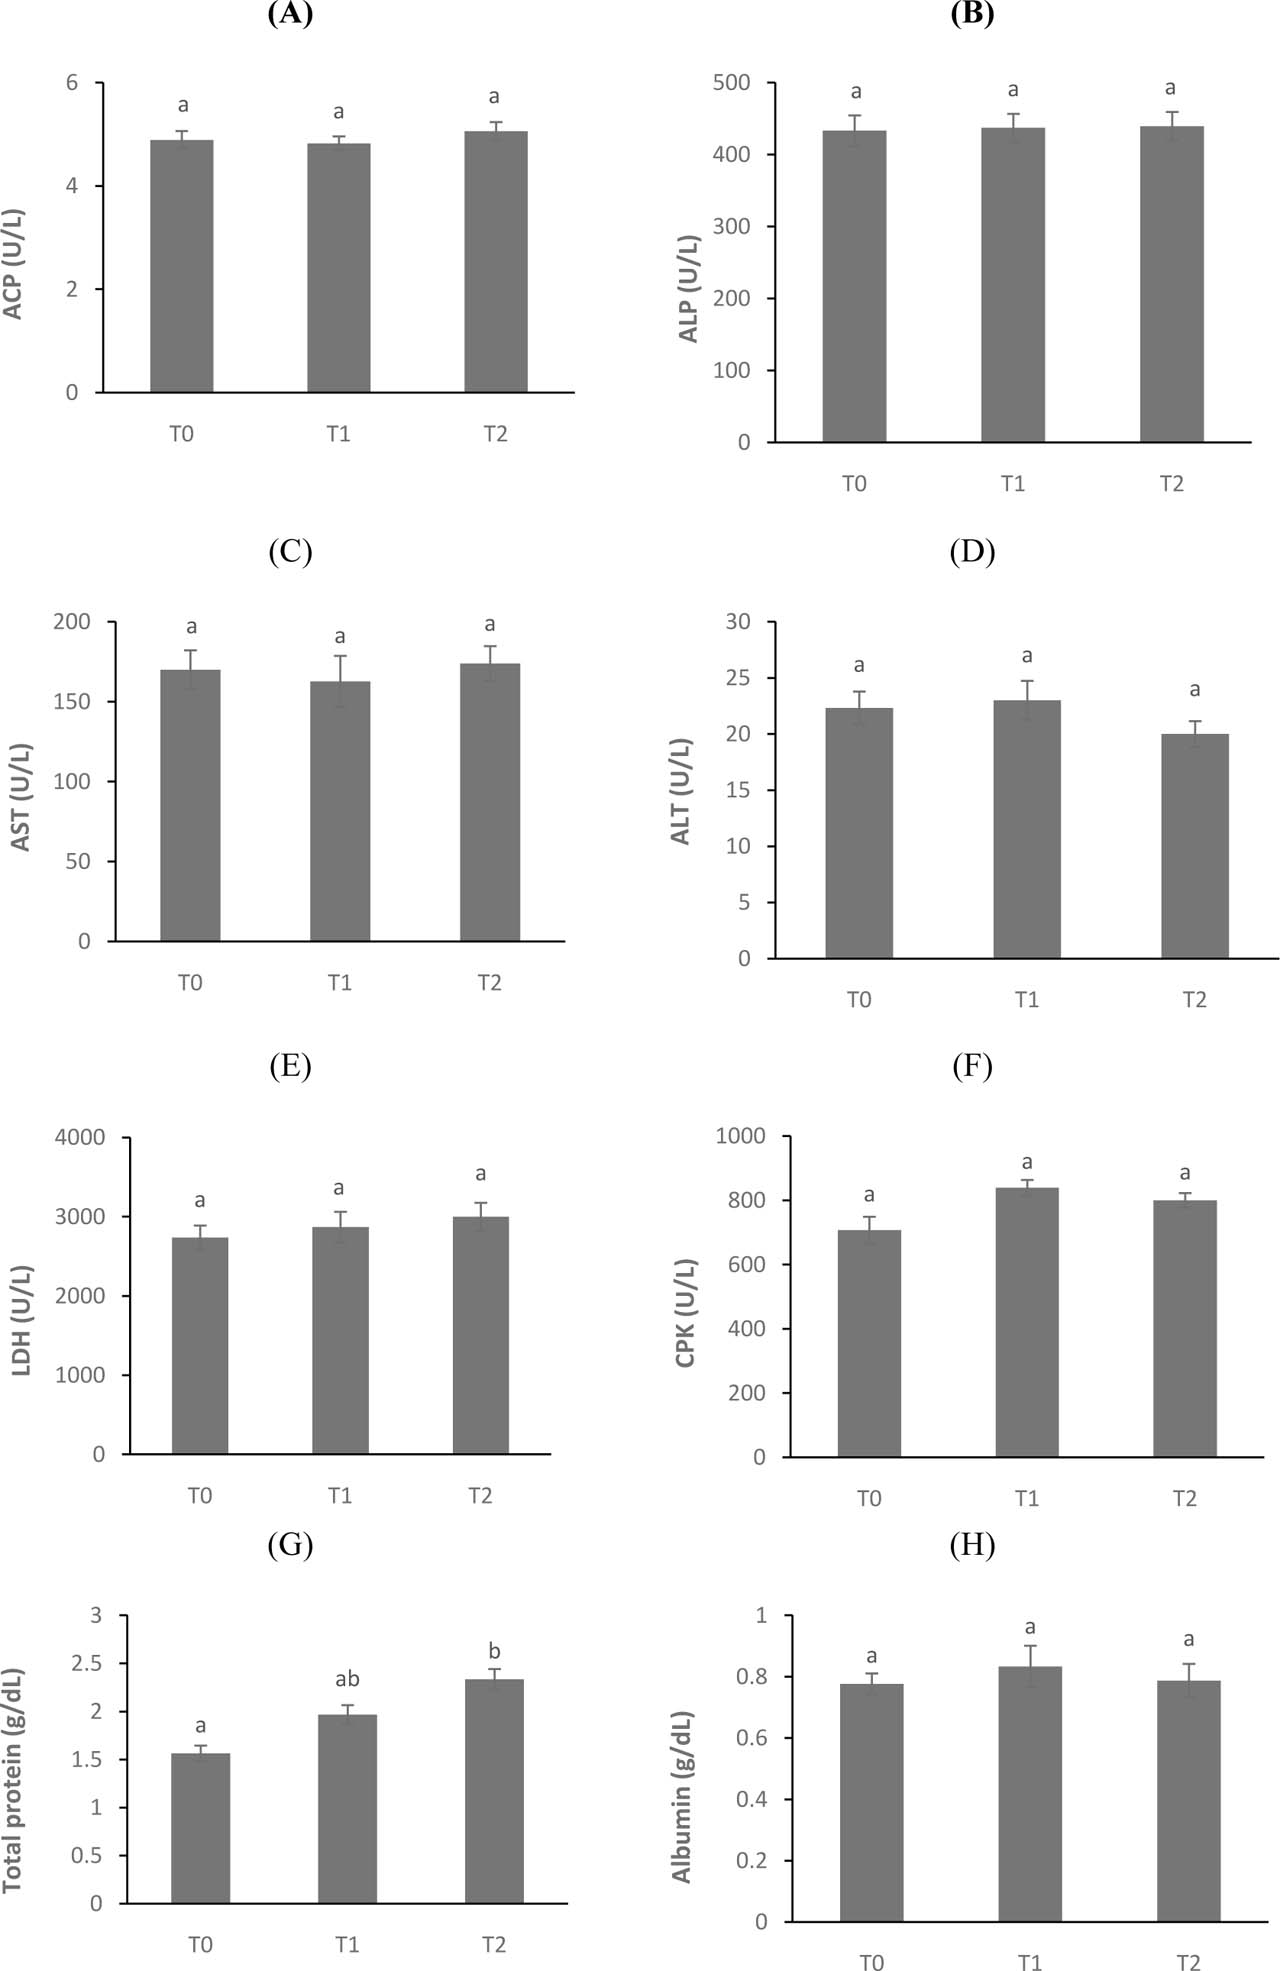
Figure 2.
Acid phosphatase (ACP, A), alkaline phosphatase (ALP, B), aspartate aminotransferase (AST, C), alanine aminotransferase (ALT, D), lactate dehydrogenase (LDH, E), creatine phosphokinase (CPK; F), total protein (G), and albumin (H) of stellate sturgeon (Acipenser stellatus) fed with 0 (T0), 400 (T1), and 600 (T2) mg CGA/kg feed for 45 days. Different letters designate significant differences as determined by Tukey’s post-hoc tests (mean ± SE)
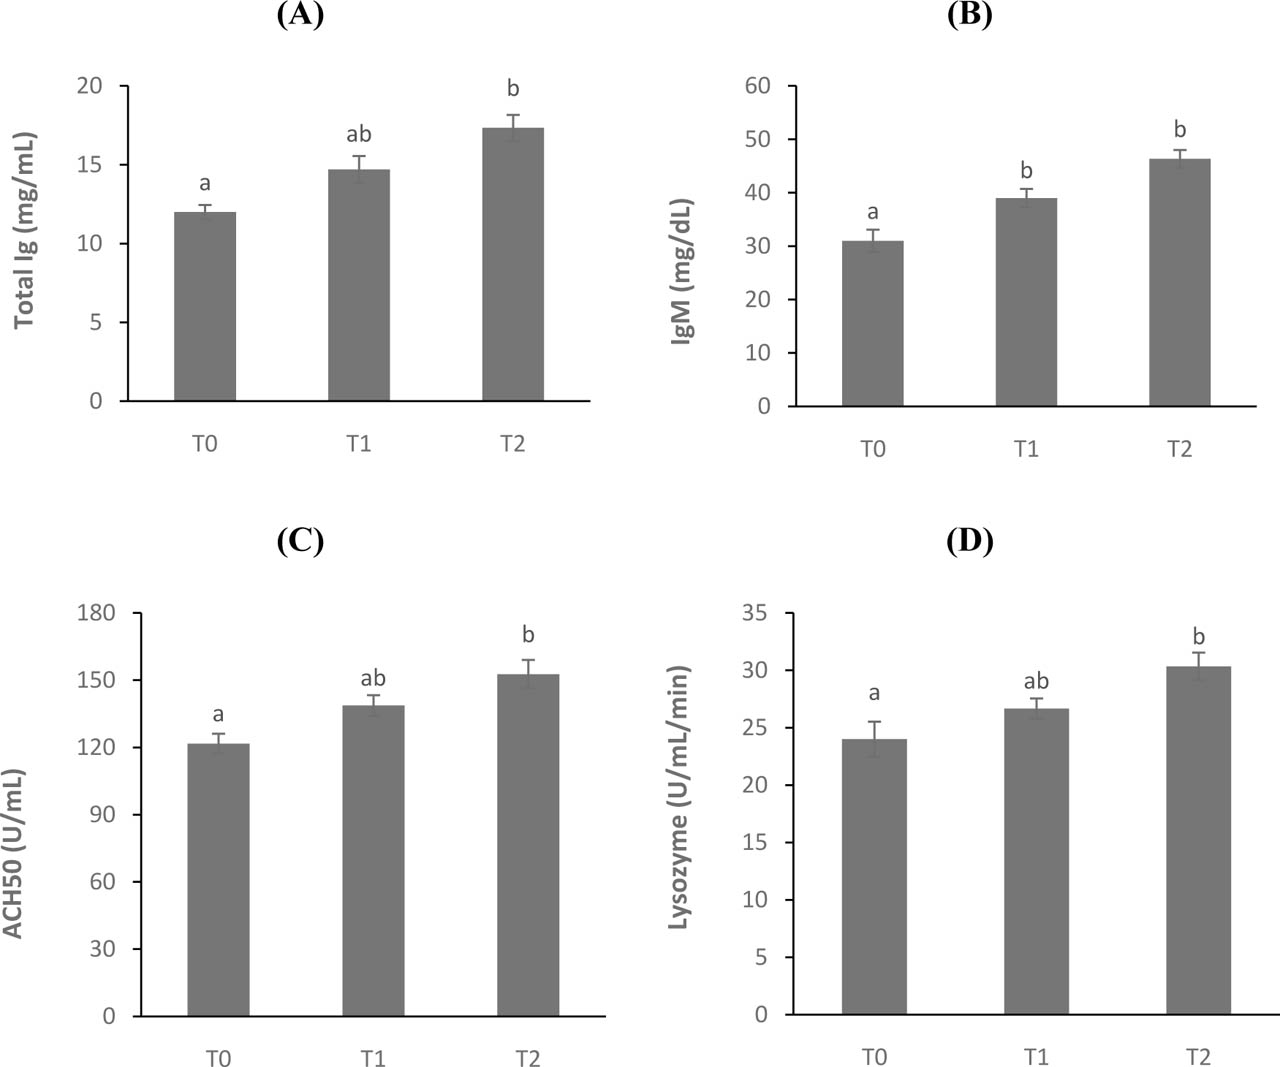
Figure 3.
Total immunoglobulin (total Ig; A), IgM (B), ACH50 (C), and lysozyme activity (D) of stellate sturgeon (Acipenser stellatus) fed with 0 (T0), 400 (T1), and 600 (T2) mg CGA/kg feed for 45 days. Different letters designate significant differences as determined by Tukey’s post-hoc tests (Mean ± SE)
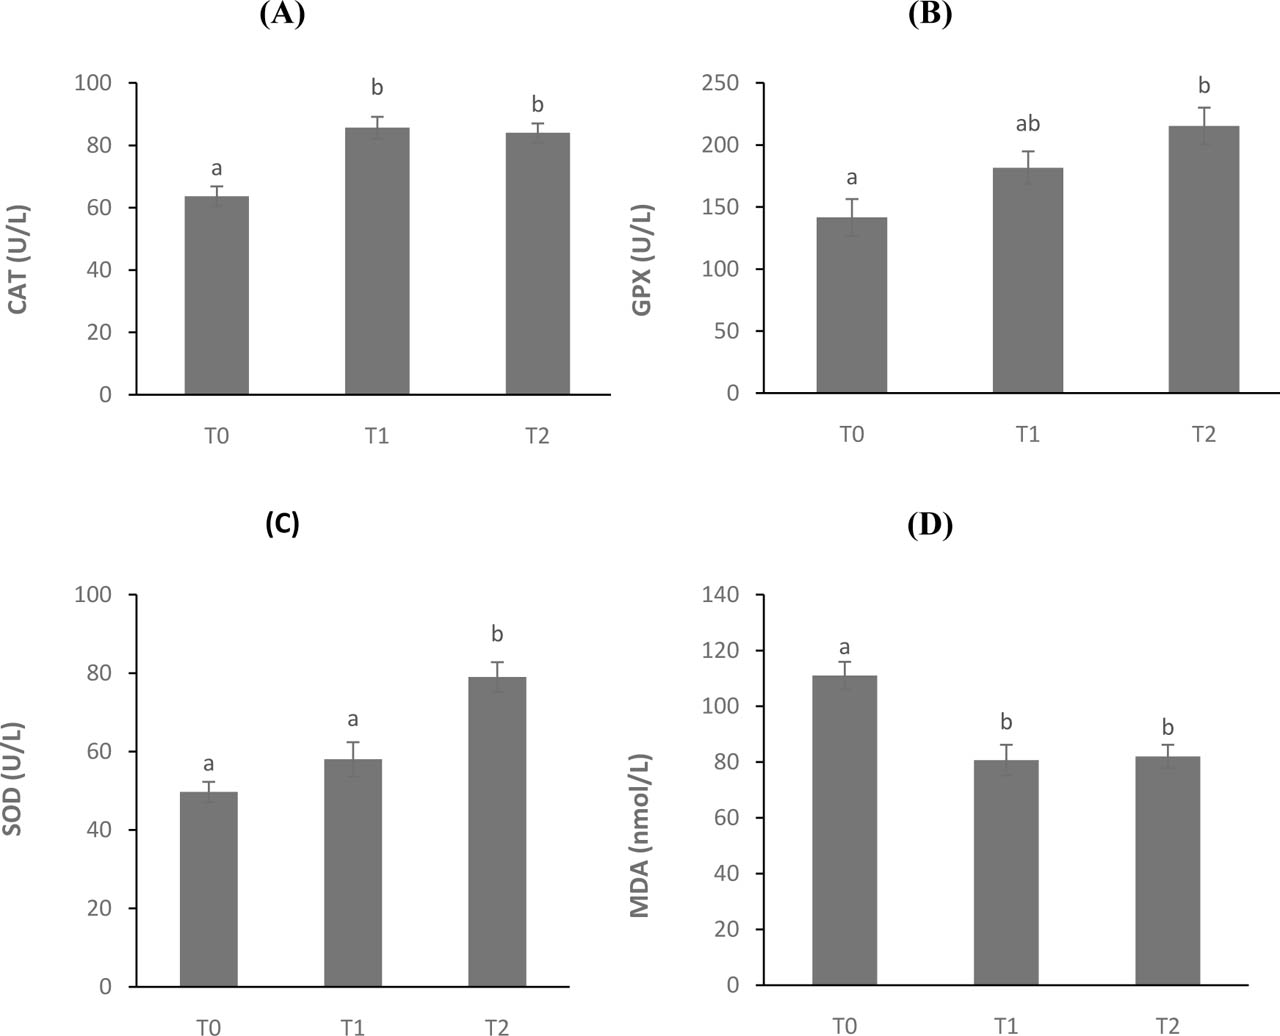
Figure 4.
Catalase (CAT, A), glutathione peroxidase (GPx, B), superoxide dismutase (SOD, C), and malondialdehyde (MDA, D) of stellate sturgeon (Acipenser stellatus) fed with 0 (T0), 400 (T1), and 600 (T2) mg CGA/kg feed for 45 days. Different letters designate significant differences as determined by Tukey’s post-hoc tests (mean ± SE)