
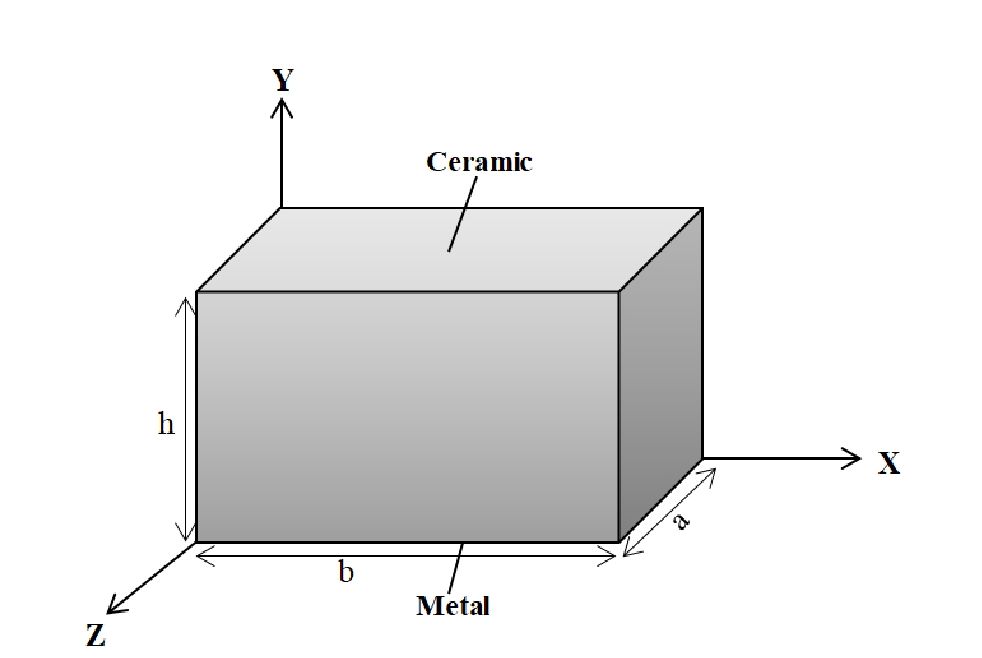
Fig. 1.
Geometry of a functionally graded material plate
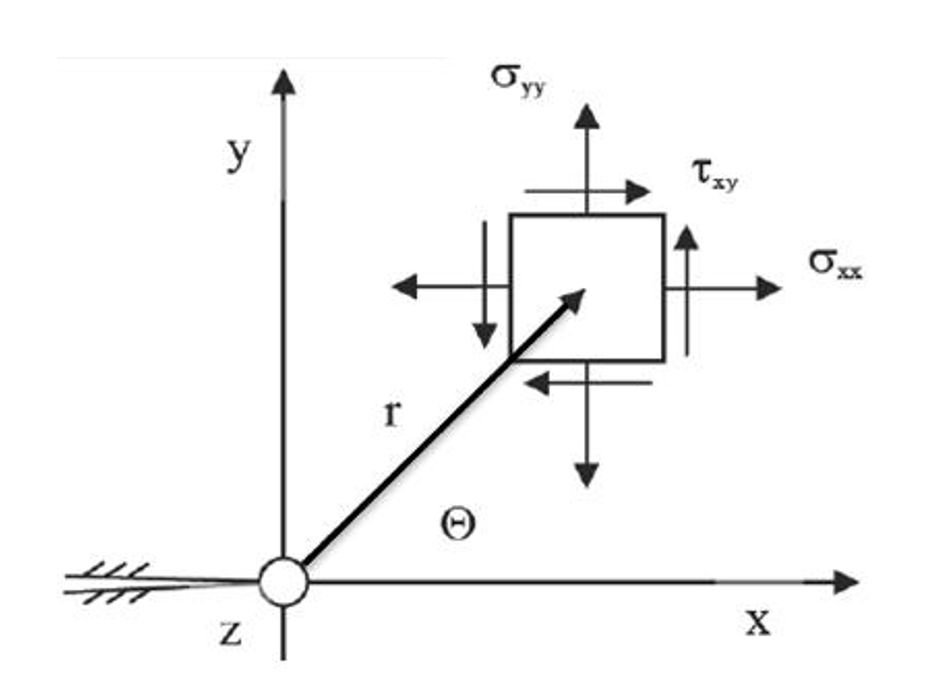
Fig. 3.
Distribution of stress components at the tip of a crack
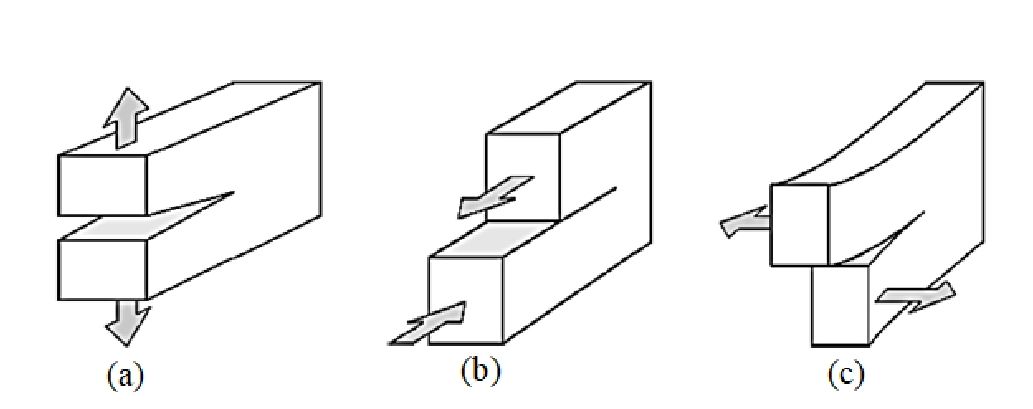
Fig. 4.
The Three Fundamental Modes of Crack Tip Deformation: (a) Mode I - Opening; (b) Mode II - Sliding; (c) Mode III - Tearing
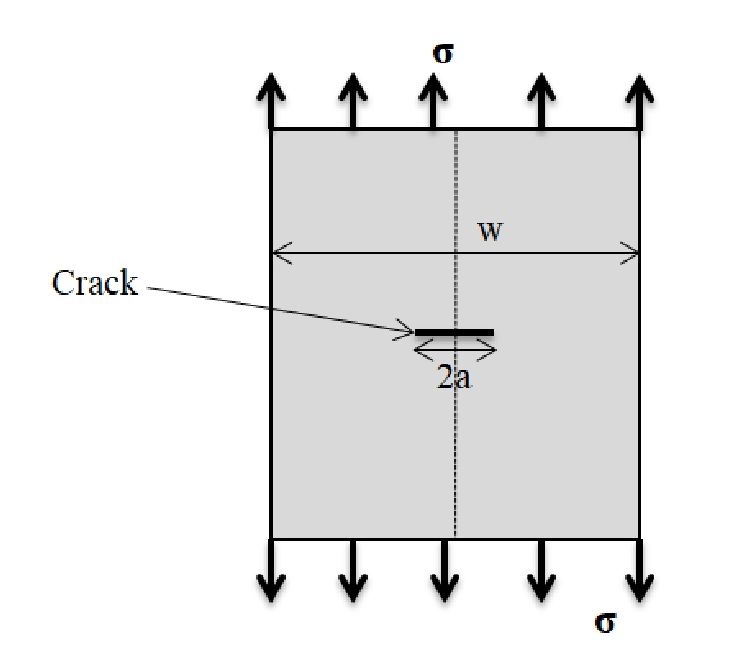
Fig. 2.
Illustration of a cracked plate with width w and crack length 2a
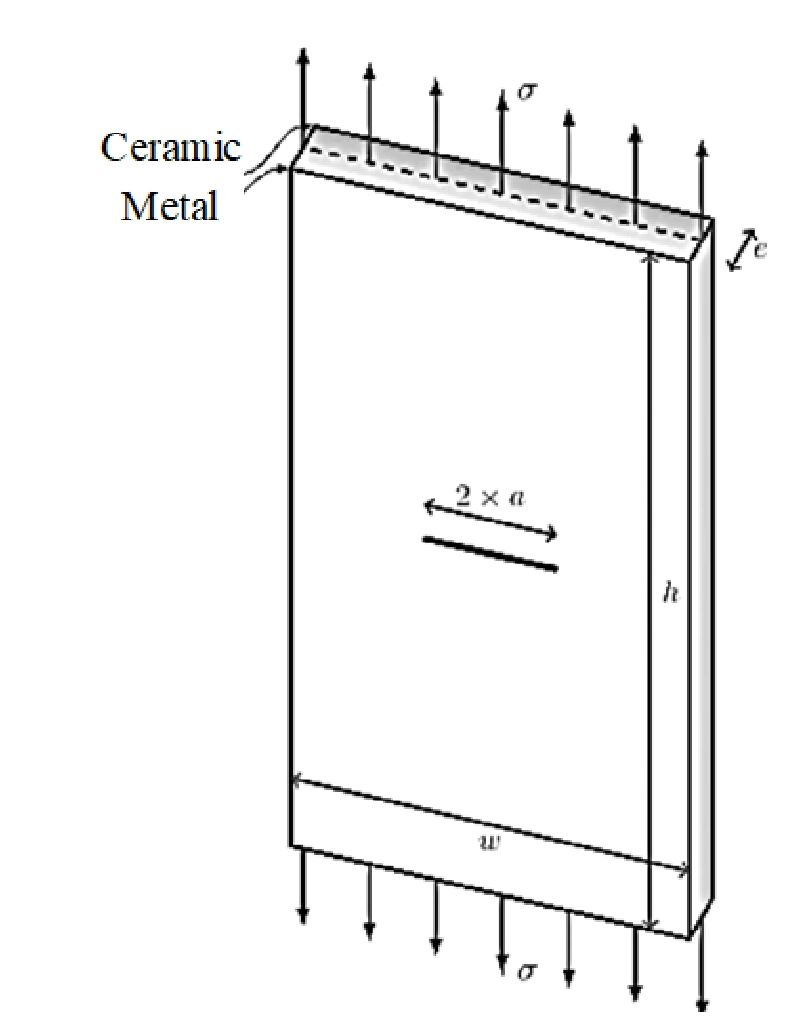
Fig. 5.
The material gradient plate (FGM)
Tab. 1.
Material properties of metal and ceramic
| Material | Young's modulus (GPa) | Poisson's ratio | Mass density (kg/m3) |
|---|---|---|---|
| Aluminum (Al) | 70 | 0.3 | 2702 |
| Zirconia (ZrO2) | 151 | 0.3 | 3000 |
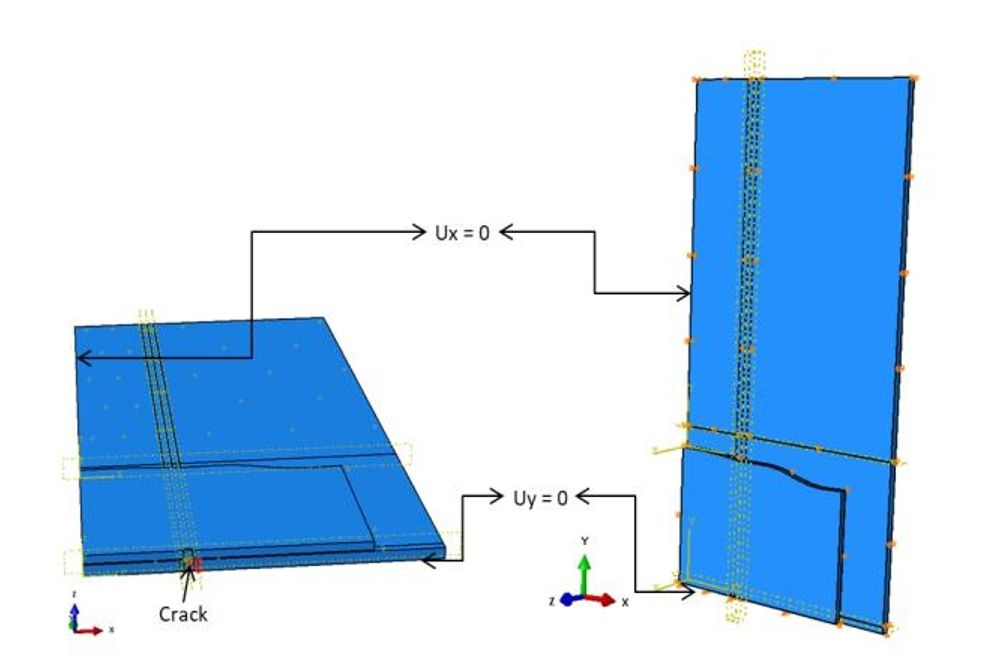
Fig. 6.
Boundary conditions imposed on the structure
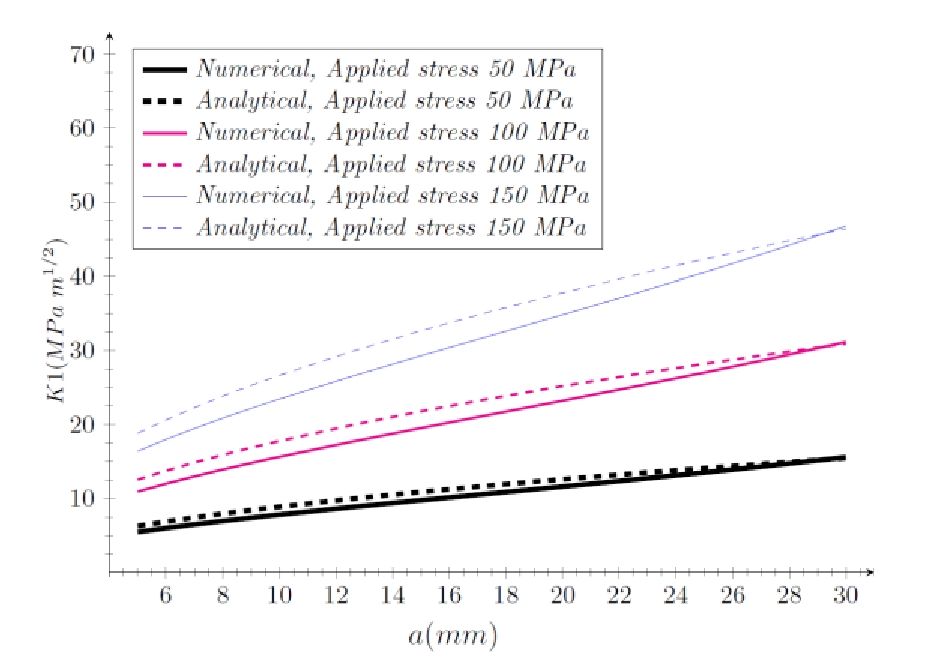
Fig. 7.
Comparison of Numerical and Analytical Stress Intensity Factors (K1) at Different Applied Stress Levels
Tab. 2.
Mechanical properties of composite patch and adhesive
| Composite patch | Adhesive | |
|---|---|---|
| E1(GPa) | 135 | 2.1547 |
| E2(GPa) | 9 | |
| E3(GPa) | 9 | |
| G12(GPa) | 5 | |
| G13(GPa) | 5 | |
| G23(GPa) | 8 | |
| ν12 | 0.3 | 0.34 |
| ν13 | 0.3 | |
| V23 | 0.02 |
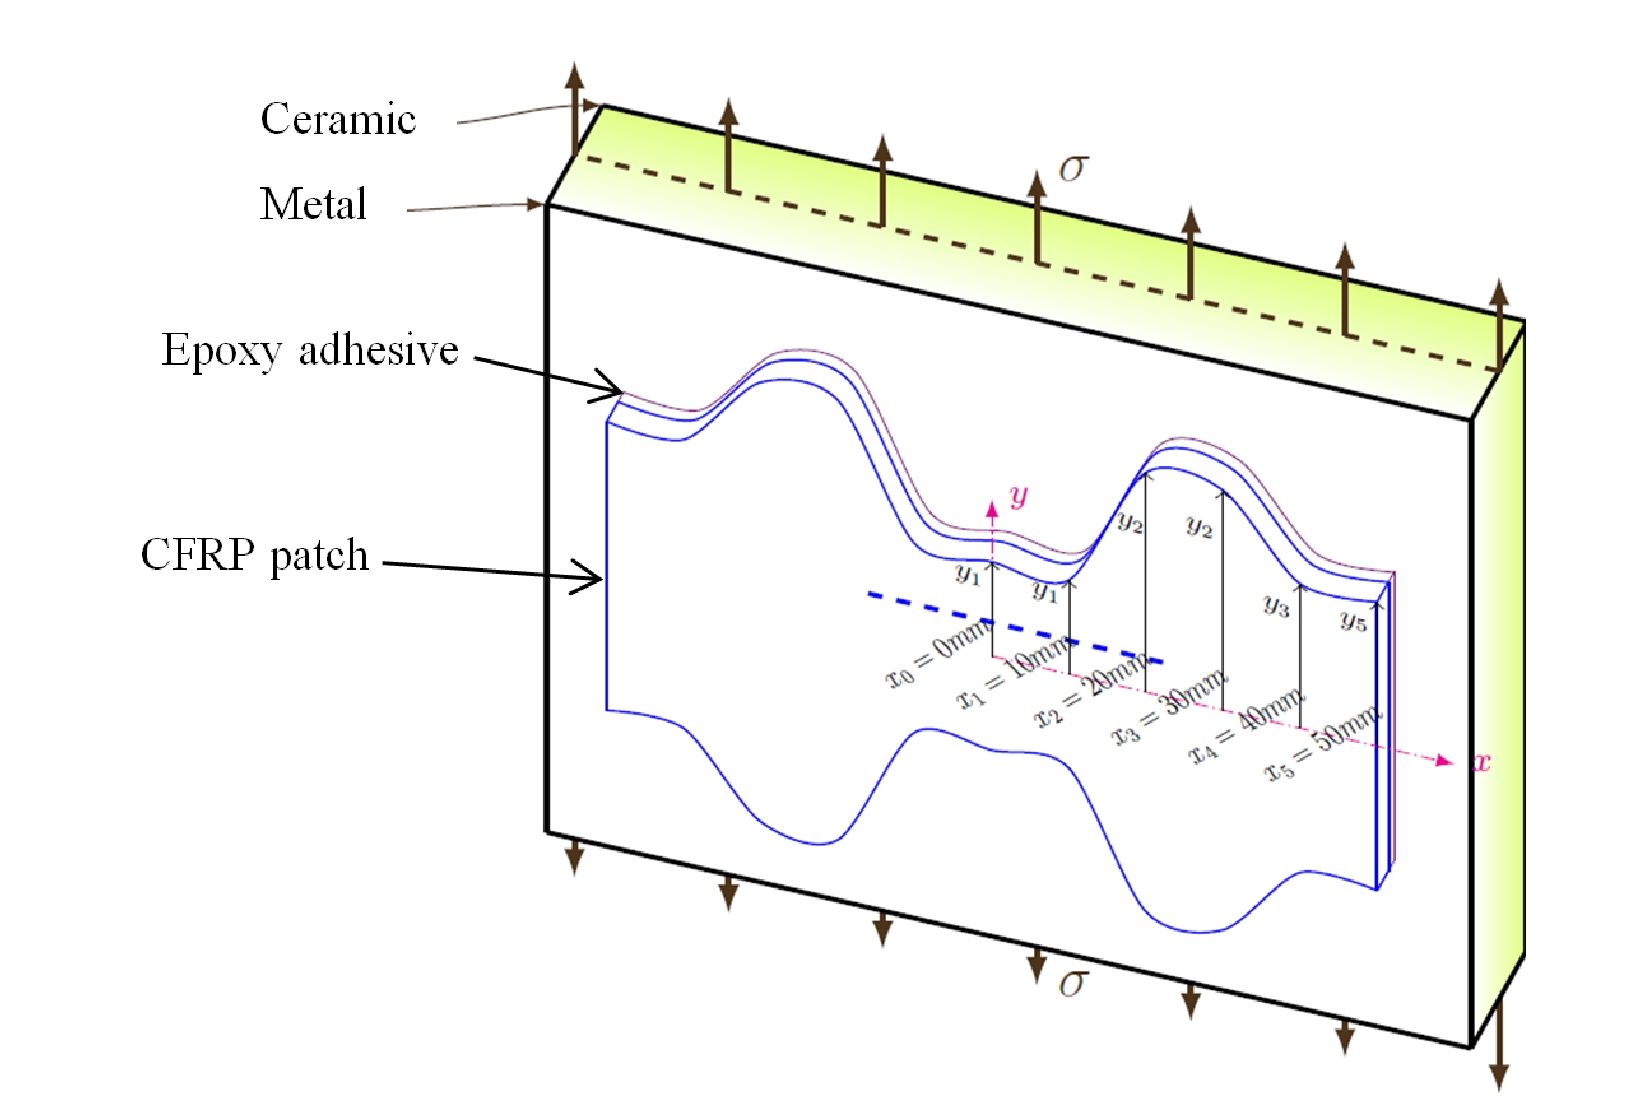
Fig. 8.
FGM Plate Reinforced with Carbon Fiber-Reinforced Polymer (CFRP) Patches under Tensile Loading with Ceramic-Metal Gradient Layers and Patch Optimization Paths
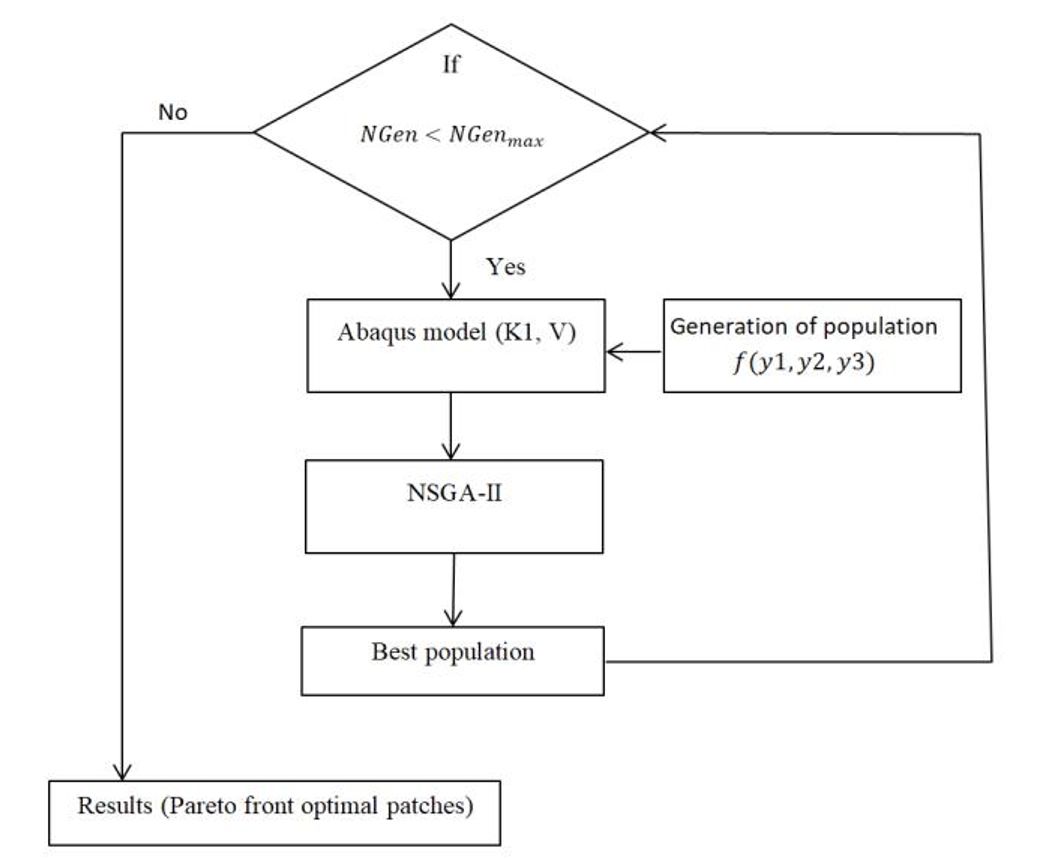
Fig. 9.
Optimization Flowchart Using NSGA-II and Pareto Front Method to Identify Optimal Patch Geometries through Abaqus Simulations
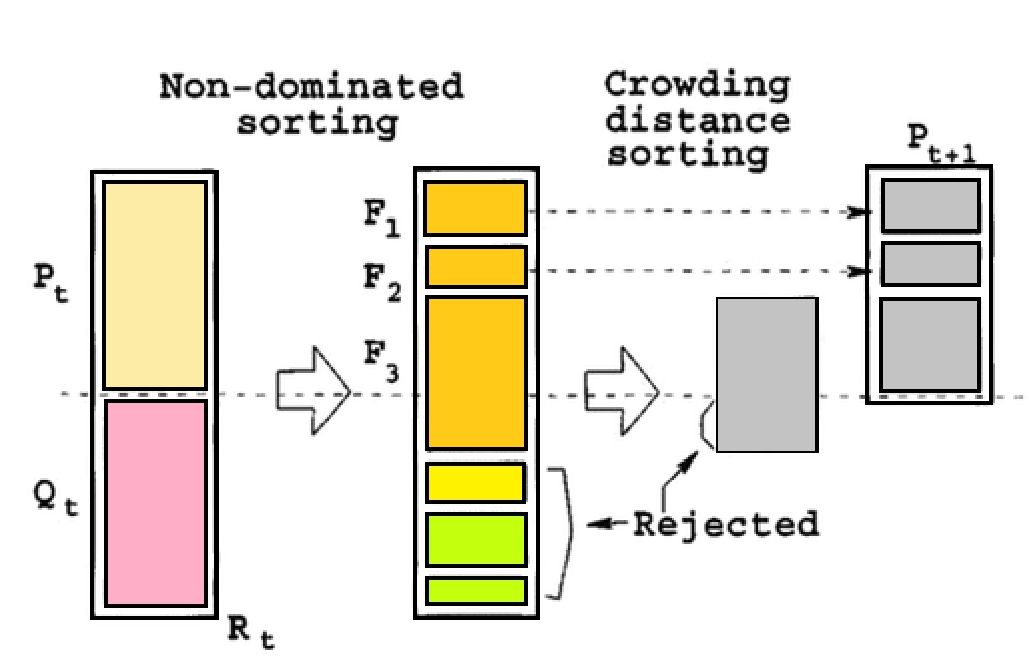
Fig. 10.
Flowchart of the NSGA-II Multi-Objective Optimization Process for Patch Geometry and Stress Intensity Factor Minimization
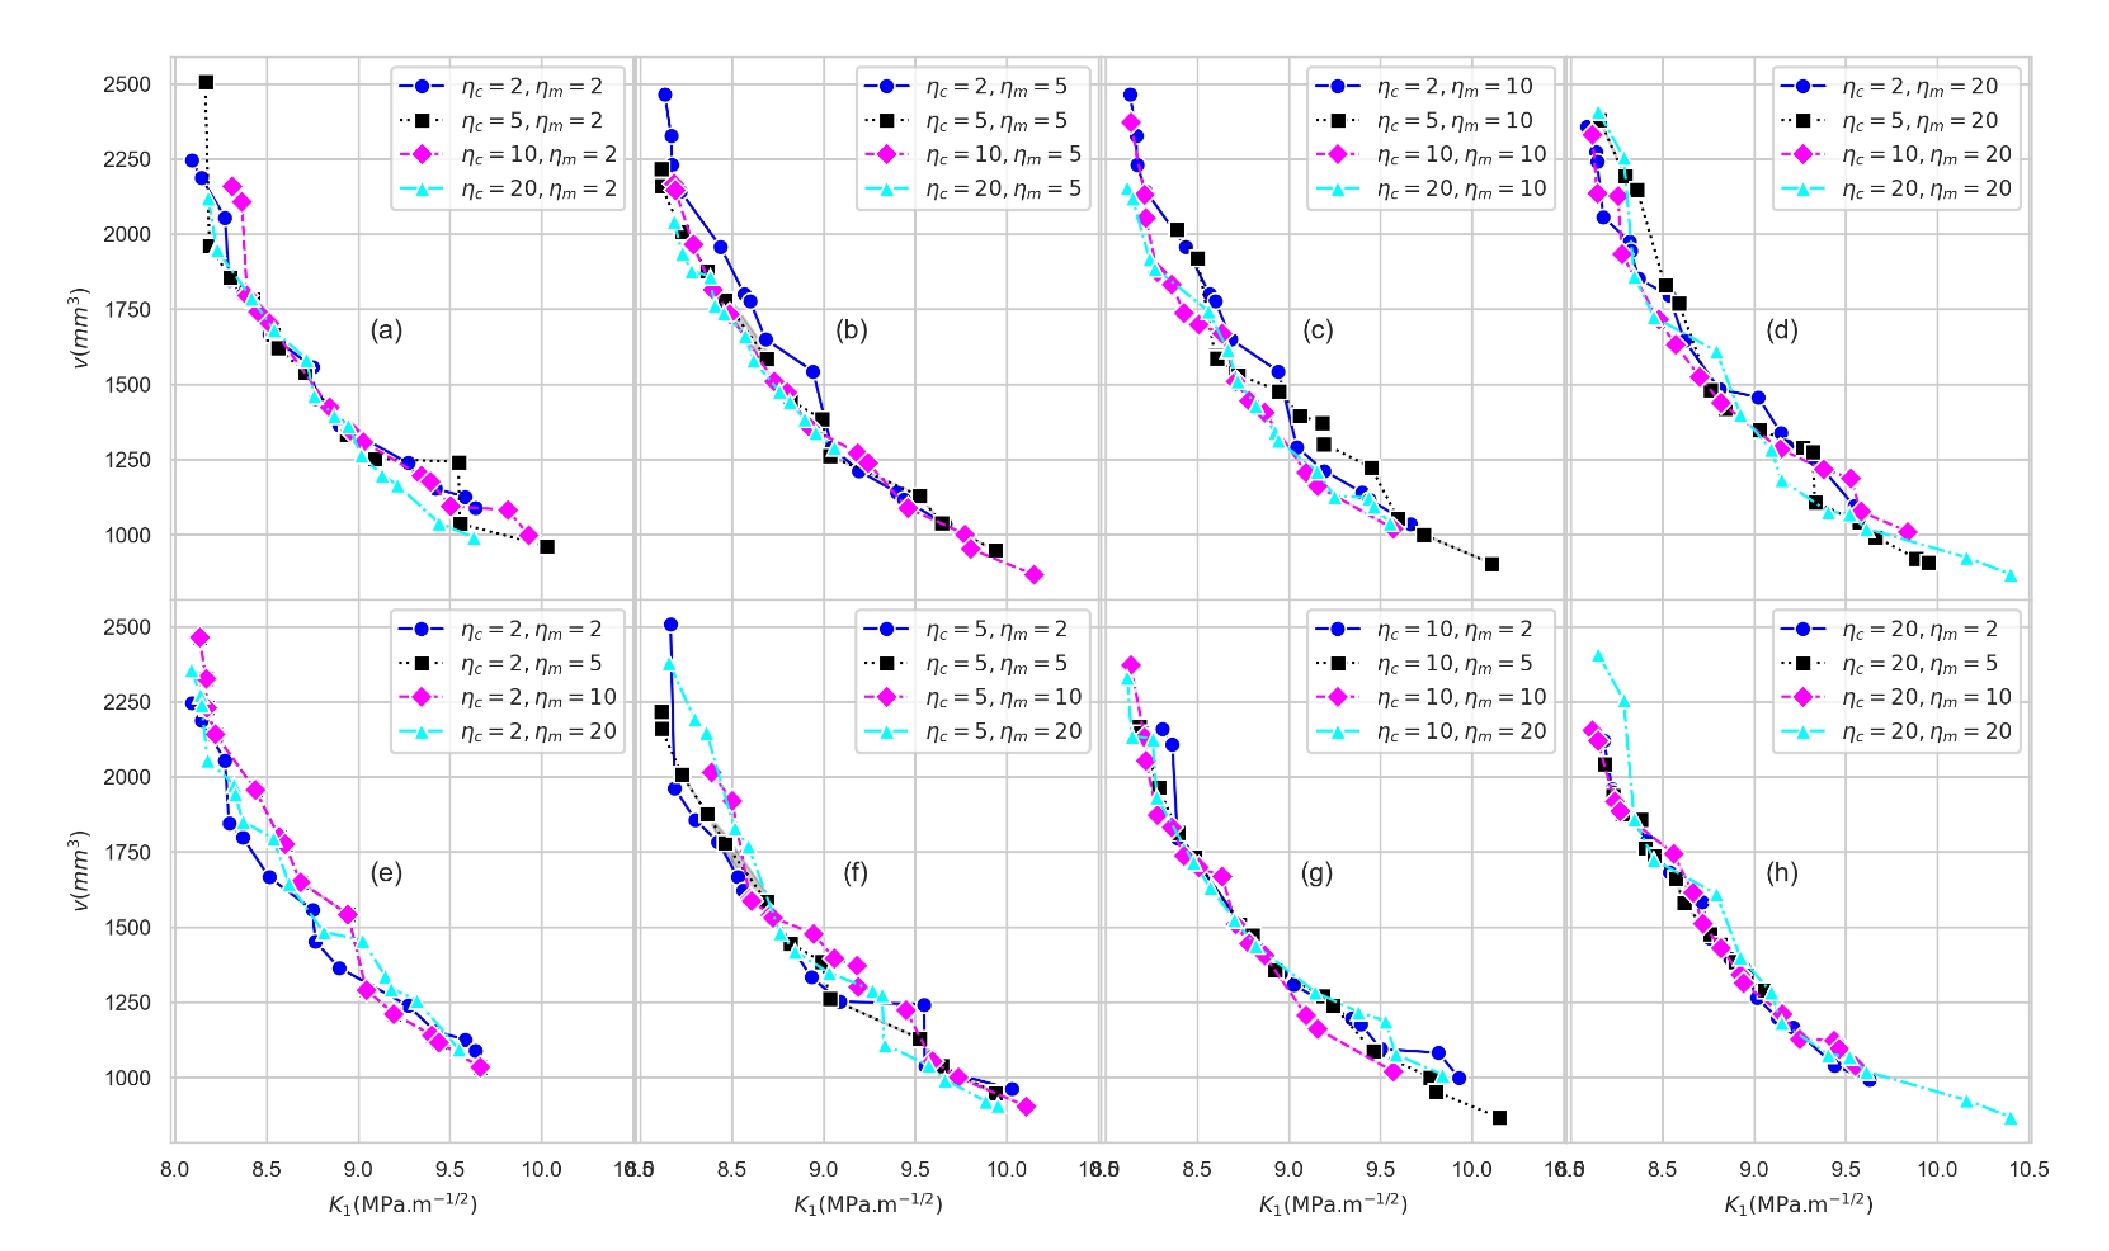
Fig. 11.
Influence of Parameters ηc and ηm on Volume Reduction (V) as a Function of (k1) with NSGA-II Pareto Front Optimization.
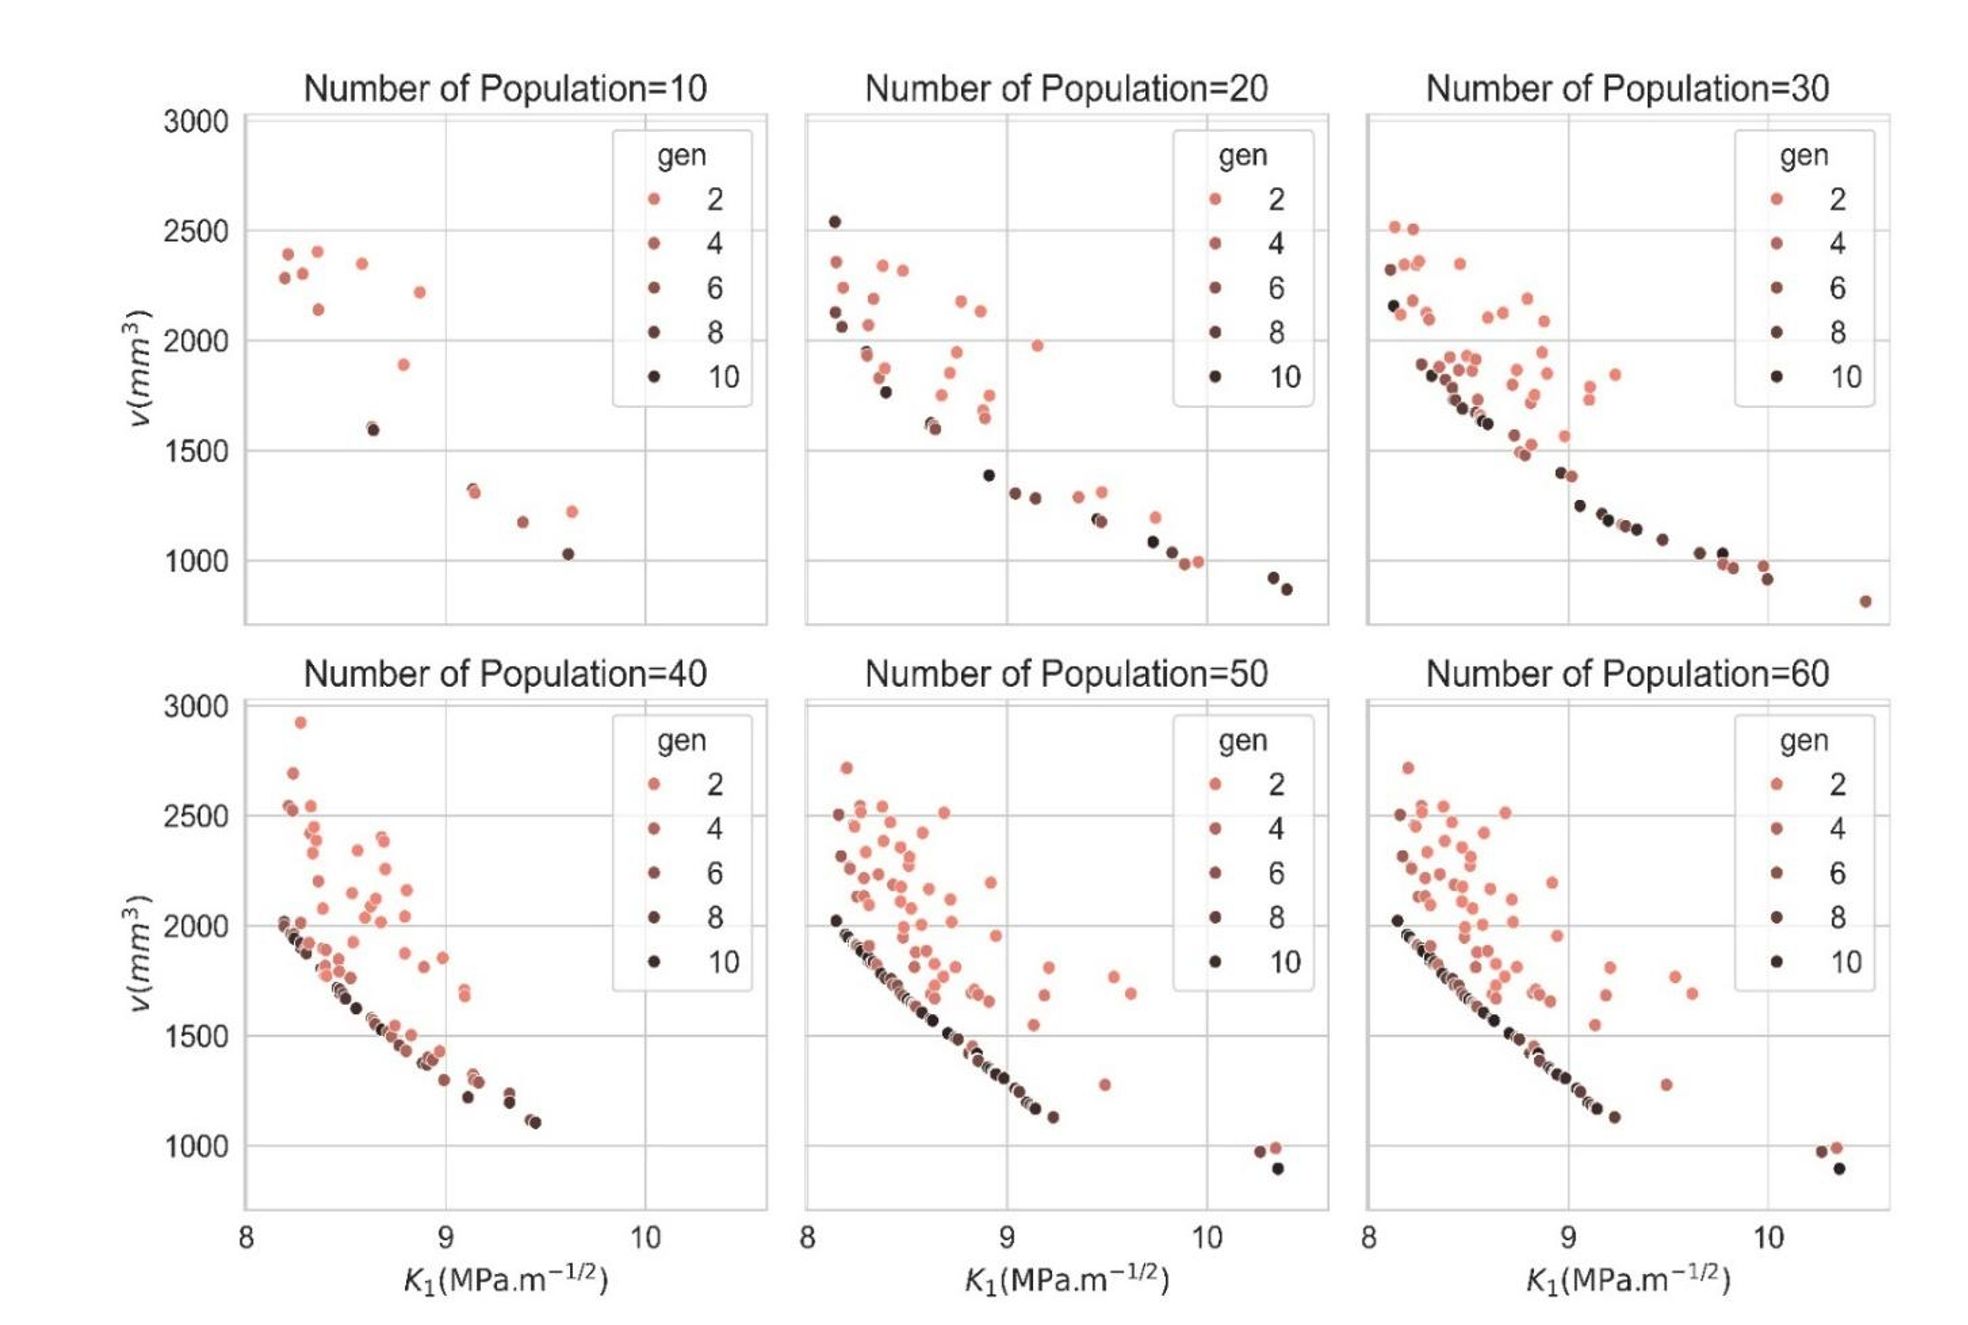
Fig. 12.
Evolution of the Pareto Front with NSGA-II Optimization for Different Population Sizes
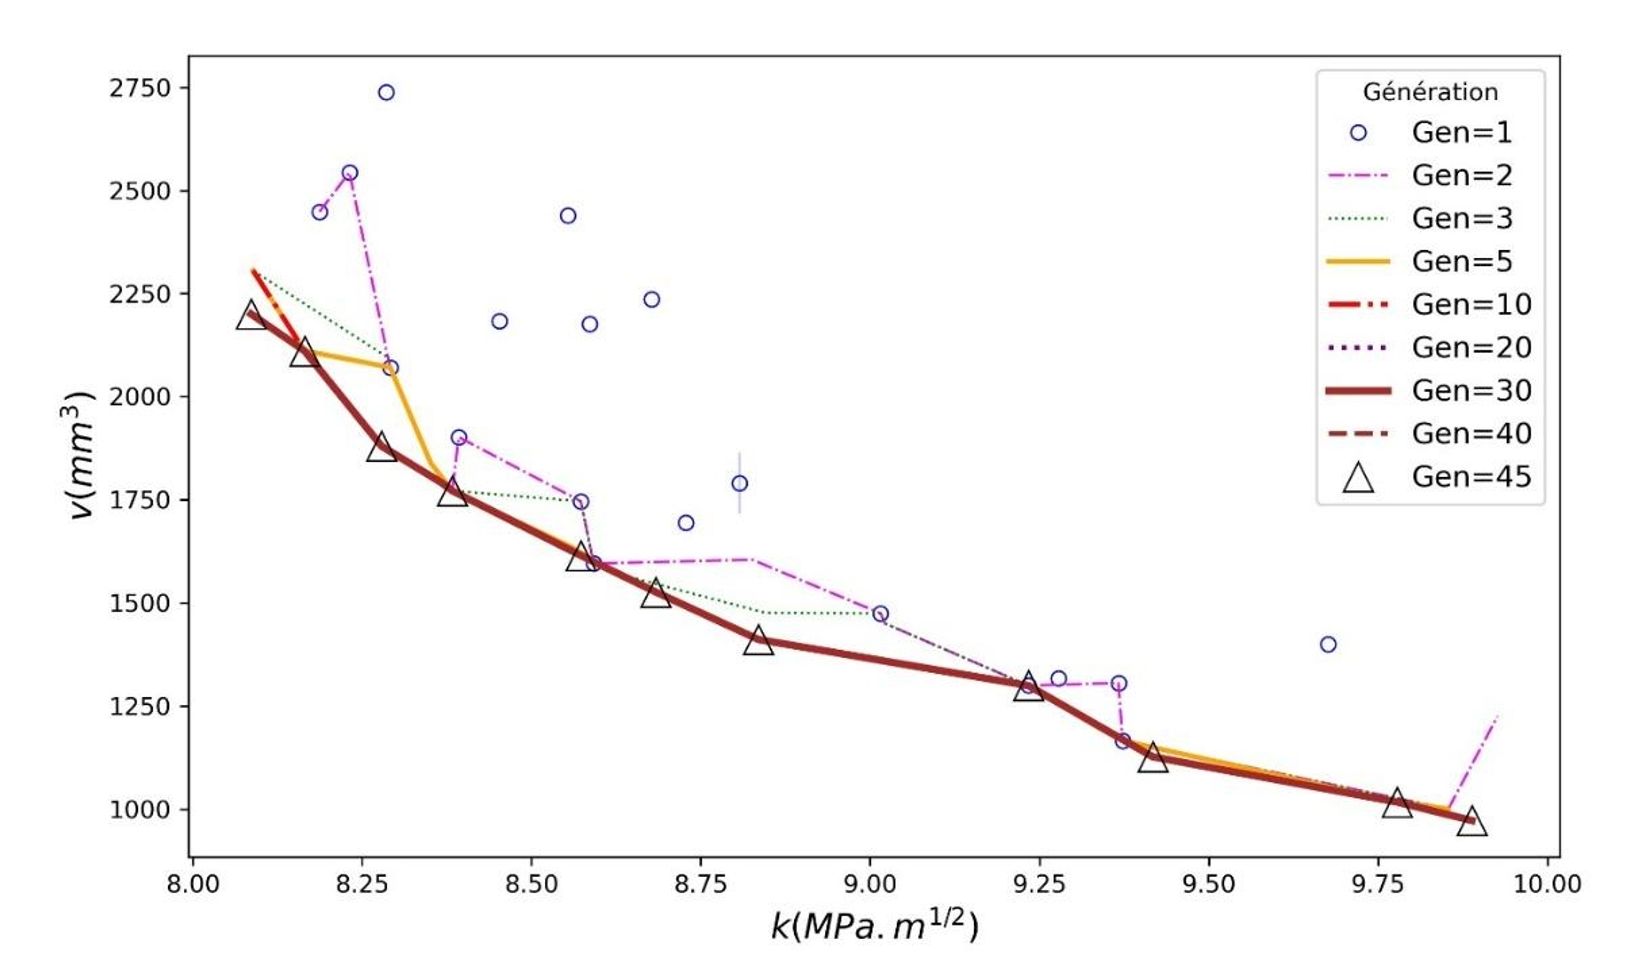
Fig. 13.
Convergence of the NSGA-II Algorithm with Respect to the Number of Generations
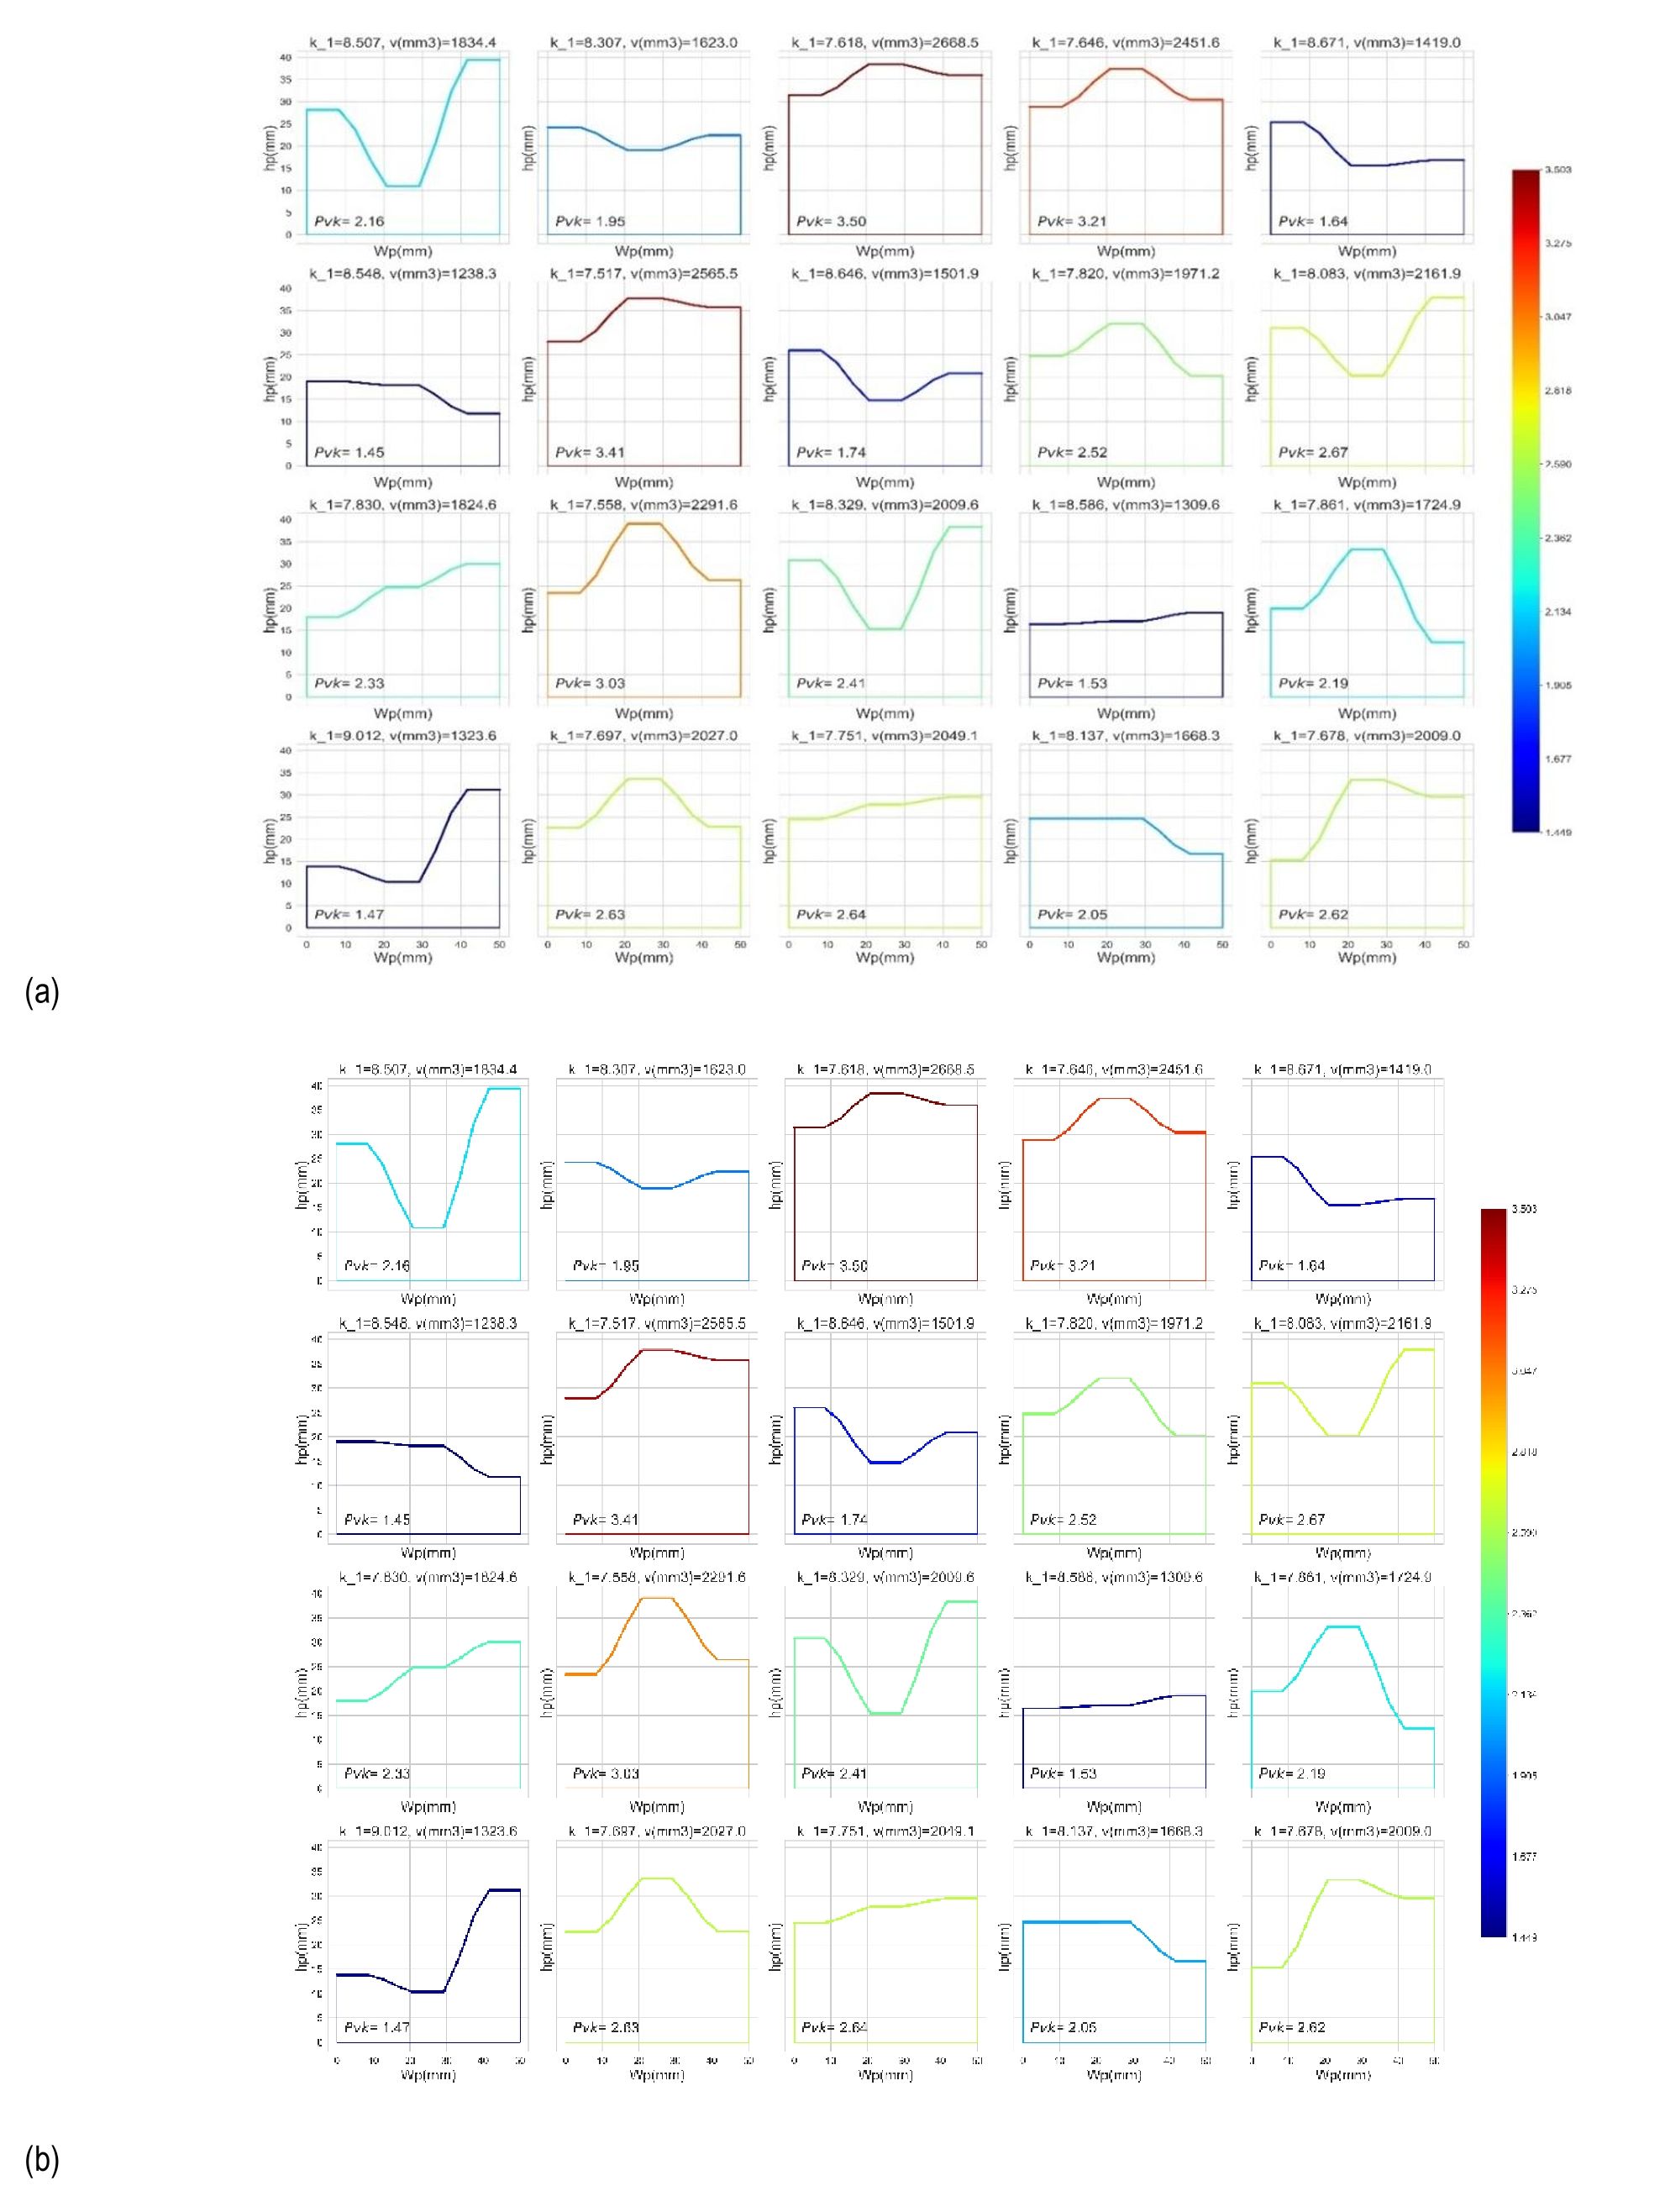
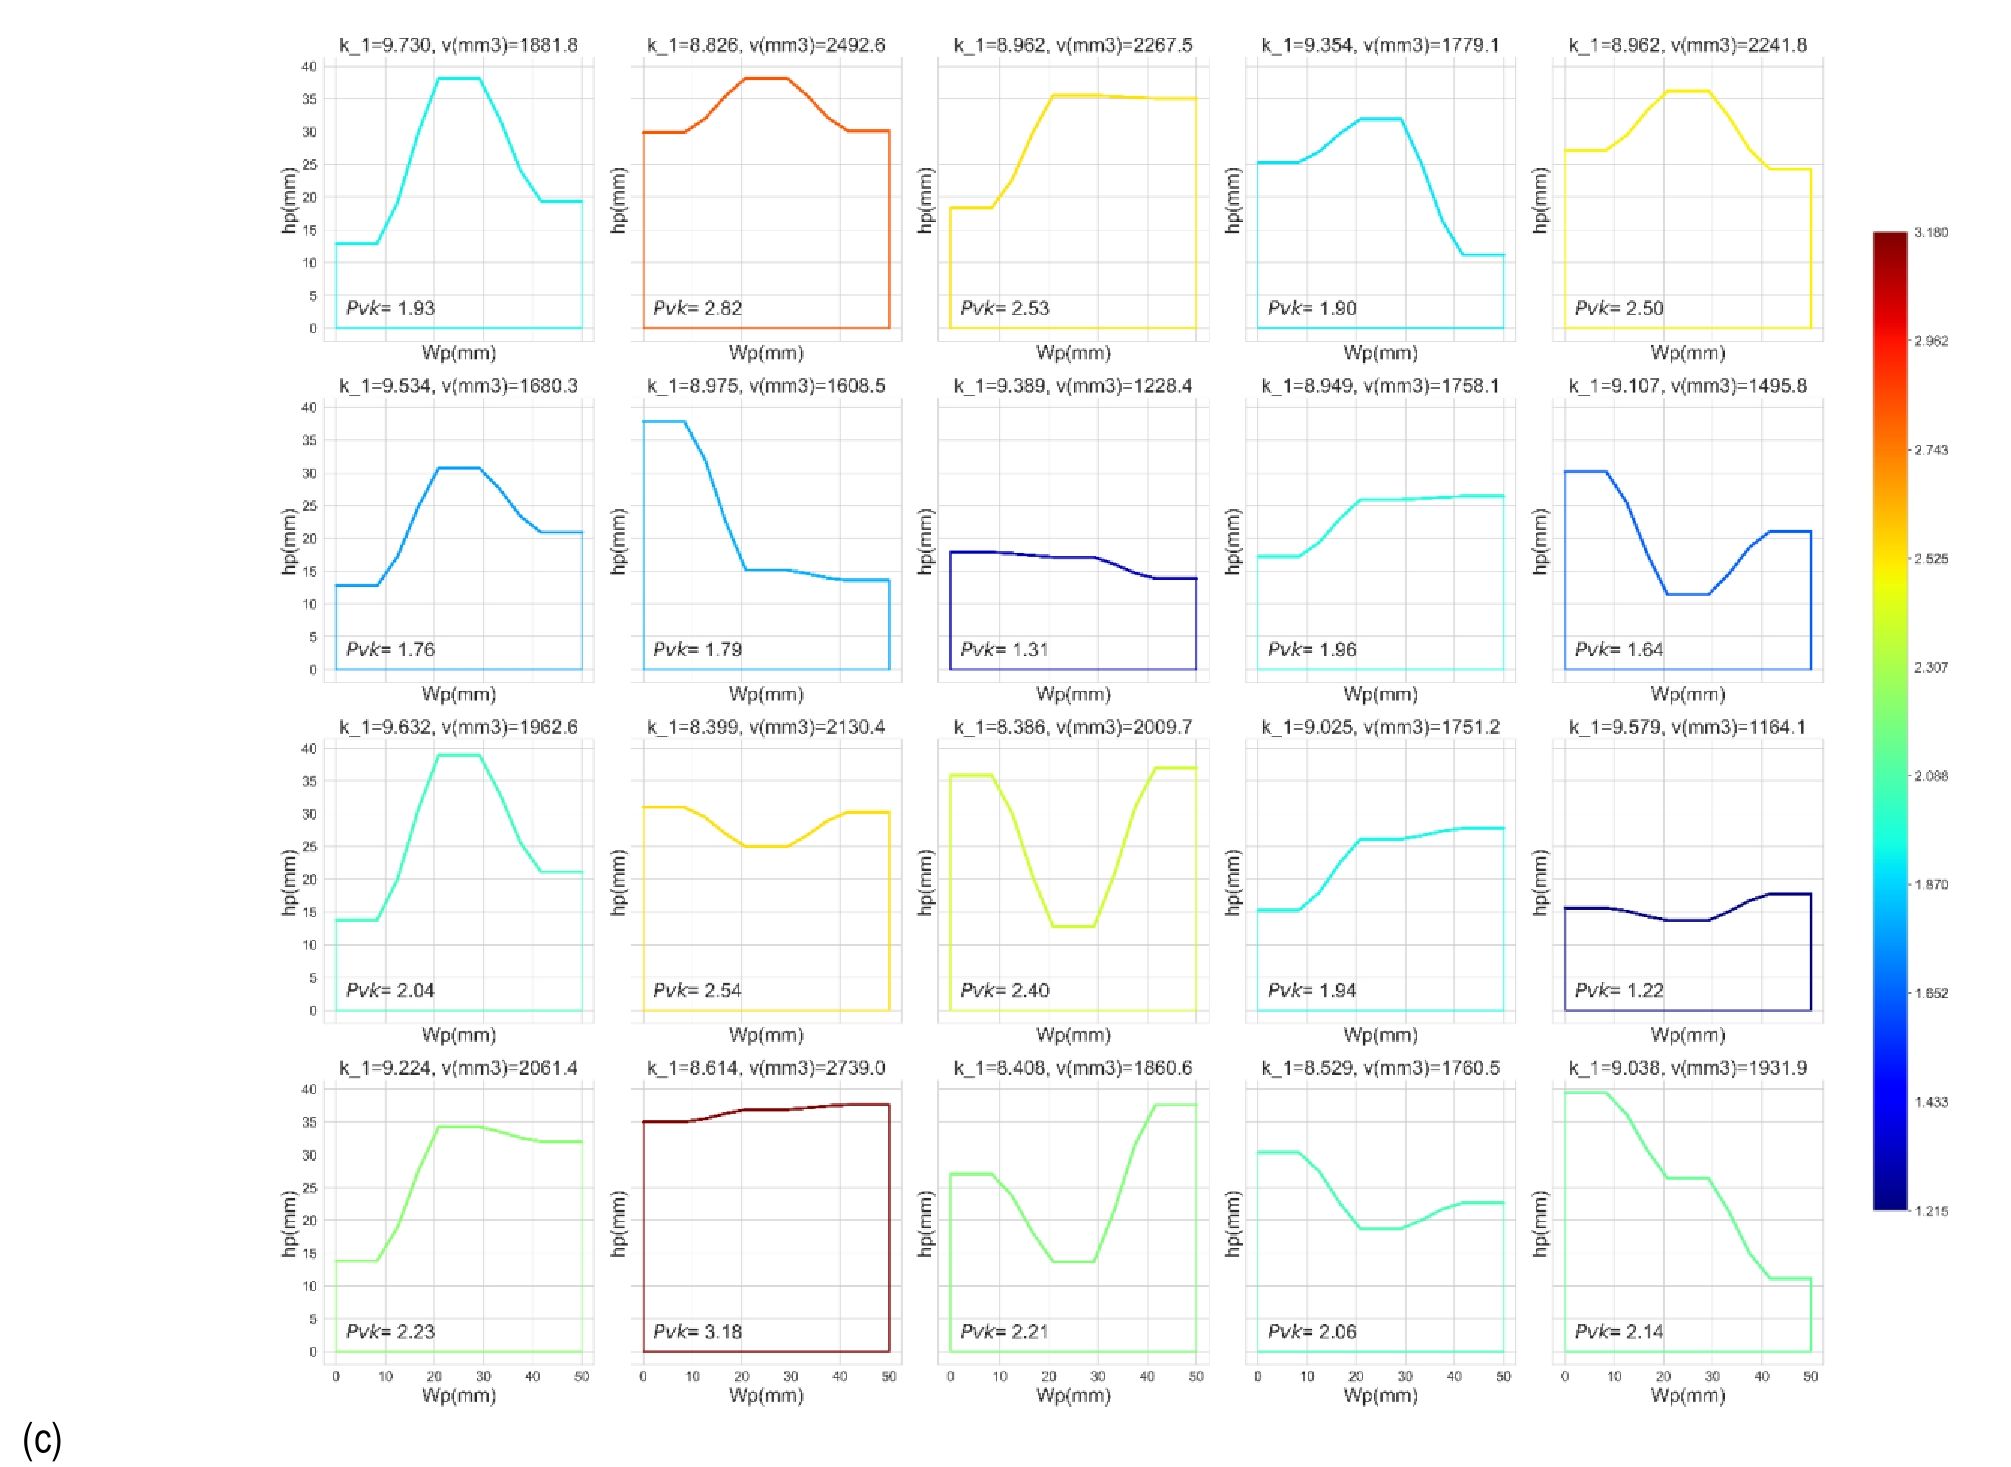
Fig. 14.
Patch Dashboard for Multi-Objective Optimization of Crack Repair: Trade-offs Between Volume and Stress Intensity Factor (K1); a) 2a=10 mm, b) 2a=18mm, c) 2a=26mm