
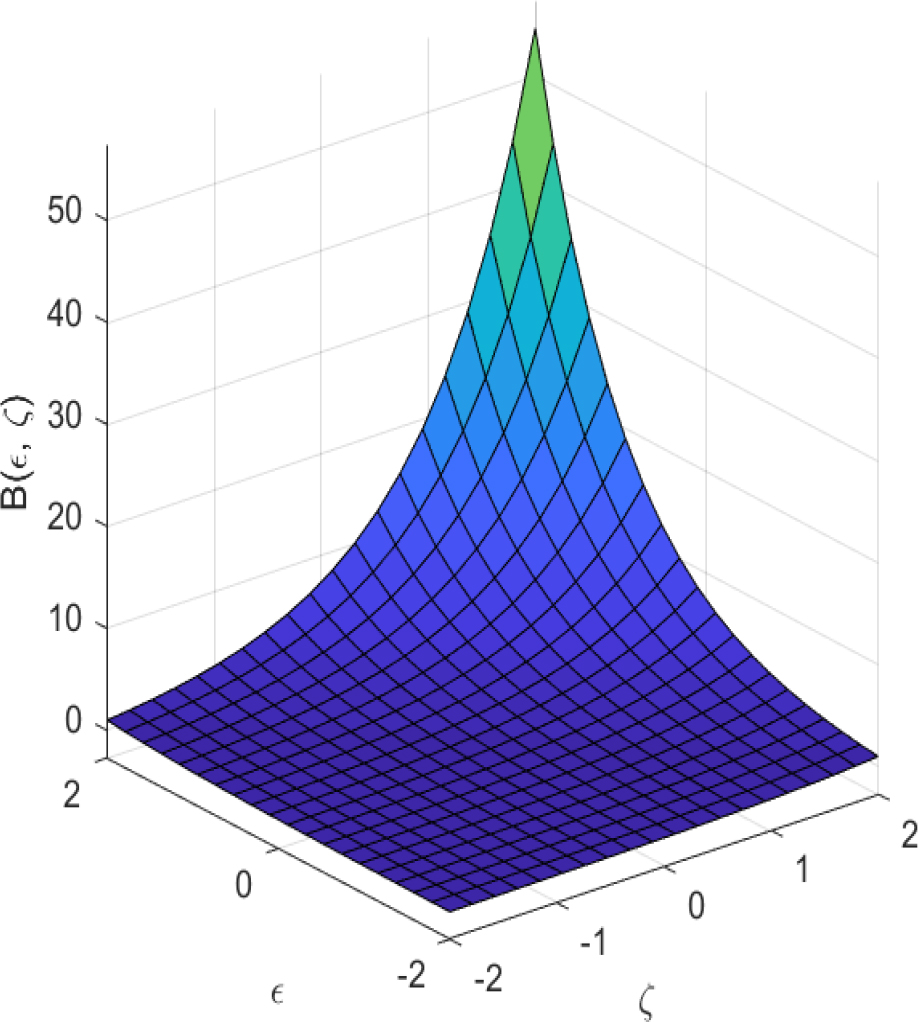
Fig. 1.
Graphical representation of the ETM solution to example 1 after only one iteration
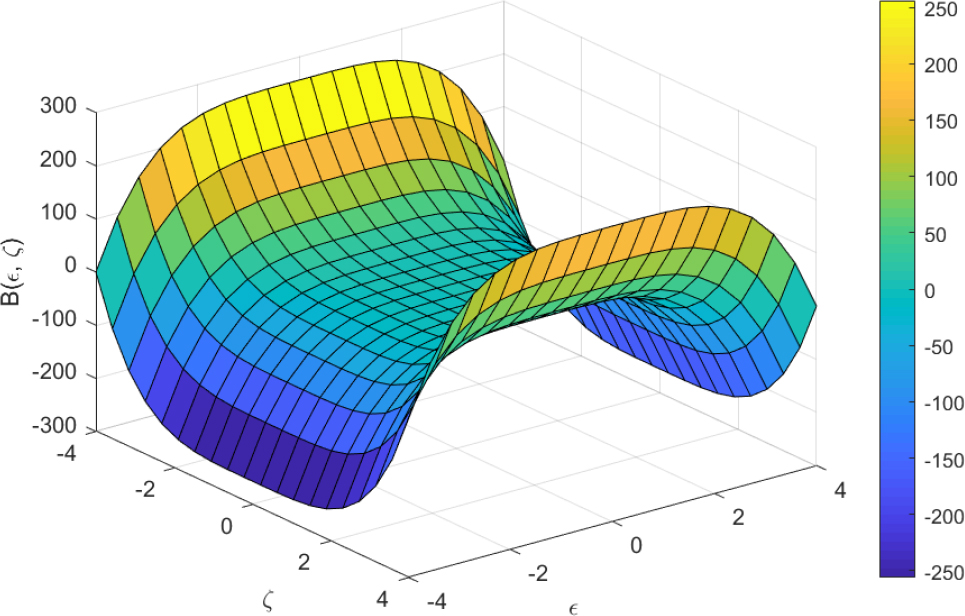
Fig. 2.
Graphical representation of the exact solution to example 2 via ETM after only one step
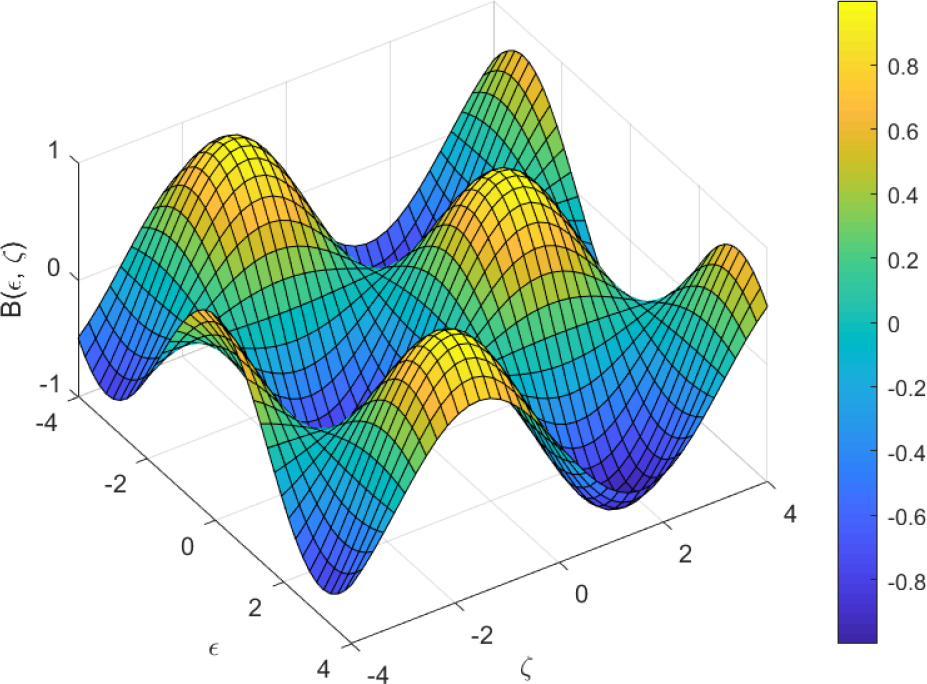
Fig. 3.
Graphical representation of the exact solution to example 3 via ETM after only one iteration
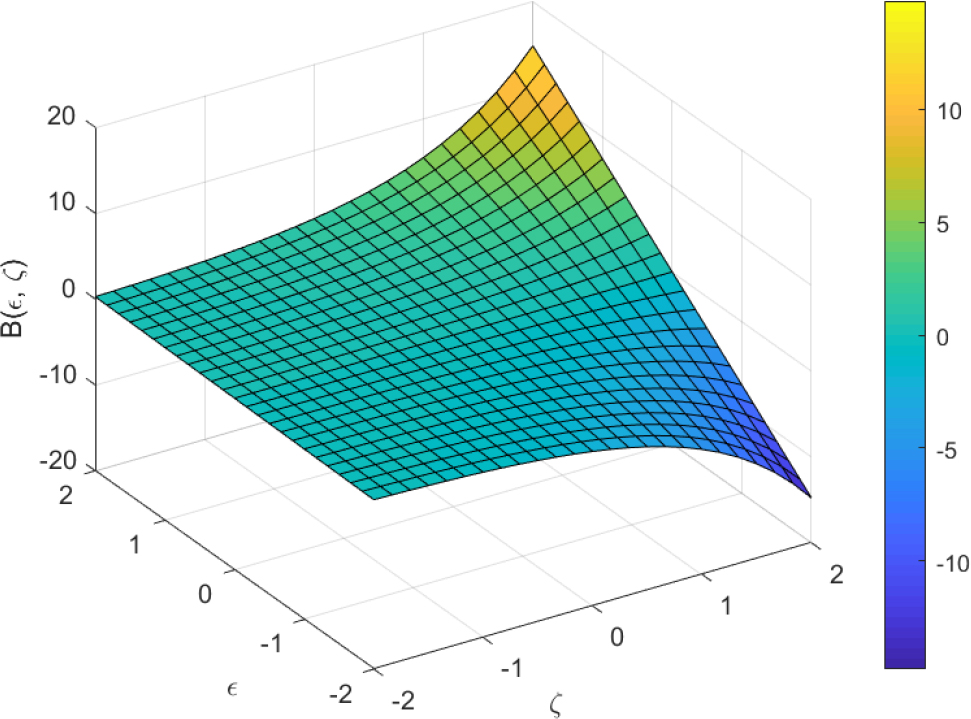
Fig. 4.
Graphical representation of the exact solution to example 4 via ETM after only two iterations
Tab. 1.
Relative errors concerning example 4
| Point | Elzaki relative error |
|---|---|
| (0,0) | 0 |
| (–2, –2) | 0 |
| (2, 2) | 2.4040 × 10⁻¹⁶ |
| (0.5, 1.8333) | 0 |
| (0.5, –1.8333) | 1.7360 × 10⁻¹⁵ |
| (1.5, 1.5) | 2.6424 × 10⁻¹⁶ |
| (–1.5, –1.5) | 3.3171 × 10⁻¹⁶ |
| (1.1667, 0.6667) | 1.8535 × 10⁻¹⁶ |
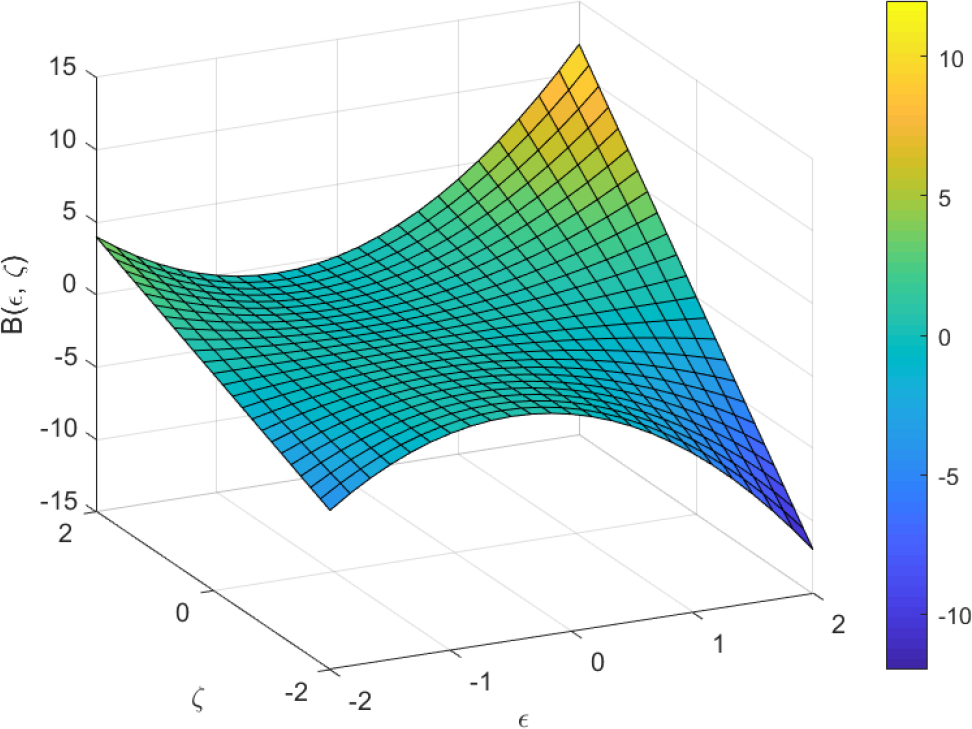
Fig. 5.
Graphical representation of the exact solution to example 5 via ETM after only one iteration