
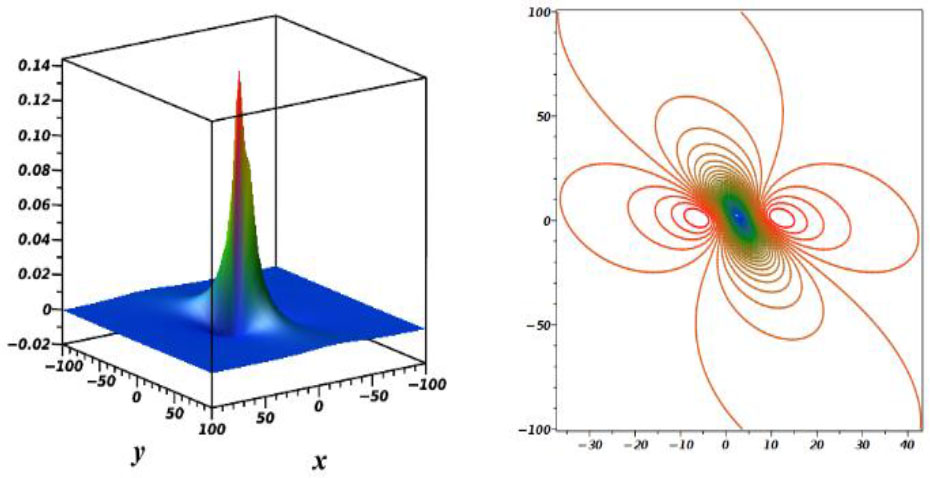
Fig. 1.
Graphs of one-M-lump wave when z = 2, t = 2, , b1 = 0.5, c1 = 0.5, d1 = 0.5, β = 2, γ = –1.
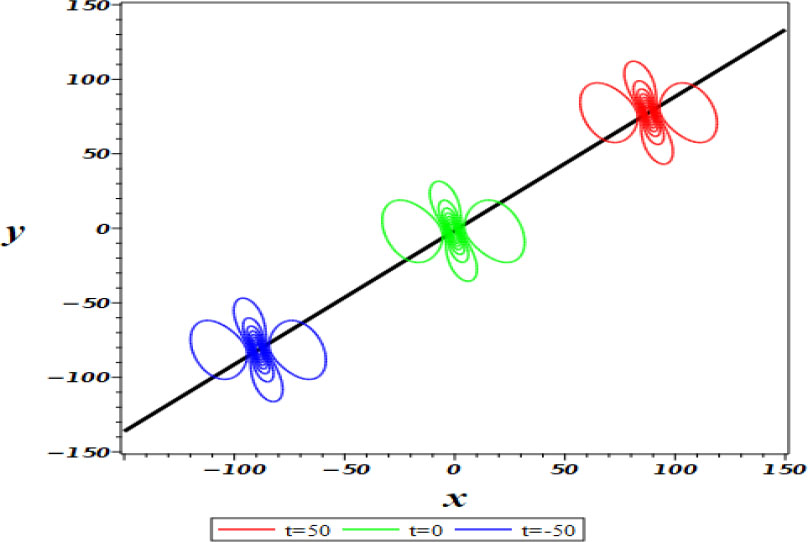
Fig. 2.
Plot of Eq. (12) for z = 2, , b1 = 0.5, c1 = 0.5, d1 = 0.5, β = 2, γ = –1
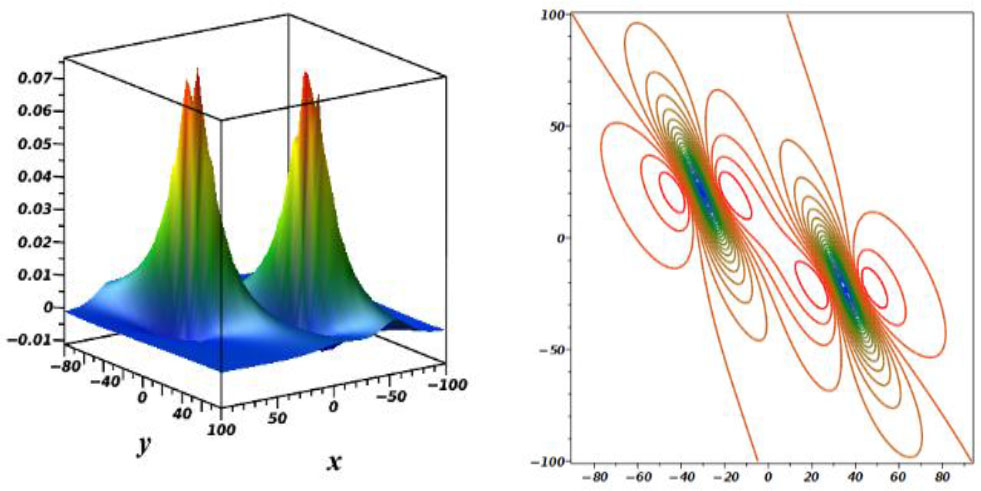
Fig. 3.
Plots of 2-M-lump wave when z = 2, t = 2, a1 = 0.5, b1 = 0.5, , , , , , , β = 2, γ = –1.
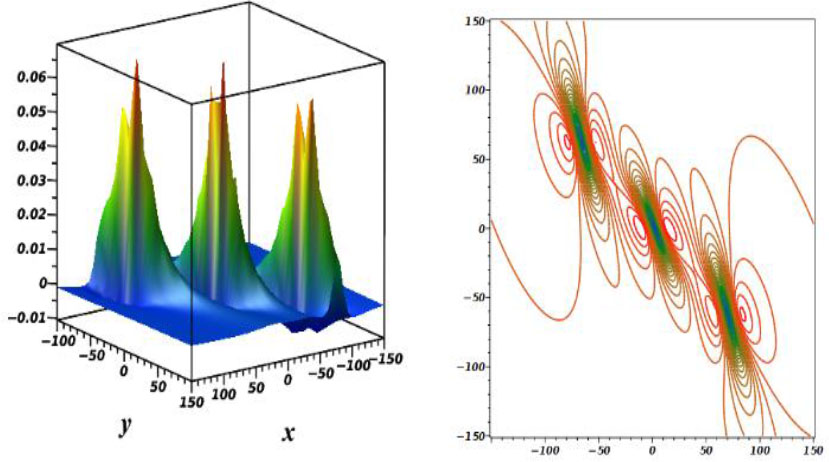
Fig. 4.
Plots of 3-M-lump wave when z = 2, t = 2, a1 = 0.5, b1 = 0.5, , , , , c1 = 0.5, d1 = 0.5, , , , , β = 2, γ = –1
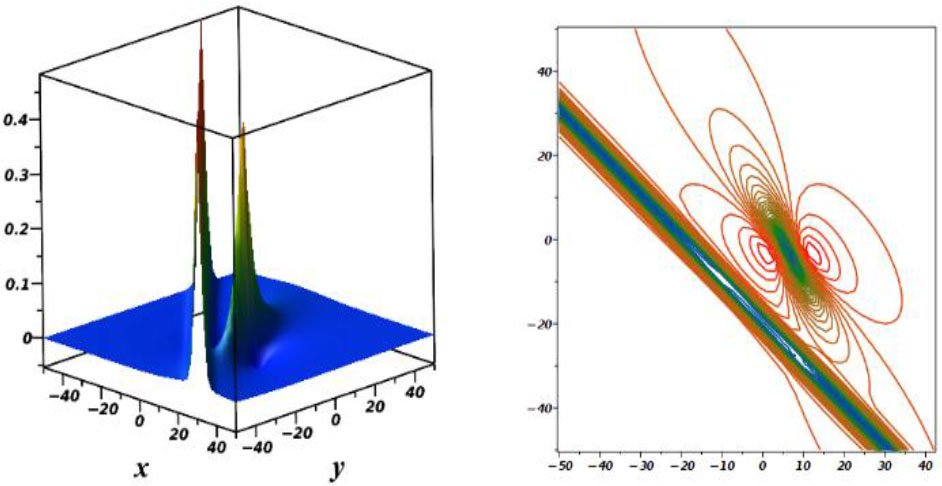
Fig. 5.
Plots of M-lump with soliton solution when z = 1, t = 2, a1 = 0.5, b1 = 0.5, , , k3 = 1, l3 = 1, j3 = 2, λ3 = 20, β = 2, γ = –1
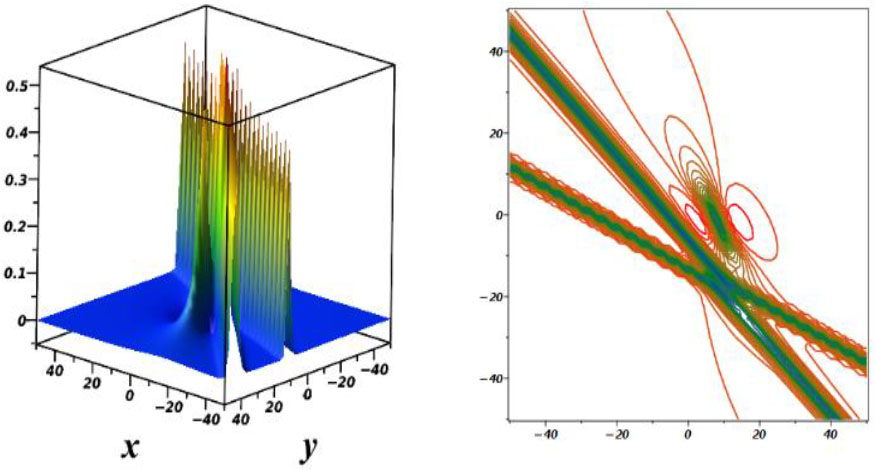
Fig. 6.
Graphs of M-lump with a 2-soliton solution when z = 1, t = 2, a1 = 0.5, b1 = 0.5, , , k3 = 1, l3 = 1, j3 = 2, λ3 = 10, k4 = 1, l4 = 2, j4 = 3, λ4 = 20, β = 1, γ = –5
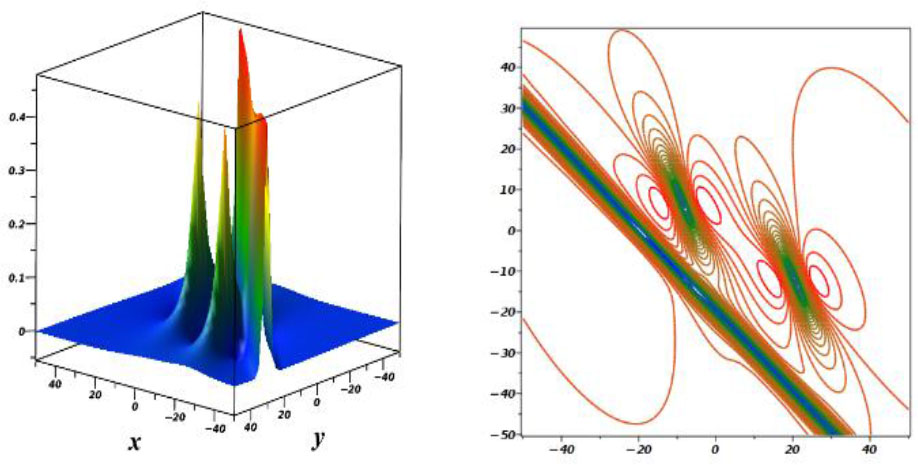
Fig. 7.
Plots of 2-M-lump with soliton solution when z = 1, t = 2, a1 = 0.5, b1 = 0.5, , , , , , , k5 = 1, l5 = 1, j5 = 2, λ5 = 20, β = 1, γ = –5
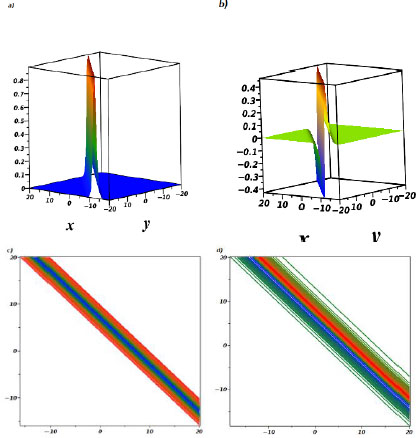
Fig. 8.
Graphs of complex one-soliton wave are plotted for z = 1, t = 2, k1 = 1, l1 = 1, j1 = 2, α1 = 1, β = 1, γ = 2: a) Real part, b) Imaginary part, c) Contour plot of real part, d) Contour plot of imaginary part
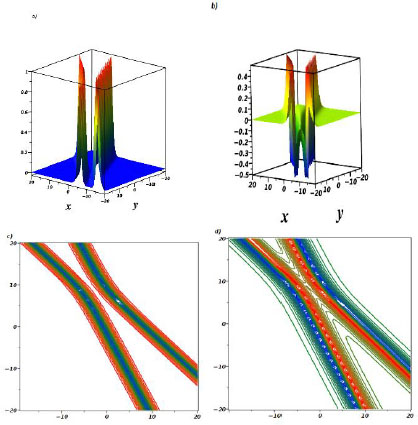
Fig. 9.
Graphs of complex two-soliton wave are plotted for z = 1,t = 2, k1 = 1, k2 = 1, l1 = 1, l2 = 0.5, j1 = 0.5, j2 = 0.5, α1 = 3, β2 = 1, γ1 = 2: a) Real part, b) Imaginary part, c) Contour plot of real part, d) Contour plot of imaginary part
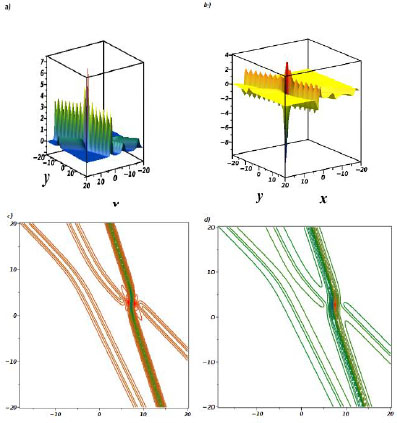
Fig. 10.
Graphs of complex four-soliton wave are plotted for z = 1, t = 2, k1 = 1, k2 = 1, k3 = 2, l1 = 1, l2 = 0.5, , j1 = 0.5, j2 = 0.5, , α1 = 3, α2 = 6, α3 = 9, β = 1, γ = 2: a) Real part, b) Imaginary part, c) Contour plot of real part, d) Contour plot of imaginary part
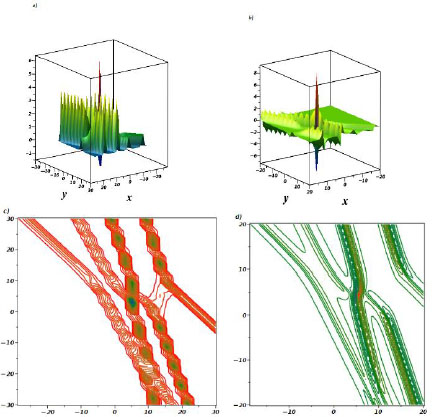
Fig. 11.
Graphs of complex four-soliton wave are plotted for z = 1, t = 2, k1 = 1, k2 = 1, k3 = 2, k4 = 2, l1 = 1, l2 = 0.5, , , j1 = 0.5, j2 = 0.5, , , α1 = 3, β2 = 6, α3 = 9, α4 = 12, β = 1, β = 2: a) Real part, b) Imaginary part, c) Contour plot of real part, d) Contour plot of imaginary part