
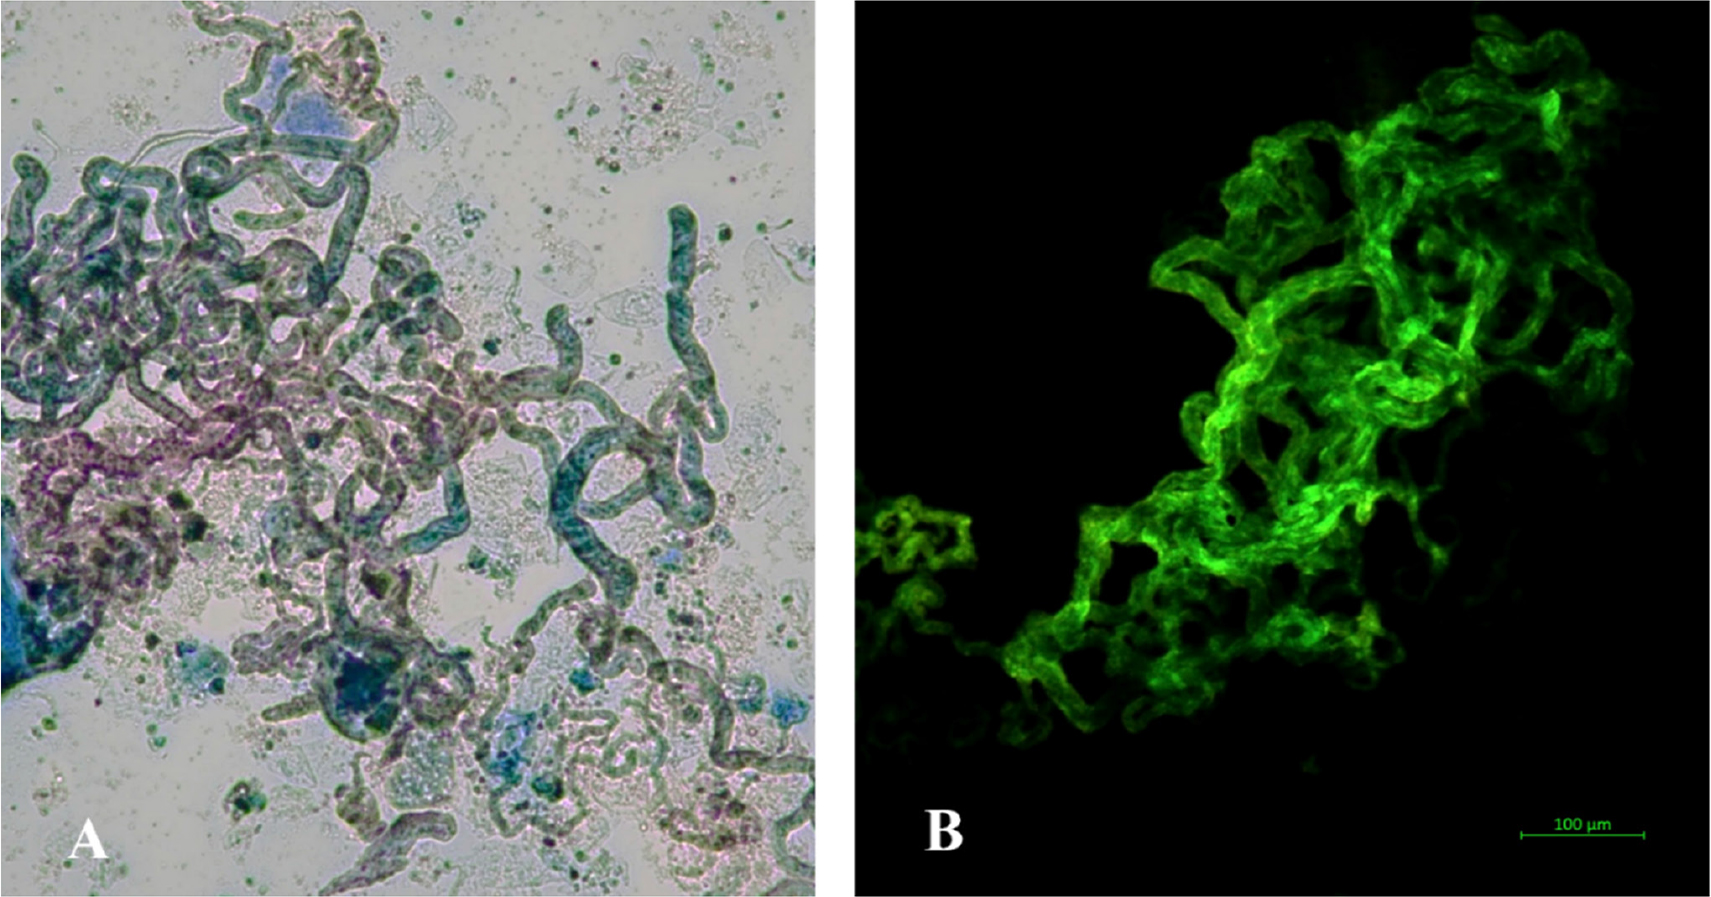
Figure 1.
M. abscessus subs. abscessus visualized by Ziehl–Neelsen staining (A) and auramine fluorescence staining (B). Magnification ×400.
Table 1.
Molecular characterization of M. abscessus subsp. abscessus isolates using the GenoType NTM-DR assay.
| Isolate | Species identification | erm(41) T28 | rrl mutation | rrs mutation | Macrolide resistance | Aminoglycoside resistance |
|---|---|---|---|---|---|---|
| 128/2017 | M. abscessus subsp. abscessus | Present | Not detected | Not detected | Yes | No |
| 126/2018 | M. abscessus subsp. abscessus | Present | Not detected | Not detected | Yes | No |
| 184/2024 | M. abscessus subsp. abscessus | Present | A2058C* | A1408G** | Yes | Yes |
| 199/2025 | M. abscessus subsp. abscessus | Present | A2058C* | A1408G** | Yes | Yes |
Table 2.
Minimum inhibitory concentrations (MICs) and susceptibility categories of sequential M. abscessus subsp. abscessus isolates.
| Antibiotic/Tested strains | MIC [µg/mL] | |||
|---|---|---|---|---|
| 128/2017 | 126/2018 | 184/2024 | 199/2025 | |
| LZD | 4 (S) | 4 (S) | 4 (S) | 4 (S) |
| AMK | 4 (S) | 4 (S) | ≥64 (R) | ≥64 (R) |
| CLR | 1 (S) | ≥16 (R) | ≥16 (R) | ≥16 (R) |
| SXT | 8/152 (R) | ≥8/152 (R) | ≥8/152 (R) | ≥8/152 (R) |
| CIP | ≥4 (R) | ≥4 (R) | ≥4 (R) | ≥4 (R) |
| MXF | ≥8 (R) | ≥8 (R) | ≥8 (R) | ≥8 (R) |
| IPM | ≥64 (R) | ≥64 (R) | ≥64 (R) | ≥64 (R) |
| FOX | ≥128 (R) | ≥128 (R) | ≥128 (R) | ≥128 (R) |
| TOB | ≥16 (R) | ≥16 (R) | ≥16 (R) | ≥16 (R) |
| DOX | ≥16 (R) | ≥16 (R) | ≥16 (R) | ≥16 (R) |
| TGC | 0.5 | 0.5 | 0.5 | 0.5 |
| BDQ | 0.5 | 0.5 | 0.5 | 0.5 |
| DLM | ≥16 | ≥16 | ≥16 | ≥16 |
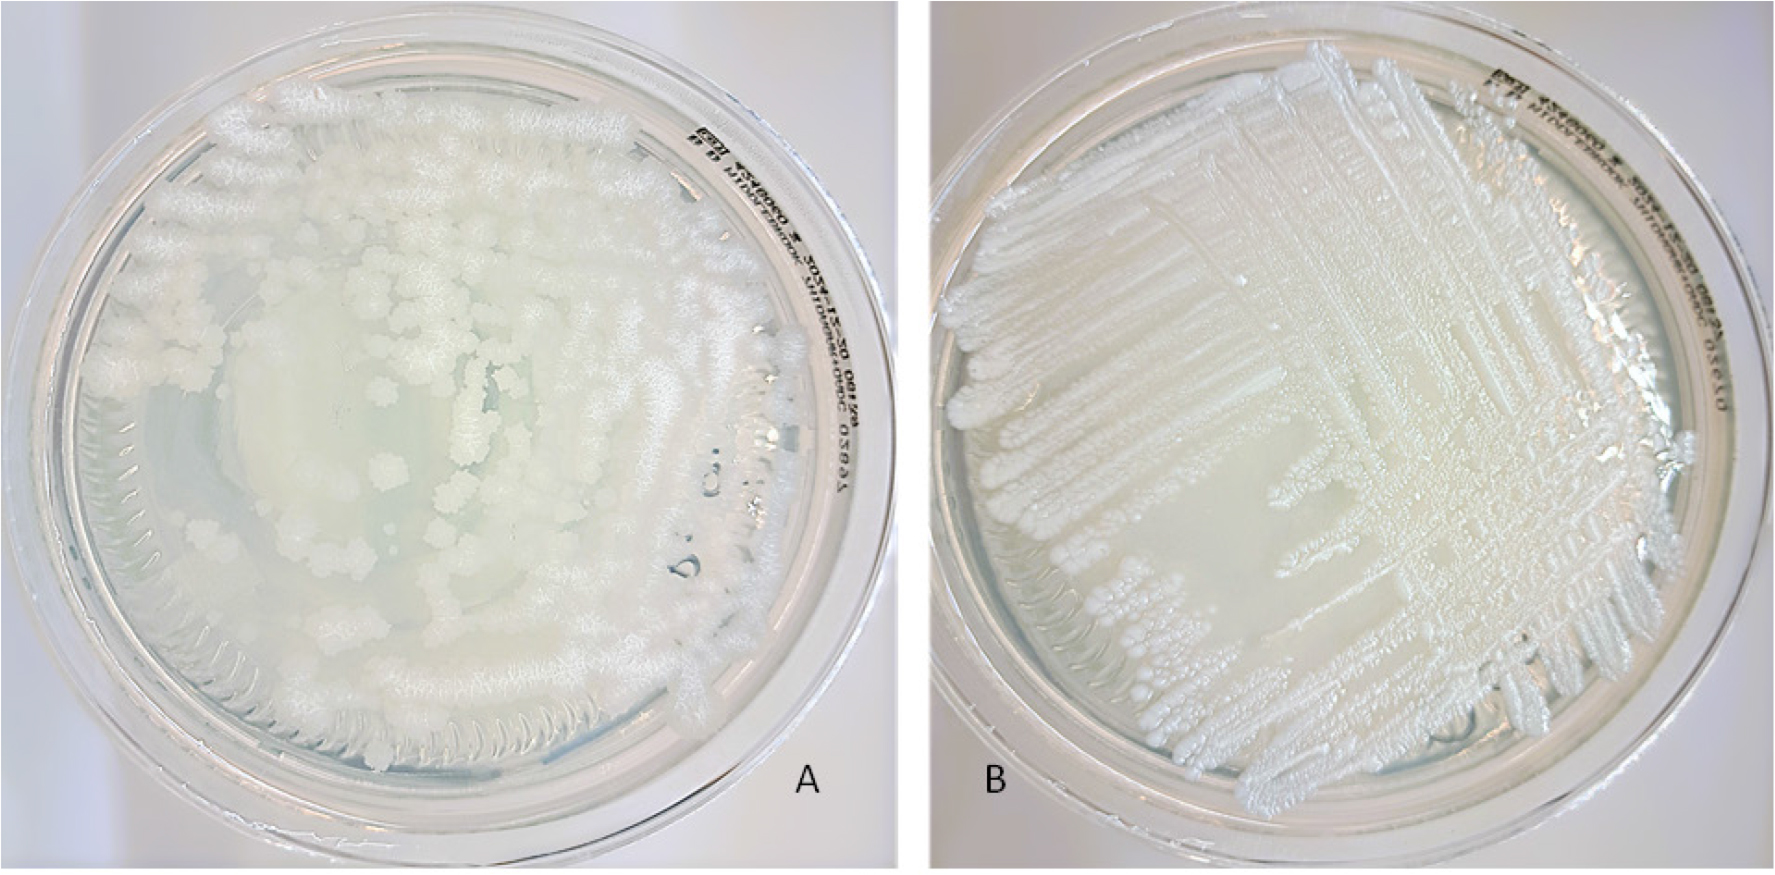
Figure 2.
Representative rough and smooth colony morphotypes of Mycobacterium abscessus subsp.abscessus on Middlebrook 7H10 agar. Rough colonies (A) show a dry, irregular, and wrinkled appearance, whereas smooth colonies (B) are moist, shiny, and have regular margins.
Table 3.
Morphotype characterization and biofilm-forming ability of M. abscessus isolates assessed using Middlebrook 7H10 agar, and Crystal Violet staining methods.
| Strains No. | Species | Morphotype7H10 agar | Biofilm forming | ||
|---|---|---|---|---|---|
| Crystal violet staining method | |||||
| OD595 | OD595/OD595 NC Ratio * | Characterization | |||
| 128/2017 | M. abscessus subsp. abscessus | Rough | 4.89 | 3.74 | moderate biofilm former |
| 126/2018 | M. abscessus subsp. abscessus | Rough | 3.78 | 3.15 | moderate biofilm former |
| 184/2024 | M. abscessus subsp. abscessus | Mixed | 5.98 | 4.63 | strong biofilm former |
| 199/2025 | M. abscessus subsp. abscessus | Mixed | 5.98 | 4.96 | strong biofilm former |
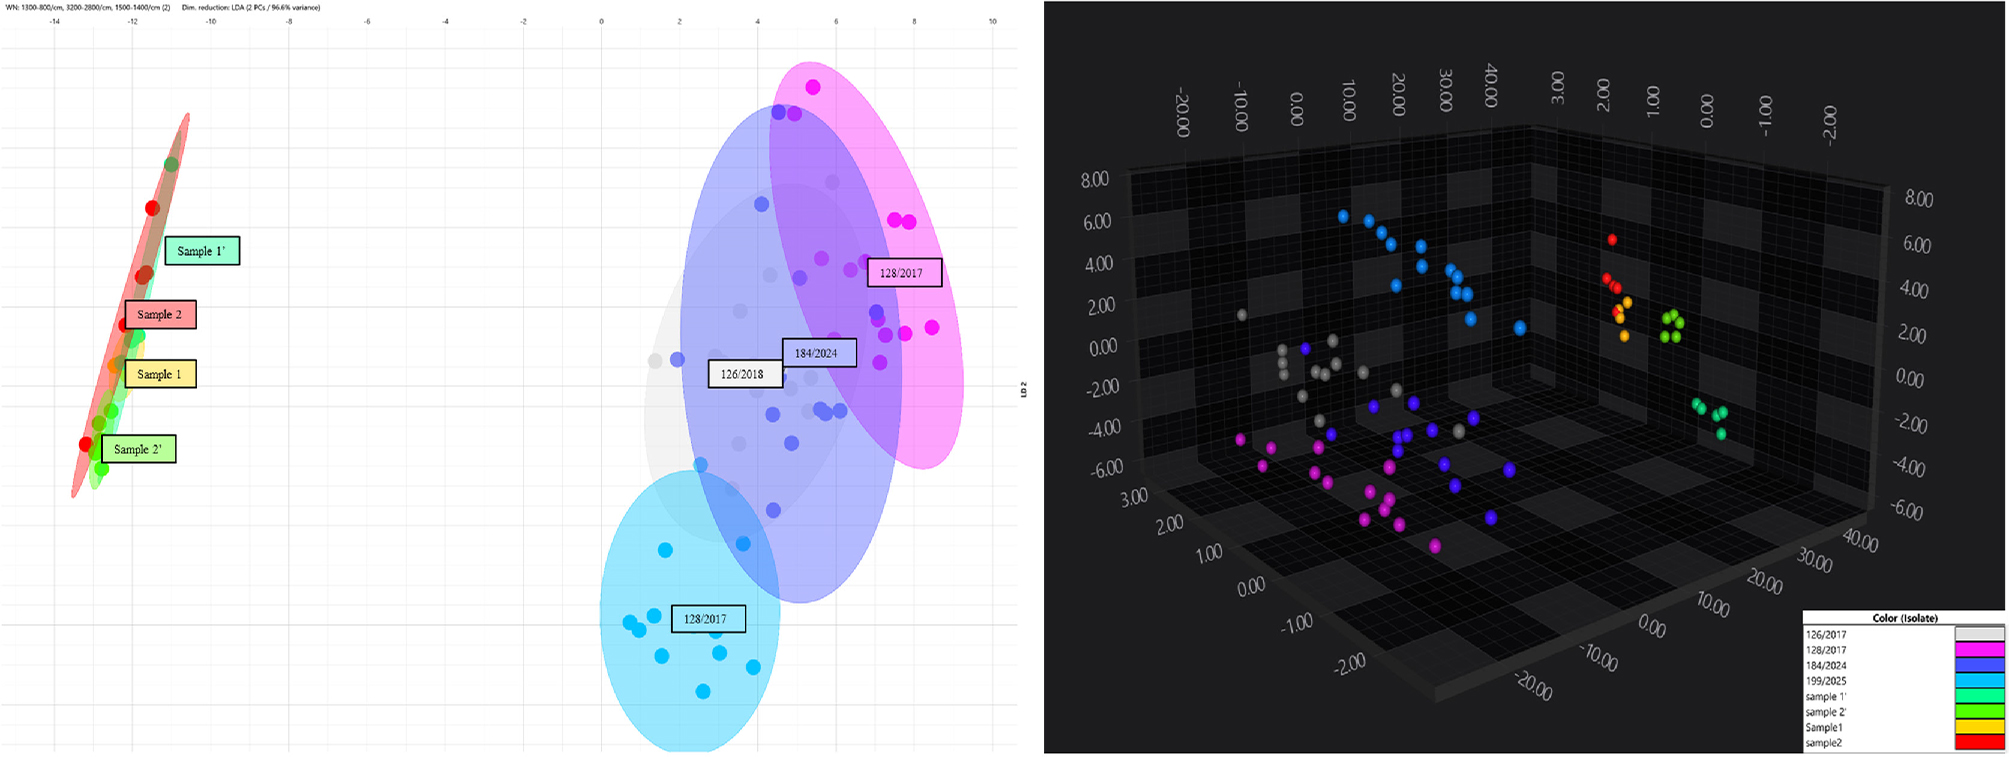
Figure 3.
Two-dimensional and three-dimensional FT-IR spectral profiles of the analyzed isolates.
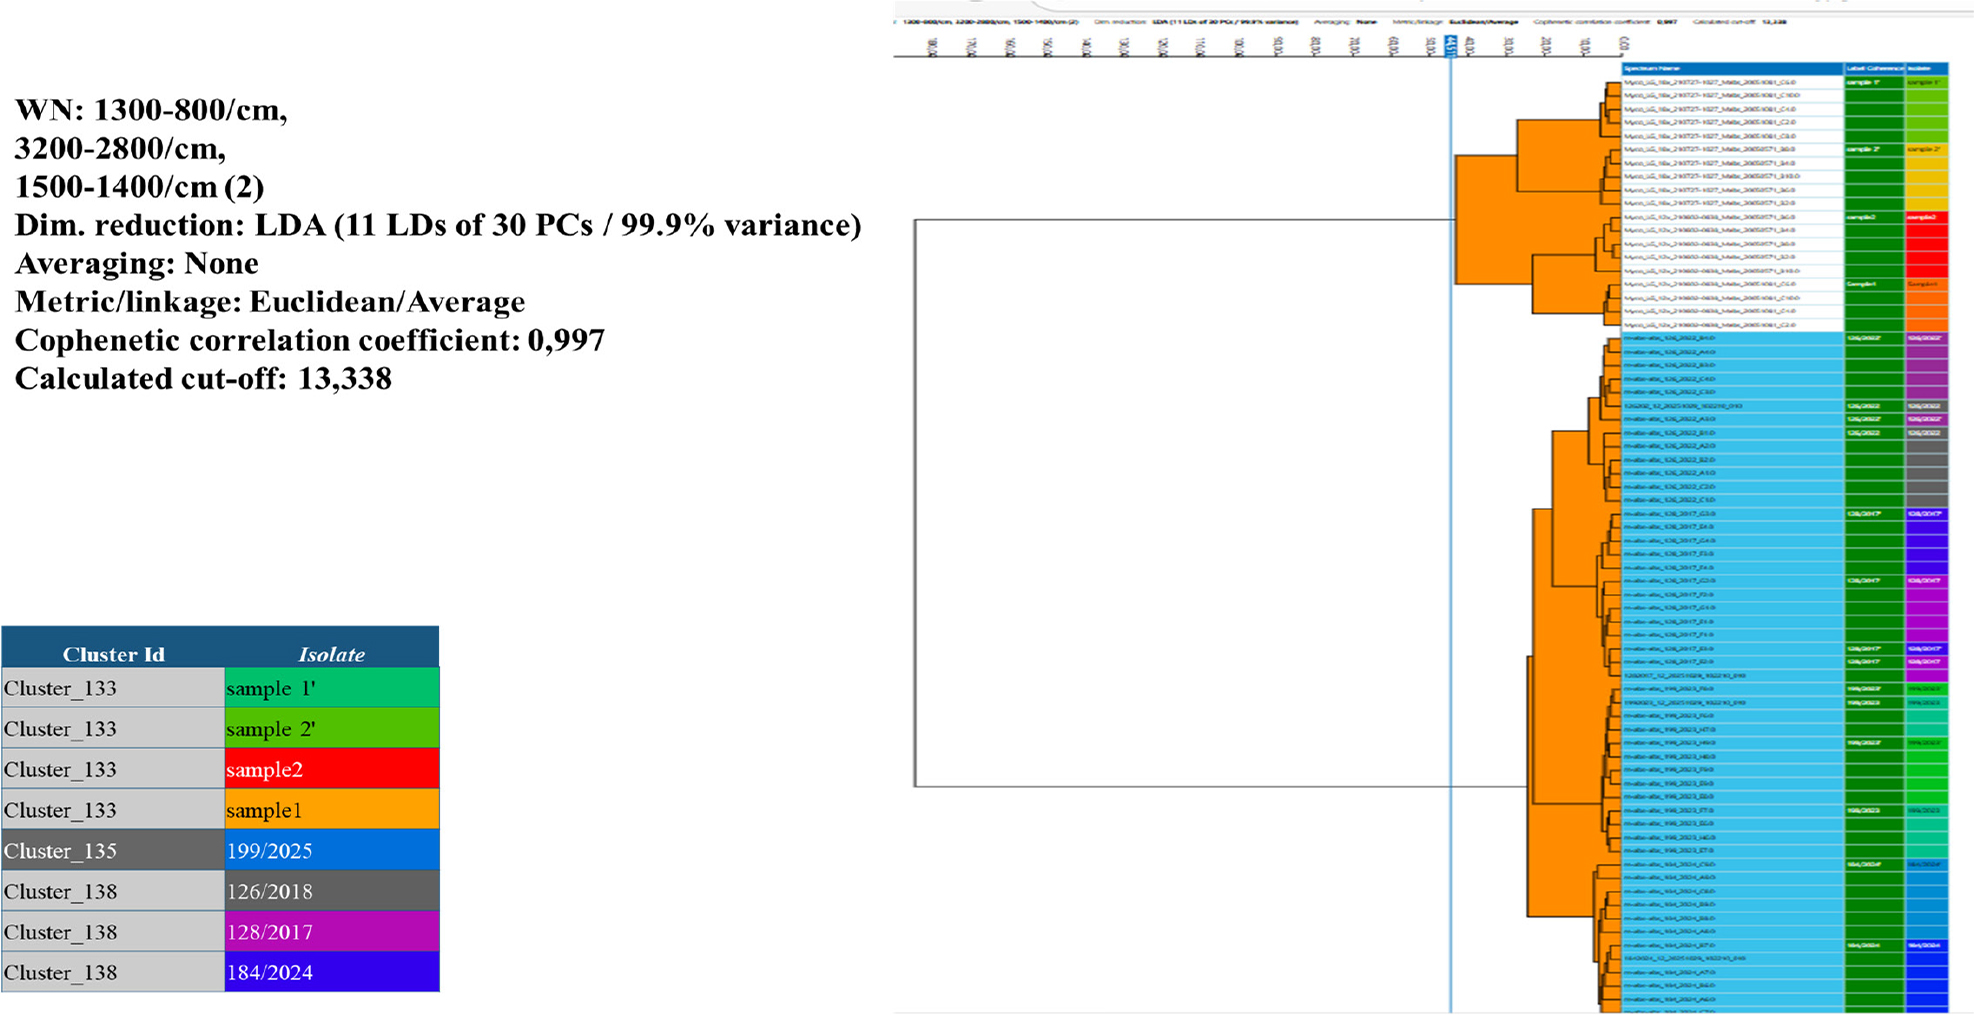
Figure 4.
Dendrogram showing the degree of phenotypic similarity among M. abscessus isolates collected between 2017 and 2025, generated based on FT-IR spectra using the IR Biotyper system.