
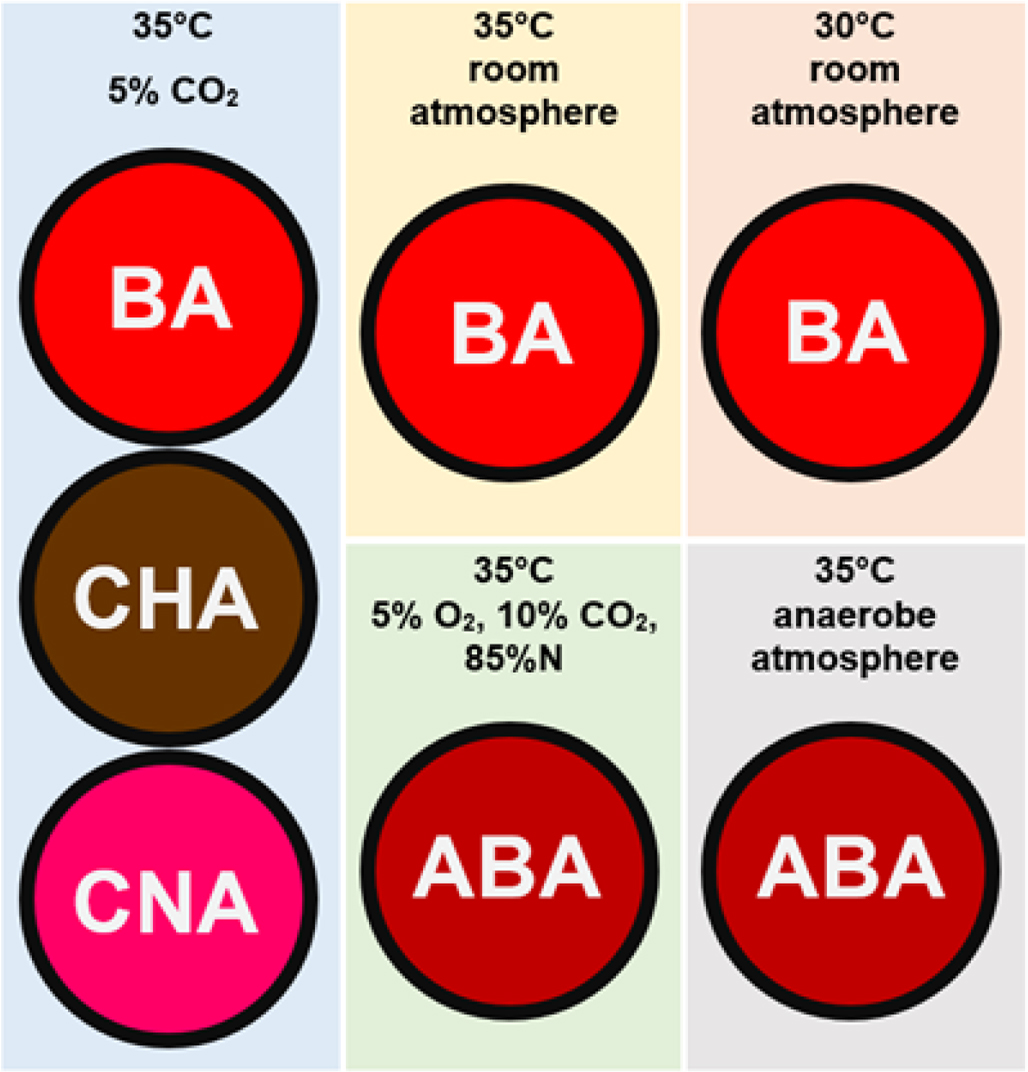
Figure 1.
Summary of plates and conditions that were used for culture (plates: BA – Blood Agar Plate, CHA – Chocolate Agar, CNA – Colistin & Nalidixid Acid Agar, ABA – Anaerobe Blood Agar).
Table 1.
Characteristics of study participants.
| Male | n = 40 (100%) |
| Age | 20–36 years old (mean = 24) |
| Sexually active | n = 30 (75%) |
| Sexual behavior | |
| - vaginal | n = 19 (63%) |
| - oral | n = 27 (90%) |
| - anal | n = 11 (36%) |
| Physically active | n = 17 (43%) |
| Physical activity time | 20–120 min daily (mean =55) |
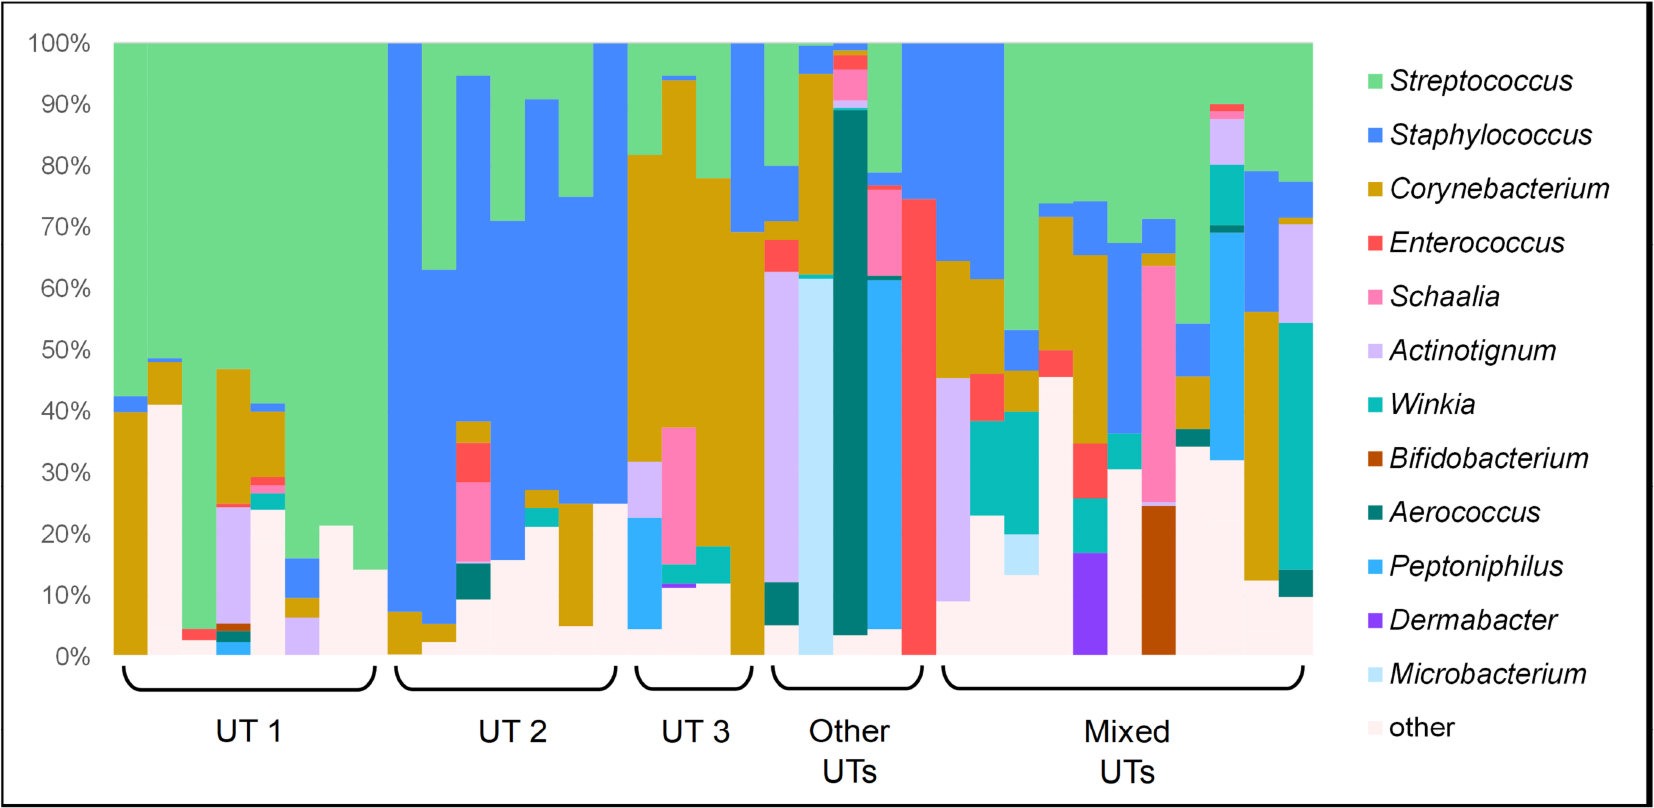
Figure 2.
Graphical presentation of urinary microbiota assessed by expanded quantitative urine culture (EQUC) among examined males (n = 35). Microbiota profiles are shown as stacked bar graphs depicting the relative abundance of various genera. Defined urotypes (UTs) were: UT 1 – Streptococcus spp., UT 2 – Staphylococcus spp., UT 3 – Corynebacterium spp. Other UTs – other genus predominance observed in one sample only, Mixed UTs – no predominant genus detected.
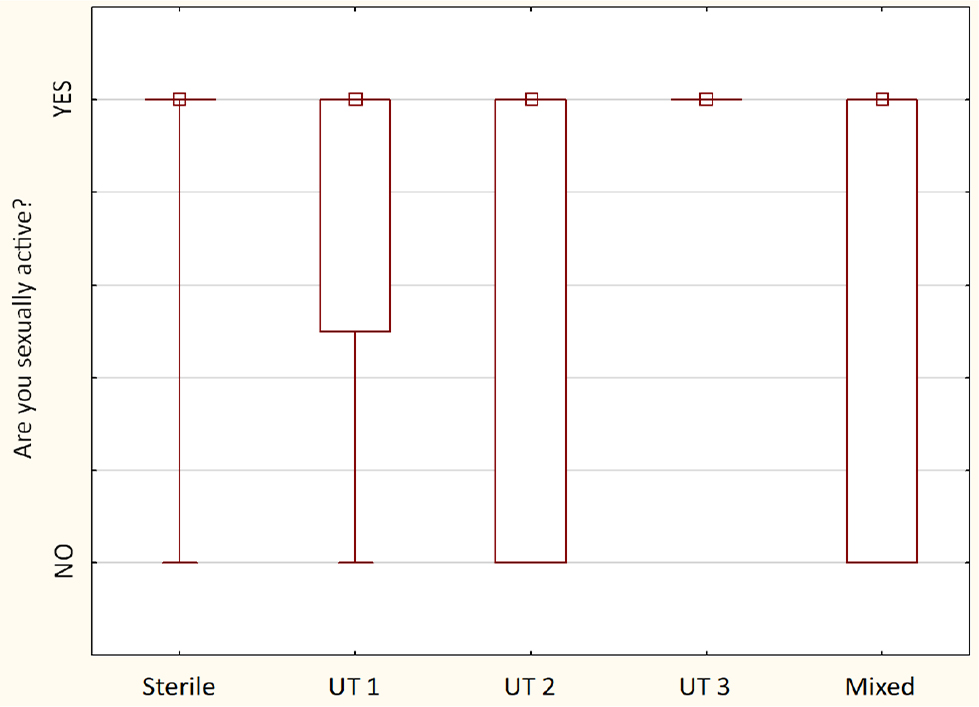
Figure 3.
Comparison of sexual activity between detected urotypes among examined males (n = 40) – the squares show medians; the boxes show interquartile ranges; and the whiskers show total ranges. Legend: Sterile – no bacteria cultured, UT 1 – Streptococcus spp. predominance, UT 2 – Staphylococcus spp. predominance, UT 3 – Corynebacterium spp. predominance, Mixed – no predominant genus detected. Differences between groups were not statistically significant.
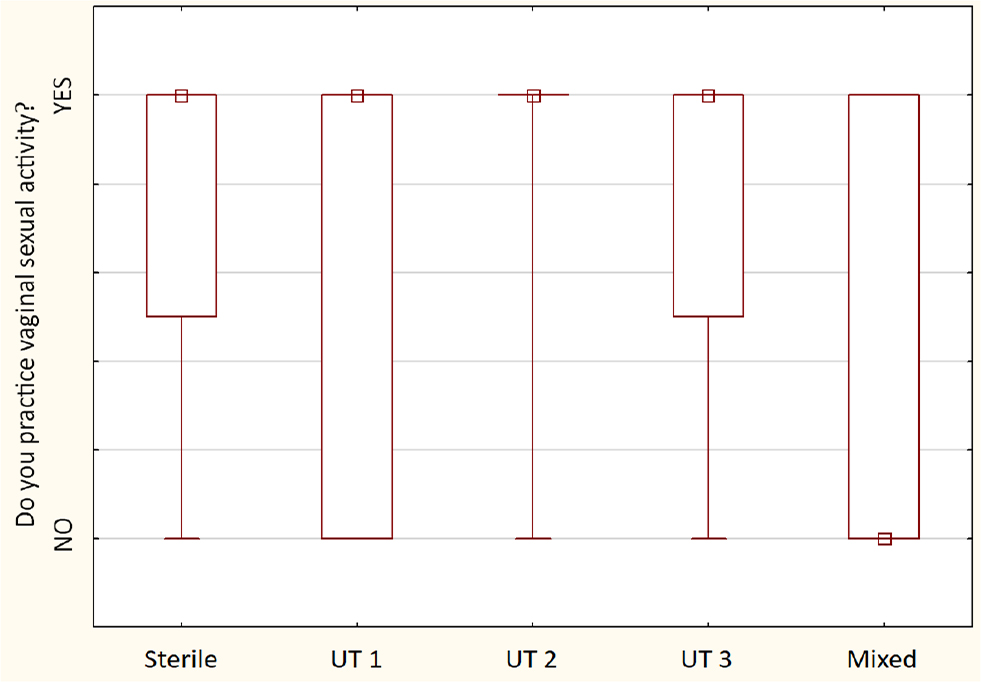
Figure 4.
Comparison of vaginal sexual behavior between detected urotypes between examined sexually active males (n = 30) – the squares show medians; the boxes show interquartile ranges; and the whiskers show total ranges. Legend: Sterile – no bacteria cultured, UT 1 – Streptococcus spp. predominance, UT 2 – Staphylococcus spp. predominance, UT 3 – Corynebacterium spp. predominance, Mixed – no predominant genus detected. Differences between groups were not statistically significant.
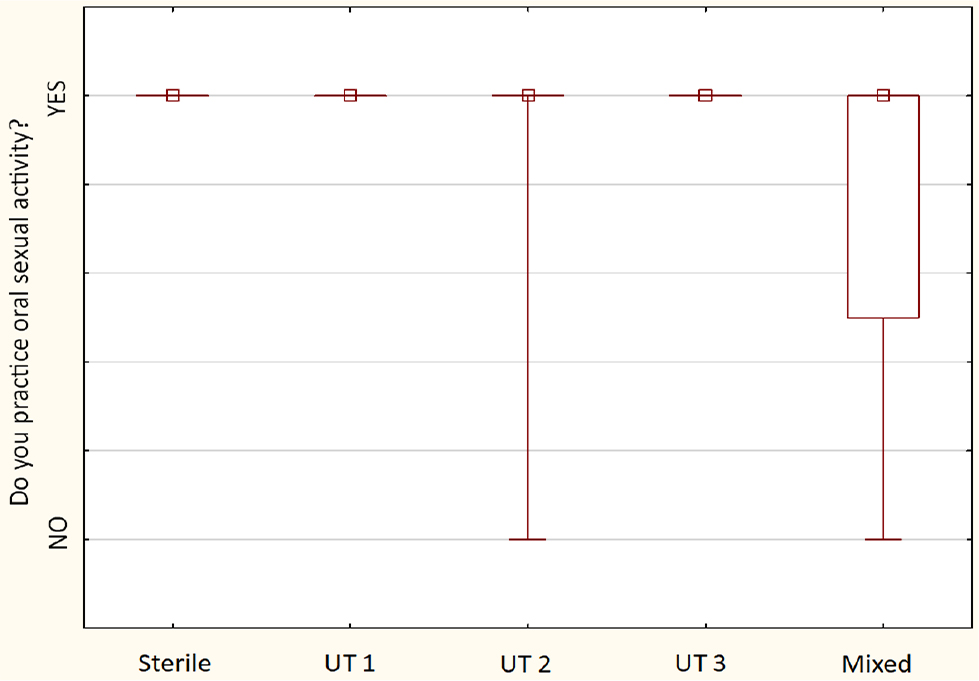
Figure 5.
Comparison of oral sexual behavior between detected urotypes between examined sexually active males (n = 30) – the squares show medians; the boxes show interquartile ranges; and the whiskers show total ranges. Legend: Sterile – no bacteria cultured, UT 1 – Streptococcus spp. predominance, UT 2 – Staphylococcus spp. predominance, UT 3 – Corynebacterium spp. predominance, Mixed – no predominant genus detected. Differences between groups were not statistically significant.
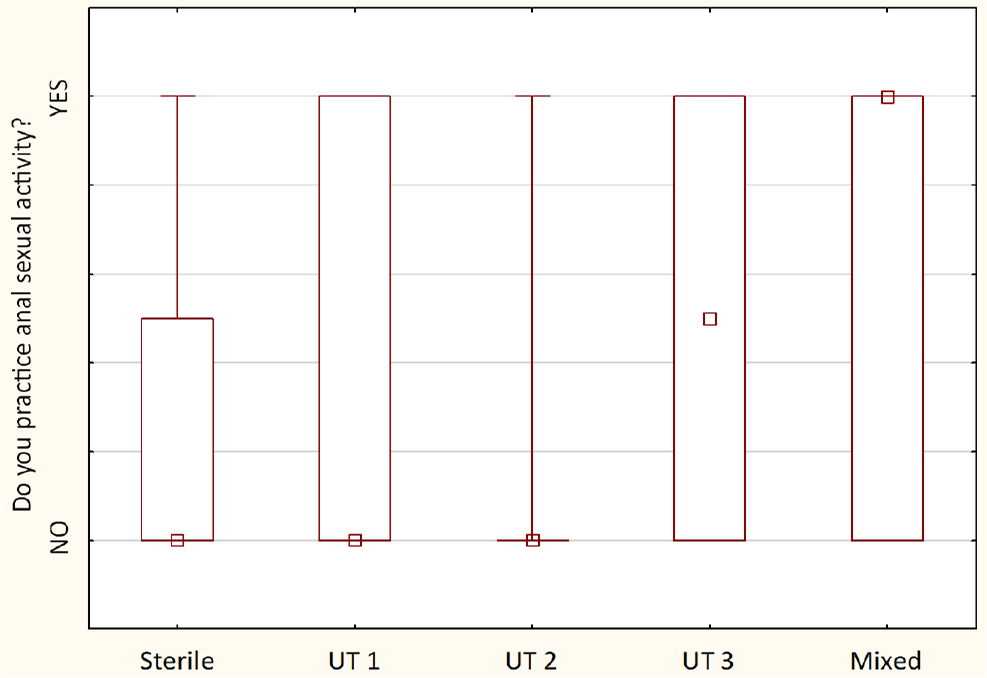
Figure 6.
Comparison of anal sexual behavior between detected urotypes between examined sexually active males (n = 30) – the squares show medians; the boxes show interquartile ranges; and the whiskers show total ranges. Legend: Sterile – no bacteria cultured, UT 1 – Streptococcus spp. predominance, UT 2 – Staphylococcus spp. predominance, UT 3 – Corynebacterium spp. predominance, Mixed – no predominant genus detected. Differences between groups were not statistically significant.
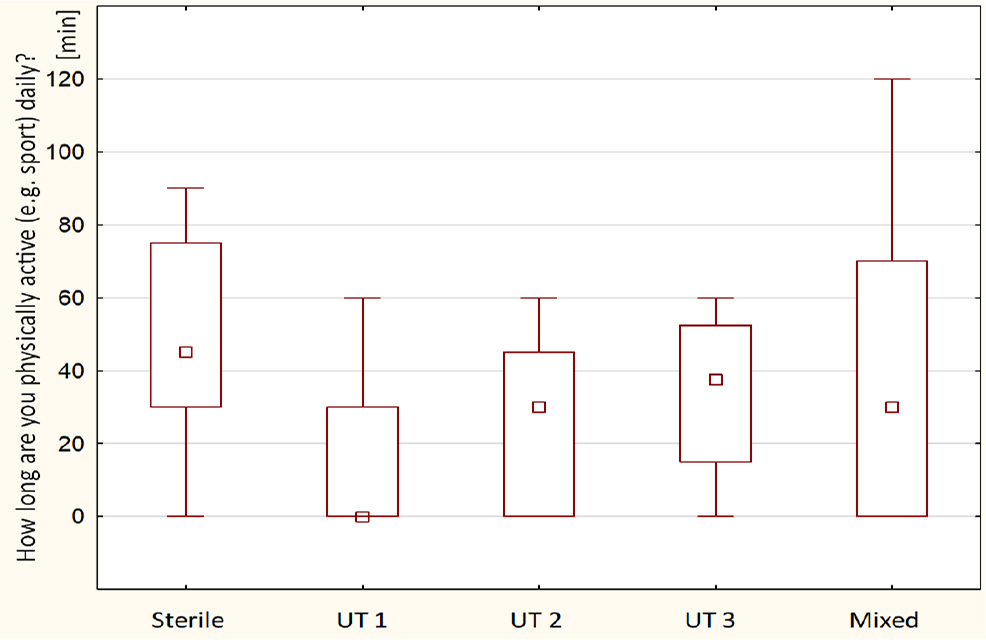
Figure 7.
Comparison of physical activity time between detected urotypes among examined males (n = 40) – the squares show medians; the boxes show interquartile ranges; and the whiskers show total ranges. Legend: Sterile – no bacteria cultured, UT 1 – Streptococcus spp. predominance, UT 2 – Staphylococcus spp. predominance, UT 3 – Corynebacterium spp. predominance, Mixed – no predominant genus detected. Differences between groups were not statistically significant.