
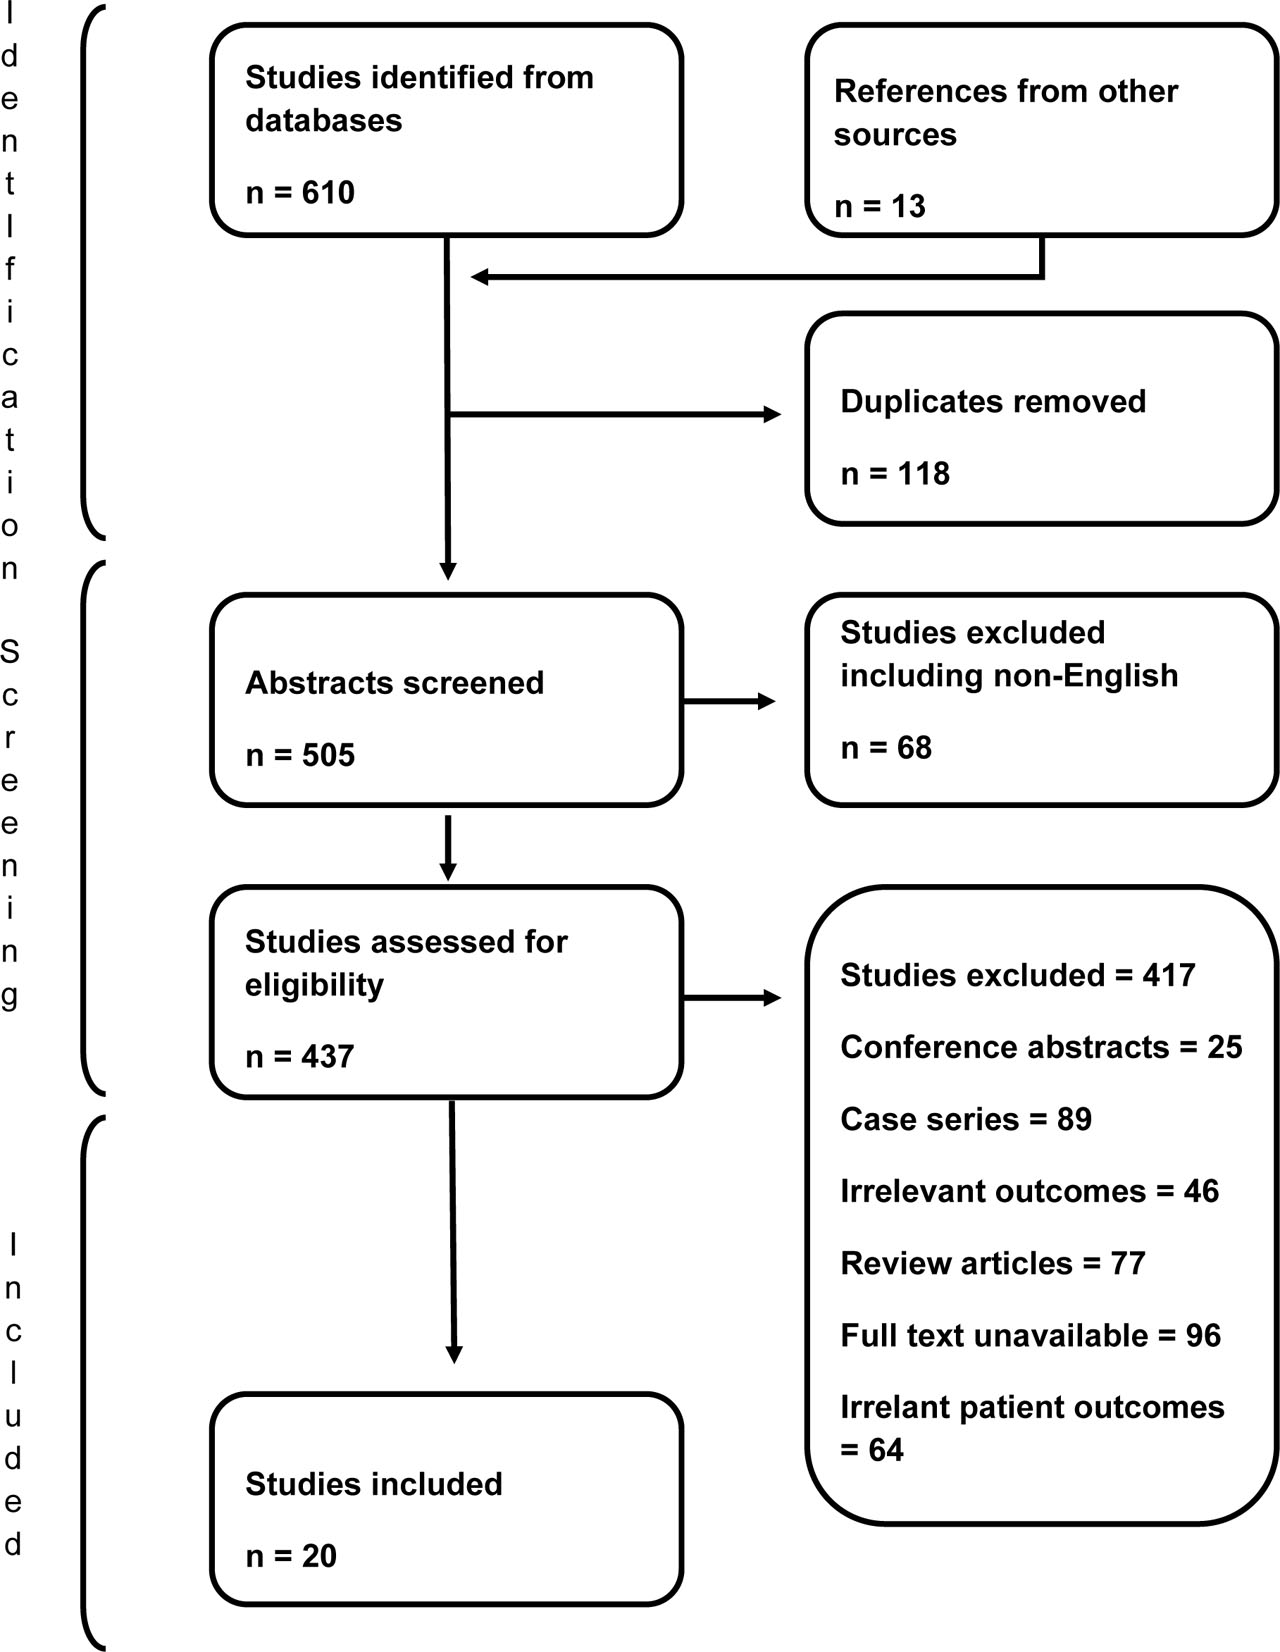
Figure 1.
Flow Chart for Manuscript Attainment
Table 1.
Included Demographic Studies, noting that blank cells represent missing data
| Study | Study type and objective | Study location and design | Time period | Number of cases | Male | Female | Age range | Died | Good outcome |
|---|---|---|---|---|---|---|---|---|---|
| (Aufderheide et al., 1994) | Retrospective | North America (multi centre) | 1978–1990 (12 years) | 306 | 230 | 76 | 239 | ||
| (Penney et al., 2002) | Retrospective | New South Wales Australia (Single centre) | 1996–2001 (5 years) | 42 | 38 | 4 | 13–68 | 5 | 35 |
| (Davidson, 2003) | Descriptive retrospective review | Darwin Australia (single Centre) | 1995–2000 (5 years) | 72 | 49 | 23 | 4 | ||
| (Martin et al., 2005) | Retrospective | Iran (Single Centre) | 1993–2003 (10 years) | 655 | 551 | 104 | 211 | 232 | |
| (Kumar et al., 2005) | Prospective | India (Single centre) | 2000–2001 (2 years) | 64 | 30 | 34 | 9–55 | 4 | 52 |
| (Boots et al., 2006) | Retrospective cohort audit | Queensland Australia (multi centre) | 1991–2000 (10 years) | 161 | 132 | 13 | 13–88 | 26 | 118 |
| (Solhi et al., 2012) | Retrospective | Iran (Single centre) | 2000–2009 (9 years) | 43 | 43 | 0 | 12–38 | 4 | 39 |
| (Yildirim 2015) | Retrospective | Turkey (Single centre) | 2006–2013 (7 years) | 43 | 28 | 15 | 26 | ||
| (Gantois et al., 2017) | Observational study | France (Single centre) | (5 years) | 231 | 199 | 32 | 30–50 | 95 | 136 |
| (Jawaid et al., 2017). | Prospective study | India (Single Centre | 2016–2016 (2 years) | 101 | 72 | 29 | 19–39 | 6 | |
| (Hsu et al., 2018) | Retrospective study | North America (Multi centre) | 1992–2015 (23 years) | 692 | 557 | 135 | 24 - 43 | 532 | |
| (Berke et al., 2019) | Retrospective study | North America (Single centre) | 2005–2015 (10 years) | 98 | 74 | 24 | 20–39 | 19 | |
| (Schellenberg et al., 2019) | Prospective study | North America (multi centre) | 2008–2015 (8 years) | 71 | 64 | 7 | 10 | ||
| (Rhodes et al., 2020) | Retrospective cross sectional | North America (Single Centre) | 2013–2017 (5 years) | 25 | 16 | 9 | 15–49 | 6 | 17 |
| De Charentenay et al., 2020 | Retrospective | Europe (multi centre) | 1992–2014 (22 years) | 886 | 705 | 181 | 389 | 479 | |
| (Bansal & Nayyar, 2023) | Retrospective explorative study | Sydney Australia (Single centre) | 2014–2019 (6 years) | 47 | 33 | 14 | 14 | 16 | |
| Mitra 2023 | Registry based cohort | Victoria Australia (multi centre) | 2010–2019 (9 years) | 243 | 189 | 54 | 134 | 71 | |
| (Salvetti et al., 2023) | Retrospective observational study | France Belgium (multi centre) | 1992–2014 (23 years) | 450 | 350 | 100 | 34–52 | 371 | 79 |
Table 2.
Indigenous Australian Studies
| Study | Study type | Study location | Study time period | Number of cases | Non-Indigenous Individuals | Indigenous Individuals |
|---|---|---|---|---|---|---|
| (Kosky & Dundas, 2000) | Retrospective | Queensland (Multi centre) | 1995–1996 (2 years) | 137 | 102 | 35 |
| (Penney et al., 2002) | Retrospective | New South Wales Australia (Single centre) | 1996–2001 (5 years) | 42 | NO DEFINITION | |
| (Davidson, 2003) | Descriptive retrospective review | Darwin Australia (single Centre) | 1995–2000 (5 years) | 72 | 19 | 53 |
| (Boots et al., 2006) | Retrospective cohort audit | Queensland Australia (multi centre) | 1991–2000 (10 years) | 161 | 153 | 8 |
| (Deasy et al., 2013) | Retrospective cohort audit | Victoria Australia (multi centre) | 2000–2009 (9 years) | 1321 | NO DEFINITION | |
| Mitra 2023 | Registry based cohort | Victoria Australia (multi centre) | 2010–2019 (9 years) | 243 | NO DEFINITION | |
| (Bansal & Nayyar, 2023) | Retrospective explorative study | Sydney Australia (Single centre) | 2014–2019 (6 years) | 47 | 43 | 3 |
Table 3.
Psychiatric illness, Substance Abuse and a Past History of Self-Harm
| Study | Study type | Study location | Study time period | Number of cases | Psychiatric Illness | Substance abuse | Past History of Self Harm |
|---|---|---|---|---|---|---|---|
| (Penney et al., 2002) | Retrospective | New South Wales Australia (Single centre) | 1996–2001 (5 years) | 42 | 22 | 30 | 17 |
| (Davidson, 2003) | Descriptive retrospective review | Darwin Australia (single Centre) | 1995–2000 (5 years) | 72 | 34 | 40 | |
| (Boots et al., 2006) | Retrospective cohort audit | Queensland Australia (multi centre) | 1991–2000 (10 years) | 161 | 67 | 71 | 42 |
| (Gantois et al., 2017) | Observational study | France (Single centre) | (5 years) | 231 | 118 | 69 | 50 |
| (Hsu et al., 2018) | Retrospective study | North America (Multi centre) | 1992–2015 (23 years) | 692 | 403 | 157 | 40 |
| De Charentenay et al., 2020 | Retrospective | Europe (multi centre) | 1992–2014 (22 years) | 886 | 600 | 315 | 266 |
| (Bansal & Nayyar, 2023) | Retrospective explorative study | Sydney Australia (Single centre) | 2014–2019 (6 years) | 47 | 22 | 8 | Inc with psychiatric |
| (Salvetti et al., 2023) | Retrospective observational study | France Belgium (multi centre) | 1992–2014 (23 years) | 450 | 305 | 139 | 28 |
Table 4.
Cardiac Arrest Studies
| Study | Study type | Study location | Study time period | Number of cases | Number of Cardiac Arrest | Cardiac Arrest and Survived | Cardiac Arrest and Died |
|---|---|---|---|---|---|---|---|
| (Boots et al., 2006) | Retrospective cohort audit | Queensland Australia (multi centre) | 1991–2000 (10 years) | 161 | 52 | 24 | 28 |
| (Deasy et al., 2013) | Retrospective case review | Melbourne Australia (Multi centre) | 2000–2009 (9 years) | 1321 | 1321 | 44 | 1277 |
| (Gantois et al., 2017) | Observational study | France (Single centre) | (5 years) | 231 | 104 | 11 | 93 |
| (Hsu et al., 2018) | Retrospective study | North America (Multi centre) | 1992–2015 (23 years) | 692 | 199 | 57 | 142 |
| (Bansal & Nayyar, 2023) | Retrospective explorative study | Sydney Australia (Single centre) | 2014–2019 (6 years) | 47 | 47 | 15 | 32 |
| (Salvetti et al., 2023) | Retrospective observational study | France Belgium (multi centre) | 1992–2014 (23 years) | 886 | 450 | 79 | 371 |
Table 5.
Studies Related to Glasgow Coma Scale
| Study | Study type | Study location | Study time period | Number of cases | 3–8 | 9–12 | 13–15 |
|---|---|---|---|---|---|---|---|
| (Martin et al., 2005) | Retrospective | Iran (Single Centre) | 1993 – 2003 (10 years) | 655 | 68 | 393 | 153 |
| (Jawaid et al., 2017). | Prospective study | India (Single Centre | 2016–2016 (2 years) | 101` | 56 | 22 | 23 |
| (Hsu et al., 2018) | Retrospective study | North America (Multi centre) | 1992 – 2015 (23 years) | 692 | 391 | 36 | 234 |
| (Rhodes et al., 2020) | Retrospective cross sectional | North America (Single Centre) | 2013 – 2017 (5 years) | 25 | 16 | 0 | 9 |
| Mitra 2023 | Registry based cohort | Victoria Australia (multi centre) | 2010 – 2019 (9 years) | 243 | 215 | 20 | 8 |
Table 6.
Studies Related to Cervical Spinal Area Injuries
| Study | Study type | Study location | Study time period | Number of cases | Injury Cervical spine fracture | Injury Laryngo tracheal | Injury Vascular |
|---|---|---|---|---|---|---|---|
| (Martin et al., 2005) | Retrospective | Iran (Single Centre) | 1993 – 2003 (10 years) | 655 | 40 | 30 | 10 |
| (Boots et al., 2006) | Retrospective cohort audit | Queensland Australia (multi centre) | 1991–2000 (10 years) | 161 | 4 | 2 | 2 |
| (Yildirim 2015) | Retrospective | Turkey (Single centre) | 2006–2013 (7 years) | 43 | 6 | 11 | 0 |
| (Jawaid et al., 2017). | Prospective study | India (Single Centre | 2016–2016 (2 years) | 101` | 2 | 0 | 0 |
| (Hsu et al., 2018) | Retrospective study | North America (Multi centre) | 1992 – 2015 (23 years) | 692 | 20 | 37 | 42 |
| (Berke et al., 2019) | Retrospective study | North America (Single centre) | 2005 – 2015 (10 years) | 98 | 3 | 3 | 2 |
| (Schellenberg et al., 2019) | Prospective study | North America (multi centre) | 2008–2015 (8 years) | 71 | 4 | 2 | 3 |
| (Rhodes et al., 2020) | Retrospective cross sectional | North America (Single Centre) | 2013 – 2017 (5 years) | 25 | 2 | 1 | 0 |
| (Bansal & Nayyar, 2023) | Retrospective explorative study | Sydney Australia (Single centre) | 2014 - 2019 (6 years) | 47 | 0 | 3 | 0 |
Table 7.
Potential Presenting Injuries, Signs and Symptoms Following a Hanging Injury
| Airway and Respiratory | • Hoarseness, coughing, hypoxia, dyspnoea, and respiratory failure |
| Cardiac | • Arrhythmia and arrest |
| Cerebral and Brain | • Confusion, seizure, infarct, loss of consciousness |
| Vasculature | • Carotid bruit and neck swelling |
| Dermatological | • Ligature marks, abrasions, petechiae and subcutaneous emphysema |
| • Petechial haemorrhages | |
| Ophthalmological | • Eyelid and or conjunctival petechiae, haemorrhagic retinopathy |
| Gastrointestinal | • Difficulty swallowing, incontinence and vomiting |
Table 8.
Emergency Intervention Following a Near Hanging
| Airway and Respiratory |
|
| Cardiac |
|
| Cerebral and Brain |
|
| Imaging and Testing |
|
| Psychiatry |
|
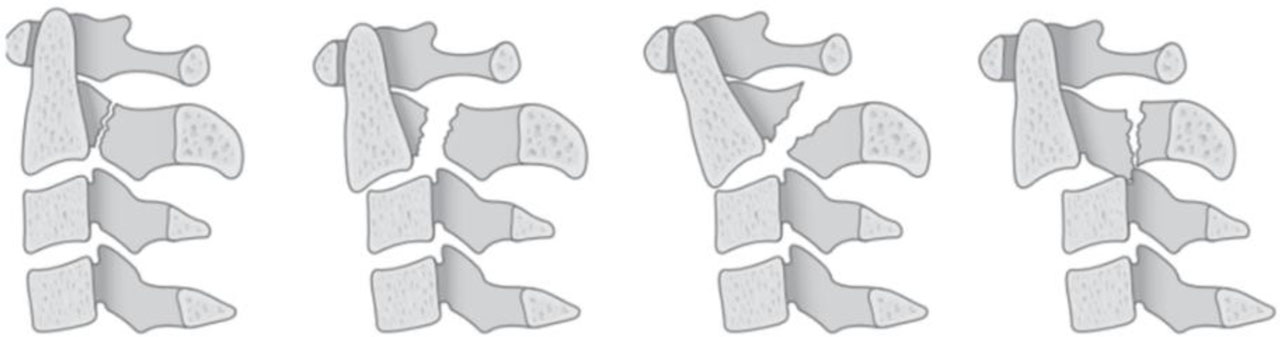
Figure 2.
Schematic Drawing of Hangman’s Fractures by Levine and Edwards classifications (Type I, Type II, Type IIa, and Type III (reading left to right).). Reprinted from https://orthofixar.com/spine/hangmans-fracture.
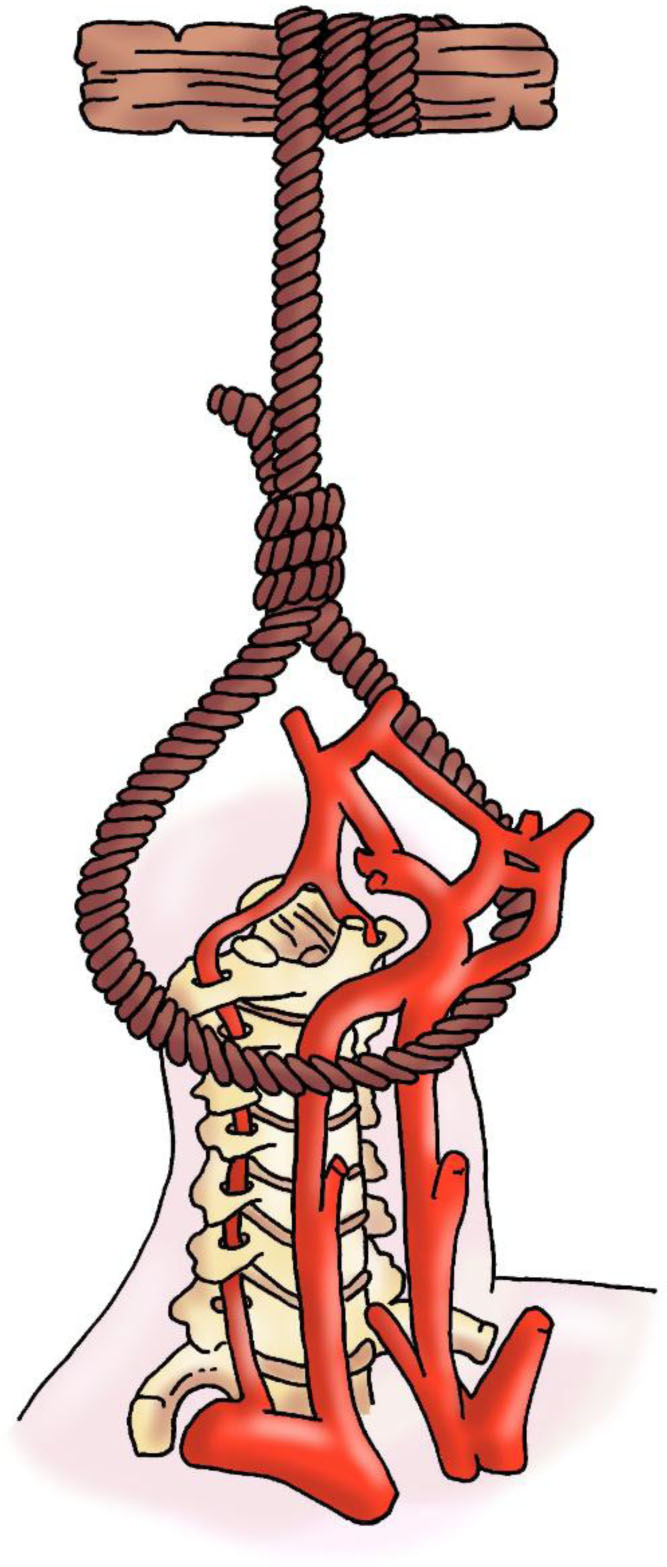
Figure 3.
A Schematic Drawing of the Cervical spine Demonstrating the Cerebrovascular System and the Vulnerability of the Carotid Arteries to Hanging, the Protection that the Vertebrae Provide to the Vertebral Arteries and the Collateral Pathways of the Circle of Willis are also Demonstrated.